Energy Efficiency and Energy Policy in Japan
1973 to 1991
by
Kim Houghton
A thesis submitted for the degree of Doctor of Philosophy of The Australian National University
LIBRARY
Declaration
This thesis was written while I was studying at the Australia-Japan Research Centre at the Australian National University. The opinions in it are my own, unless otherwise indicated.
Kim Houghton June 1995
Acknowledgments
While the analysis and conclusions are my own, this thesis reflects assistance from many people.
Thanks foremost to Peter Drysdale — a perceptive, visionary and relentless supervisor — for encouragement over a long period and for allowing me time to get the foundations laid in 1993. Thanks also to Ben Smith and Stuart Harris for timely and insightful comments, and for patience over what has turned out to be quite a long time.
I would not have been able to get to Japan for fieldwork without the help of Ippei Yamazawa, and an Austrahan Award for Research in Asia. The months at Hitotsubashi formed the thesis, and I owe a lot to Professor Yamazawa, to Kokichi Itoh and Yukari Yamashita from the Energy Data and Modelling Centre, to Hisao Kibune and Naoto Sagawa from the Institute for Energy Economics and to Takayuki Kiji from MITI's Research Institute of Intemational Trade and Industry.
The path towards this piece of work was set by CoUn Myers and Mount Isa Mines when they took a gamble and offered me the MIM Scholarship in Japanese Studies in 1984. The work I did in the next two years developed my interest in the way Japan uses natural resources, developed my Japanese language skills, and introduced me to the Australia-Japan Research Centre. Many thanks to all the people I have worked with at the Centre, in various capacities, over the years, and to Margaret Ricklefs for help editing the early drafts.
Thanks to Ahson Dell for providing me with balance as this work ebbed and flowed the years, and to Natasha and Jeremy for their good company and for help and encouragement with the tricky bits when my own vision became cloudy. I would also like to record my gratitude to colleagues in the Office of Multicultural Affairs for tolerating a frequently distracted employee, and to Abbas Adam, David Pakner, Max Bourke and Nhan Vo-Van for giving me a little slack to help get it all done.
Finally, thanks to Mathinna and Mirri for walking me through the research, writing and almost endless editing, helping keep my feet on the ground. It's hard to be too self-obsessed with a mouse on your foot.
Kim Houghton June 1995
Abstract
This thesis explains the mechanisms behind the dechne in aggregate energy intensity in Japan between 1973, the year of the first oil shock, and 1991, the first major change in the targets of Japanese energy policy after 1973. The study decomposes and
quantifies the importance of structural change and technological change at three levels of aggregation: across the whole economy (between economic sectors); across the manufacturing sector (between industries); and within industries. The effectiveness of govemment energy policies in reducing energy consumption is considered. Prospects for future targets for energy intensity are assessed in the light of the analysis of
changes in the 1973-1991 period, changes in location of energy demand growth in the Japanese economy and a period of low world oil prices.
Aggregate energy intensity, the ratio of total energy consumed to total output, dechned in Japan by some 37 per cent between 1973 and 1991, more than in any other industrialised country. Structural change in the Japanese economy in the period
1973-1991 limits the usefulness of econometric modelhng of energy demand in
understanding the dechne in aggregate energy intensity. The study develops and applies more suitable methodologies which disaggregate the decline in aggregate energy intensity to identify the periods and sectors accounting for the largest shares of aggregate change. This study develops an index for energy intensity based on the Divisia index, which shows that most of the change in aggregate energy intensity was attributable to the manufacturing sector, and that within the manufacturing sector most change was attributable to four energy-intensive industries: iron and steel; ceramics and cement; pulp and paper; and non-ferrous metals .
The method of decomposition by differencing is apphed to energy intensity data to quantify the shares of aggregate change attributable due to structural change and technological advances. Almost 90 per cent of the decline in aggregate energy intensity took place between 1973 and 1985, and most of this was due to
technological change raising the energy efficiency of key industries in the
manufacturing sector. Technological change was supplemented by structural change that saw output shares of the energy-intensive industries fall.
Combination of input-output techniques with these approaches enables incorporation of changes in indirect energy intensities as well as direct energy intensities over the 1980-1990 period. The results show that most change in total energy intensities was due to structural change, with the changing mix of inputs the next most important factor, followed by changes in direct energy intensity.
Detailed examination of four intensive industries shows that energy-saving technologies diffused rapidly in the 1970s and early 1980s. In the late 1980s, however, changes in the output mix favouring more highly processed,
energy-intensive outputs in the steel industry in particular have arrested the fall in industrial energy intensity.
While energy intensities in the manufacturing sector generally stabilised in the late 1980s, energy consumption and intensity levels in the tertiary sectors continued to rise. Household demand for electricity in particular shows rapid growth, and
electricity generation will have an increasingly important role in determining aggregate energy intensity as electricity consumption continues to rise.
Japan has had a broad range of policies to reduce energy intensity since the first oil shock. These policies supported reduction of energy intensity while crude oil prices rose to their peak in the early 1980s. With crude oil prices falling these policies were not particularly effective in delivering continued progress towards long-term objectives of less reliance on oil and greater energy efficiency, although there was no significant reversal of progress achieved earlier.
Contents
Tables Figures
1 Energy Efficiency and the Japanese Economy 1
Conceptual issues 5 Quantifying energy efficiency change in Japan 13
Energy efficiency in a global context 19 Structural adjustment and technological efficiency 31
Conclusion 34
2 The Response to Energy Price Shocks: Price, Policy and other Determinants of Energy Demand
Introduction 38 Energy analysis: alternative methodologies 39
Results from the energy demand literature 44
Techniques applied in this study 53
Conclusion 70
3 Consistent Energy and Output Data for Japan
Introduction 73 Energy consumption data 75
Relationships between core energy data sets 80
Input-output data 83 Industry output data 86 Specific energy and output data 87
Trade data 89 Conclusion 89
4 Energy and Output: Structural Change and Energy Consumption
Introduction 90 Structural decomposition analysis 92
Energy and output: economy wide changes 99 Energy and output: changes within the manufacturing sector 111
Conclusions 128
5 Energy Consumption and Economic Activity
Introduction 131 Data analysis 134 Energy intensities for 1990 138
Comparison over time 149 Decomposition by differencing 156
Trade and energy 164 Conclusions 172 6 Structural Change and Technological Efficiency in Four Energy-intensive
Industries
Introduction 176
Technological and structural changes within industries 178 Energy intensity in the iron and steel industry 180 Energy intensity in the aluminium smelting industry 195
Energy intensity in the cement industry 210
Energy intensity in the pulp and paper industry 216
Conclusion 221
7 Increasing Energy Intensity: Issues in Electricity Demand and Supply
Introduction 226 Electricity demand 229
Residential electricity demand 243 Efficient electricity supply 250
Conclusion 264 8 Energy Policy and Energy Efficiency
Policies and prices 266 Review of Japanese energy policies to 1991 269
Impact of policies on energy intensity 292
Conclusion 306 9 Sweets and Whips: New Energy Policies in Japan
Shifting ground: new energy policies 310
New energy efficiency policy 317 Will the new strategies work? 323
Conclusion 328 10 Conclusions 332
Appendix A 346 Appendix B 347 Appendix C 349
Tables
1.1 Energy consumption in G7 countries and Australia, 1989 22
2.1 Classification of energy demand analysis models 43
2.2 Demand elasticities (all energy) 46 2.3 Elasticities of substitution 52 2.4 Two-sector input-output table 63 2.5 Generic two sector economy 65 2.6 Simplified two sector economy 65 3.1 Sogo Enerugii Tokei [General Energy Statistics] summary
energy balance table for 1991 77 3.2 Publication dates and periods of main energy data sets 80
3.3 28-sector classification 85 4.1 Weighted intensity values 96 4.2 Decomposition of changes in aggregate energy intensity 97
4.3 Energy intensity components, 1991 103 4.4 WeightedcomponentsofE/Y, 1960-1991 104
4.5 Sectoral shares of intensity decline, 1991 106
4.6 Sectoral shares of intensity decline 107 4.7 Structural change and intensity components, 1973-1991 109
4.8 Weighted intensity components (e/y)*(yA') 115 4.9 Weighted component differences and shares of change in manufacturing
sector energy intensity 117 4.10 Components of change in weighted intensities, 1973-1991 119
4.11 Shares of sectoral energy intensity decline, 1973-1991 120 4.12 Components of change in weighted intensities for manufacturing sector
energy intensity, 1985-91 121 4.13 Weighted intensities for 20 industries, 1991 126
4.14 Difference in weighted intensities for 20 industries, 1980-1991 127
5.1 Value of output and fuel consumption, 1990 139 5.2 Comparison of direct primary energy intensities, 1990 141
5.3 Energy intensities, 1990 142 5.4 Top 15 direct energy intensity industries and sectors 144
5.5 Top 15 indirect energy intensity sectors 145 5.6 Top 15 total energy intensity sectors 147 5.7 Relative total energy intensities: 1990 and 1980 150
5.8 Direct and indirect energy intensities, sectors with
largest/smallest 1990/1980 ratios 153 5.9 Structural and technological change components, 1980-1990 155
5.10 Components of change in energy intensity 1980-1990:
full decomposition 159 5.11 Components of falls in total energy intensity: top 15 energy-intensive
sectors 160 5.12 Energy embodied in exports, 1990 166
5.13 Energy embodied in imports, 1990 168
5.14 Primaryenergy and energy embodied in imports, 1980 169
5.15 Primary energy and energy embodied in imports, 1990 170
6.1 Energy consumption by fuel by process, 1991 184
6.2 Iron and steel output by process 186
6.3 Share of output (by process) relative to crude steel output 187
6.4 Energy intensities of main steel-making processes 188
6.5 Quantities of main inputs for production of 1 tonne of aluminium ingots
in Japan (average technology in mid 1980s) 197
6.6 International comparison of per kilowatt-hour aluminium smelting costs
in the early 1980s 205
6.7 Energy sources of electricity generated for aluminium smelting in the early
1970s 206
6.8 Japanese cement kilns, 1987 212
6.9 Energy sources in the pulp and paper industry 218
6.10 Purchased energy requirements per tonne of paper/cardboard output 220
7.1 Share of electricity demand by user type 230
7.2 Electricity consumption and real incomes 233
7.3 Forecast electricity demand 234
7.4 Comparison of electricity consumption and other key growth rates 236
7.5 Components of growth in electricity consumption 237
7.6 Estimation of electricity demand elasticities 241
7.7 Household energy intensity 245
7.8 Mean annual per-household energy intensity growth rates 245
7.9 International thermal efficiency 253
7.10 Planned installation of new generating capacity 258
7.11 New generating capacity by status of approval by EPDCC 260
8.1 Japanese energy policies (mid 1980s) 281
8.2 Moonlight Project - main components 288
8.3 Loans for energy-saving activities and equipment 291
Figures
1.1 Comparative energy-output profiles 5 1.2 Energy consumption per unit of GNP 6 1.3 Japan' s aggregate energy-GDP ratio 7 1.4 Wholesale price indices of crude oil, gasoline and electricity 18
1.5 Total primary energy supply per capita, 1991 20 1.6 Energy intensities in G7 countries, Australia and OECD average, 1991 24
1.7 Energy intensities in 0 7 Countries and Australia 25
1.8 Reduction in TPES/GDP, 1974-1991 26 1.9 Primary energy demand and GDP in Japan 27 1.10 Factors behind change in energy consumption in Japanese manufacturing 32
4.1 GDP by 7 main sectors 100 4.2 Weighted components of EA" 104
4.3 Weighted component shares of EA^ 105 4.4 Shares of change in aggregate energy intensity 108
4.5 Sources of change in manufacturing energy intensity components,
1960-1991 110 4.6 Real output, 9 main manufacturing sector industry groups 114
4.7 Energy consumption, 9 main manufacturing sector industry groups 115 4.8 Weighted energy intensities, 9 main manufacturing sector
industry groups 116 4.9 Difference in weighted intensities of 9 industry groups 118
4.10 Components of change in weighted intensities, 1973-1991 119 4.11 Components of change in weighted intensities, 1985-1991 122
5.1 Direct energy intensities (top 15) 144 5.2 Indirect energy intensities (top 15) 146 5.3 Total energy intensities (top 15) 148 5.4 Structural and technological change components 156
5.5 Components of energy intensity change, top 15 energy-intensive
industries 161 5.6 Components of change in energy intensity in the five sectors with
greatest intensity falls 162 5.7 Components of energy intensity change 163
6.1 Energy consumption in coke, iron and steelmaking by process, 1991 183 6.2 Nominal energy intensity, crude steel production
(excluding coke-making) 188 6.3 Iron and steel industry energy intensity by process 189
6.4 Electricity consumption by aluminium industry component 199 6.5 Japanese aluminium ingot production and production capacity 201
6.6 Aluminium ingot production, imports and consumption 202
6.7 Main sources of imported aluminium ingots 202
6.10 Kiln technologies and share of output 213
7.1 Share of electricity in final energy consumption 235
7.2 Retail electricity price movements and real oil prices 239
7.3 Electricity consumption and electricity/fuel prices 239
7.4 Wholesale electricity price and demand 240
7.5 Household total energy consumption 244
7.6 Sources of electricity generation (utilities) 252
7.7 Share of total primary energy supply supplied to thermal
electricity generation 252
7.8 Electricity demand for Tokyo over a 24 hour period 257
8.1 Long-term energy consumption trends: share of primary energy supply 272
8.2 Energy consumption in the manufacturing sector, 1960-1975 273
8.3 Japanese real energy prices 278
8.4 Japan's energy-related budget (General Account) 282
8.5 Japan's energy budgets (coal, oil and electricity special accounts) 283
8.6 Sunshine Project budget by main research area 288
1 Energy Efficiency and the Japanese Economy
Energy consumption patterns in Japan have gone through remarkable change in the
last twenty years. The Japanese economy is currently one of the most energy efficient
in the world, in terms of gross domestic output per unit of energy input. In the two
decades following the sudden oil price rises in 1973, there was a greater improvement
in overall energy efficiency in Japan than in any other industrialised country.
Japan is sometimes held as a model of an advanced economy moving along a
low energy growth path while sustaining relatively high levels of economic growth.
Between 1973 and the mid 1980s energy consumption in Japan appeared to have been
decoupled from economic growth. This apparent decoupHng was the basis for a large
fall in Japan's aggregate energy intensity.
Despite these dramatic changes, something of a gap remains in understanding
the changing structures of energy consumption in Japan, namely the nature and extent
of the influences of technological change and structural adjustments on energy
consumption in the Japanese economy. While there has been some work on the
determinants of aggregate volumes of energy demand (Ikuta 1991a; Thorpe et al
1991; Sakisaka 1985; Institute of Energy Economics 1984) there have not been
studies using disaggregated data, or studies that remove the effects of increasing
output levels on energy consumption.
In a chmate of renewed global concern about the impact of energy
revised in the early 1990s. The new energy policies set the goal of maintaining the rapid decline in aggregate energy intensity that was observed over the 1973-1990 period through until 2010. This study assesses this goal on the basis of disaggregated analysis of the changes in energy consumption and intensity patterns in Japan between
1973 and 1991.
This thesis aims at a better understanding of energy demand and structures and energy intensity patterns in Japan and their relationship to economic structures and economic growth by disaggregating five key components of energy demand. The five components are:
i) changes in energy intensity in the manufacturing sector, which has been both the main energy consuming sector and the source of most of the energy efficiency gains in the last twenty years;
ii) evaluation of the role of inter-industry trading and indirect energy consumption in energy efficiency gains;
iii) analysis of the processes of technological change in key energy-intensive manufacturing industries and assessment of the scope for further energy efficiency gains;
iv) the impact of the emerging high energy demand growth areas — electricity consumption and private (residential) energy consumption in particular; and
v) the structure and impact of energy efficiency policies over this period and the emergence of a new energy policy agenda.
Decomposing the energy efficiency changes in the manufacturing sector allows the main periods of change and the industries most responsible for change to be
Conservation Centre of Japan (ECCJ) 1992; Enerugii Keiryo Bunseki Senta [Energy Data and Modelling Centre(EDMC)] 1993a). The technique identifies the growth (or reduction, in the case of energy conservation) in energy consumption due to each of these components. This study uses a similar technique to apportion change in energy intensity between a technological efficiency component and an economic structural adjustment component. Analysis of energy intensity rather than energy consumption removes the effect of the main cause of energy consumption growth, increases in production.
Current Japanese energy policy sets a target rate of decline in aggregate energy intensity for the next 15 years, rather than setting target levels of energy consumption. The decomposition undertaken here is therefore more useful in
assessing the projections and predictions for energy efficiency that are a central part of the revised energy policy agenda than is other analysis which focuses on energy consumption levels.
The shares of energy demand induced by inter-industry trading are derived in this study using input-output data. The methodology allocates energy consumption across all sectors of the economy and allows quantification of the share of energy intensity change attributable to final demand and the share attributable to intermediate demand, which includes trading between producing sectors before goods are delivered to final demand. The methodology enables analysis of the share of energy intensity change attributable to changes in indirect energy consumption — the energy embodied in inputs.
Data on four key energy-intensive industries responsible for a large proportion of overall energy efficiency gains are examined in this study to determine the micro-level processes of adjustment and provide a bottom-up perspective on the
determinants of energy demand and energy intensity in Japan. Projections on future technological change are best assessed in the context of change that has occurred over the last twenty years, adding a micro perspective to the projections for future
aggregate efficiency gains.
demand in particular growing strongly in the residential and business sectors. Future improvement in aggregate energy efficiency will be constrained by these sources of energy demand. Levels of demand for electricity and other residential energy sources are closely related to income levels, and as incomes in Japan continue to rise, it is important to quantify the likely impact of continued growth in energy demand in these areas.
Finally, Japan's improved energy efficiency performance must be considered in the light of energy-saving and energy source-diversification policies and the measures made available to advance those policies. Japan's energy policy continued largely unchanged through the 1980s, despite the change in policy environment due to a number of factors including a period of lower real oil prices (Nemetz et al 1985). Energy pohcy underwent significant revision in the early 1990s in response to the emergence of concerns about the link between economic growth, energy consumption and environmental degradation — greenhouse gas emissions in particular (Ikuta 1991, Fukami 1992).
Each of these five components provides a piece of the puzzle that explains the dramatic reduction in aggregate energy intensity in Japan over the 1973-1991 period and locates the key sources of this improvement. The results allow careful evaluation of revised energy policy and of the projections of a similar scale of aggregate energy efficiency improvement in the following twenty years.
The analysis in this thesis complements existing literature by providing results for Japan that can be compared with results for other OECD countries, thus
identifying the characteristics of change in energy consumption and efficiency patterns in Japan that are shared, and those that are unique. Cross-country comparisons
indicate that the improvement in aggregate energy efficiency in Japan has been greater than in any other industrialised country.
The analysis presented here also adds an important dimension to policy debates on maximising the economic efficiency of energy use. This relates to current Japanese policies aimed at reducing energy consumption, greenhouse gas emissions and dependence on oil without restricting economic growth. Current policies set greenhouse gas emission reduction targets for early next century which are based on continuing high rates of aggregate energy efficiency improvement. The energy
efficiency solution seeks a reduction in the rate of growth of fossil fuel consumption, thus reducing greenhouse gas emissions while maintaining economic growth. The justification for the high rate of energy efficiency improvement forecast for Japan in
these policies is the ver>' large fall in aggregate energy intensity in the last twenty years. Empirical work in this study tests the scope for changes in aggregate energ>' intensity of the same magnitude over the next twenty years. I f the energy efficiency improvement targets are not met, the target greenhouse gas emission levels will not be achieved unless economic growth in Japan remains lower than government forecasts.
C O N C E P T U A L I S S U E S
[image:17.609.77.547.455.791.2]Energ\' consumption has been closely tied to economic growth since the beginning of the industrial revolution. An economy's total energ>' consumption (E) and total GDP ( Y ) can be related either as elasticities or as a ratio (Proops 1984). Several authors suggest that the elasticity, (dE/dY)/(EAO, has been unstable for many countries since the oil price rises of 1973 (Proops 1984, Ramain 1986; Nguyen 1984) and this short-run instability makes the energ>'-output ratio, E , ^ , the preferred index of aggregate energ\' efficiency, though there has been some debate over this conclusion (see, for example Hsiao and Hsiao 1985).
Figure 1.1 Comparative energ>-output profiles ( % of peak value)
Source: Reproduced from Proops 1984 p 48.
Vers' lone run aggregated data suggests that as an economy develops, its gross energ>--output ratio (the 'energ>' coefficient') appears at first to increase, typically through a phase of rapid industrialisation, and then to decrease as it moves into a
industrialised e c o n o m i e s (see Figure 1.1 above) and can also be seen in J a p a n ' s case ( F i g u r e 1.2). T h e G D P elasticity of energy c o n s u m p t i o n f o r developing countries is typically less than 1 (Desai 1986), while elasticities b e t w e e n labour and energy are typically well a b o v e 1 ( S i d d a y a o et al 1987), due t o the high rates of g r o w t h of industrial capacity c o m m o n in many industrialising countries.
A similar scale chart for Japan derived by J a p a n ' s National Institute for R e s e a r c h A d v a n c e m e n t ( N I R A ) is r e p r o d u c e d b e l o w (Figure 1.2).
F i g u r e 1.2 Energy c o n s u m p t i o n per unit of G N P
(million t o n n e s of coal equivalent per 100 billion y e n at 1934-36 prices)
1870 1880 1890 1900 1910 1920 1930 1940 1950 1960 1970 1980 1990 S o u r c e ; R e p r o d u c e d f r o m National Institute for R e s e a r c h A d v a n c e m e n t
(NTRA) 1981 p 159.
F i g u r e 1.2 s h o w s six main phases in J a p a n ' s e n e r g y - o u t p u t ratio t h r o u g h t o t h e late 1970s. M o r e recent data is shown in Figure 1.3. Figure 1.2 s h o w s a cycle of a g g r e g a t e elasticities oscillating around unity. Until the end of the First W o r i d W a r J a p a n gradually b e c a m e m o r e energy intensive as m a n u f a c t u r i n g capacity g r e w , particulariy in steel and chemicals. This g r o w t h w a s blocked by the a f t e r m a t h of the T o k y o e a r t h q u a k e and the Great Depression, but returned in the phase of rapid industrialisation and a r m a m e n t leading up to the Second W o r i d W a r ( N I R A 1981). N o t r e n d s are clear during the period of war and the immediate p o s t - w a r
r e c o n s t r u c t i o n era, but the figure shows the resurgence of energy intensification t h r o u g h the 1960s until the first oil shock in 1973.
While these intensities and the e n e r g y - o u t p u t ratio itself are useful in
[image:18.609.51.560.205.812.2]energy efficiency and inter-industry structural adjustment, frequently work in opposite directions and need to be separated to allow clear understanding of the mechanisms underlying gross changes and to permit cross-country comparison (Reitler et al 1987). This is clear in Figure 1.3 which shows the post-war period in more detail. While the trend in aggregate energy intensity is clear, there is no information in the figure as to the sources of change in EA^, specifically the nature and extent of technological energy efficiency gains and intensity change induced by economic structural change.
Figure 1.3 Japan's aggregate energy-GDP ratio (% of peak value)
100 T 90 8 0 -70 -• 6 0 50 -40 •• 30 2 0
-1 0 -•
0 -CO Ln O) LO O)
-H—I—I—I—h 05 C\J LD
(J> O)
—I—I—I-LD CD O) H—I-CO CD
cy> N-O) cn
H 1 1 1—I 1—I 1 1 1 1 1 O CO C33 CO 00 CD CD CO C3) CD CO C35
OM (3) CD
Source: Energy data is total primar>' energy supply (10 bilhon kilocalories) from Shigen Enerugii Cho [Agency of Natural Resources and Energy (ANRE)], Sogo Enerugii Tokei 1992 [General Energy Statistics 1992] pp 362-366 and Enerugii Keiryo Bunseki Senta [Energy Data and Modelling Centre (EDMC)] Enerugii Keizai Tokei Yoran '94 [Energy Economics Statistical Handbook 1994] p 17; GDP data (1985¥biUion) from Keizai Kikaku Cho [Economic Planning Agency], Kokumin Keizai Tokei Nenkan [National Economic Statistical Yearbook], 1992 pp 442-449, 1993 p 194.
Japan's post-war energy intensit)' profile in Figure 1.2 and Figure 1.3 mirrors the post-war profiles for Italy and the United States, and to a lesser extent the United Kingdom, as shown in Figure 1.1. Japan's energy intensity rose quickly through the
intensification to rapidly decreasing intensification, and then the slowdown and
stabilisation of aggregate energy intensity —is one of the main motivations for this
study.
The major structural break in the long run picture in Figure 1.3 is the first oil
shock in late 1973. The term 'shock' was coined in Japan and is still used in Japan to
describe the rapid, near five-fold increase in crude oil prices between 1972 and 1974.
The price of crude delivered in Japan more than trebled in less than a year, jumping
from US$3.31/bbl in September 1973 to US$11.47/bbl in August 1974. At the time,
Japan was highly dependent on crude oil as a fuel source as it was meeting over
77 per cent of Japan's energy needs (on a kilocalorie base) in 1973. Dependence on
Middle East oil in particular was very high, with that region accounting for over
78 per cent of Japan's imported crude (ECCJ 1992). The crude oil price rises had a
severe impact on the Japanese economy (Hein 1990).
Energy intensities in all the industrialised economies have generally decreased
in the twenty years since this price shock, with the decrease in Japan considerably
greater than comparable economies. In the 1960s Japan's economy became more
energy intensive as the post-war reconstruction phase moved into a period of rapid
industrialisation based on energy-intensive manufactiuing industries (Uekusa and Ide
1986 p 7). Japan's energy-output elasticity was well above 1 (indicating more rapid
growth in energy consumption than output) in the 1960s, corresponding to the rising
part of the curve in Figure 1.3. The oil price shocks tumed this trend around,
however, and in the mid 1970s the income elasticity of final energy consumption
dropped below 1, to a low of 0.23 between 1973 and 1979, suggesting a decoupling
of energy demand from output growth. The elasticity rose again through the late
1980s, to 0.84 between 1986 and 1992 (EDMC 1994 p 15).
Japan's apparent decoupling of energy demand growth from economic growth
in the 1970s has been interpreted as heralding a new era of sustained high economic
growth rates with low energy growth rates (see, for example, The Association for the
Conservation of Energy's Lessons from Japan 1990), and is being referred to more
often in the current chmate of global environmental concems which stresses
maximising the efficiency of energy use. More thorough analysis undertaken in this
study which decomposes the aggregate changes between 1973 and 1991, suggests
that they reflect two major contributing factors. The first factor was the round of
installation of energy-saving technologies that followed the first energy price shock in 1973. The second factor has been the change in international comparative advantage of Japanese firms as a result of rapid changes in energy prices, the rising value of the yen and growth in nearby industriahsing economies. This change in comparative advantage is reflected in Japan's domestic economic restructuring and the changing pattern of Japan's commodity trade.
Seen in this light, the apparent decouphng of energy consumption from economic growth is a response to a set of disparate but complementary underlying economic factors. This response has resulted in a fundamental shift in the nature of energy demand in Japan, especially in the manufacturing sector, serving to make the sector much more energy efficient. But as Japan's economy continues to grow and evolve, renewed demands for energy are returning through different parts of the economy. The main sources of energy demand growth have shifted from the
manufacturing sector to the commercial and residential sectors. This observation has profound implications for the 1990 and 1992 energy pohcy revisions that aim at
extending the gross efficiency improvements observed in the 1973-1990 period for the twenty years to 2010. Japan's economic structure in 1990 was very different from that in 1973 and the scope for major aggregate energy efficiency gains has shrunk
considerably as a result of the gains in the last twenty years.
The energy-intensive manufacturing sector was the dominant source of energy demand growth in the 1960s and early 1970s, but the share of energy consumption and output from this sector has shrunk significantly (Fujime 1989; Sagawa 1990; Hein 1990). These two factors have combined to improve substantially the net energy efficiency of the manufacturing sector, an improvement which was the basis of the overall reduction in the energy-output ratio. The rate of decline in the energy-output ratio for the manufacturing sector has slowed since the mid 1980s, however,
indicating the end of the period of rapid efficiency gains. Most of the readUy
replaceable energy efficient technologies were installed through the 1970s, especially in the energy-intensive industries (Sangyo Kenkyujo [Industry Research Centre]
There are two distinct meanings of 'energy efficiency', the engineering or
technological meaning and the economic meaning. The next section examines these
concepts and raises questions that have been debated in the economic Uteratnre about
the ultimate impact of poHcies and practices to promote greater energy efficiency.
Energ\ efficiency
Public campaigns to promote energy efficiency in Japan use catch phrases involving
energy saving {sho-enerugii) and energy conservation. Energy conservation in its
narrowest technical or engineering sense is the ability to reduce the energy invested in
a production process while yielding the same level of output. Or, in household terms,
it is the process of reducing the amount of energy used in meeting a given set of
requirements. Kudo (1994 p 46) describes household demand for energy as a derived
demand for 'energy services' which are used to meet actual demands and needs for
heating, cooling, lighdng and so on. A more electrically efficient appHance can thus
meet those needs while using less electricity.
Energy conservation can also mean reducing the set of output or service
requirements, or the scope of the production process. This is akin to conservation by
'going without'. In the household case, for example, this might mean conserving
electricity by raising thermostats in summer and lowering them in winter.
More broadly, energy conservation can be defined as reduction in the amount
of energy demanded per unit of GDP throughout the economy. An economy can
consen e energy by maximising the productivit>' of its energy resources, by putting
energy to work in high value-added sectors for example, to help maintain the real
value of output while reducing energy use.
The same definitions apply to the notion of energy efficiency, since reducing
energy consumption by conser\ing energy results in increased energy efficiency. It is
wonh noting that the two cases above, reduction of energy invested and 'going
without', are effectively end points of a broad range of process, structural and
technological change leading towards greater energy efficiency, and across the
economy both will be happening simultaneously (Sagawa 1990 p 47). In asking the
question 'how has energ>' efficiency in Japan improved?', both the end points referred
to above and the points in between (for example reducing energy consumption by
'going without' in the short term) need to be addressed.
Energy intensity is a measure of the energy embodied in the output from a particular process. The more energy efficient a given process becomes, the smaller the volume of energy embodied in the output and the lower the energy intensity of the process. Efficiency is a relative term, implying nothing about ranking of processes (or industries) by energy content or energy intensity. An energy-intensive industry may already be quite efficient in the way energy is used. Similarly, a non energy-intensive industry may be able to improve the efficiency with which it uses energy through minimising energy losses or improving technology. In terms of energy savings, however, a small improvement in the efficiency of an energy-intensive process will save more energy than a small improvement in the efficiency of a less energy-intensive process..
There is, of course, no absolute reason to pursue energy efficiency as a goal in its own right. It is the means to an end, the end being a reduction in expenditure on energy consumption for the same level of output (or comfort in the household case). There has been considerable debate in the energy economics literature about whether energy efficiency is a step towards this end or, in fact, a step away.
Khazzoom (1987,1989), Brookes (1990) and others argue that increasing the energy efficiency of an appHance or piece of equipment effectively reduces the price of energy as an input. They assert that economic logic suggests that in general more of an input is consumed when its relative price decreases, so that the net effect of increasing efficiency will be a shift around the production possibility frontier leading to more consumption of the cheaper input (energy, in this case). They cite evidence of a 'rebound effect' in which industries and private consumers re-allocate their energy consumption when one energy consuming process becomes more energy efficient, so maintaining or even increasing total energy consumption. The purchaser of a more fuel efficient car, for example, might be tempted to drive the car more often if it is cheaper to run than its predecessor. If the elasticity of demand for the service (driving) is high enough, then total fuel consumption may actually rise.
Other authors (Henly et al 1988; Lovins 1988; Grubb 1990 for example) question these inferences from a number of viewpoints. The critical point is the definition and size of the rebound effect since the extent of the rebound effect determines whether investment in equipment with higher energy efficiency will increase or decrease energy consumption. The rebound effect is determined by the
three factors: the price elasticit>' of energy demand; the elasticity of service demand
(defined as change in energy use divided by change in equipment efficiency); and the
elasticity of equipment price with respect to efficiency (Henly et al 1988 p 164).
Empirical estimation suggests that the rebound effect is small (Henly et al 1988 pp
166-167) and this is confirmed in the analysis of some particular Japanese industries
later in this chapter.
Low price elasticities of energy demand suggest that energy price is often not
the determining factor in energy usage, unless energy prices or availabihty constrain
energy demand. Physical saturation (particularly in appliances) suggests that where
energy demand is a derived demand for some other good or service (like home
heating or the use of a refrigerator) then it is the use of the good that is driving energy
demand and not the reverse. So that if a refngerator uses less energy in the task of
preserv ing food, this saving of energy will not be transferred to other uses. These
authors (Lovins 1988; Henly et al 1988) cite little empirical evidence for the existence
of a significant rebound effect redirecting energy demand elsewhere. More energy
efficient technologies t>'pically require greater capital outlays, so the reduction in
energy requirement can be seen as a return on the capital investment. While increased
energy efficiency effectively drops the price of energy as an input, the extent of this
advantage is moderated by the cost of installing the new technology.
QUANTIFYING ENERGY EFFICIENCY CHANGE IN JAPAN
The five disaggregated approaches to energy efficiency change in Japan used in this
study are outlined in more detail below. The approaches take apart the components of
energy efficiency change, building a dynamic understanding by determining how the
energy consuming sectors of the economy interact with each other and adjust over
time in response to extemal shocks.
Intra- and inter-sectoral changes
Economic structure is the key determinant of the total volume of energy consumption,
by primary fuels and secondary sources, and so sets the boundaries for the success of
energy efficiency and conservation policies. The industrial sector in Japan maintains a
high share of both energy consumption and output. With these large shares, the
impact of structural change and technological change factors in this sector leads to it
determining the bulk of change in total energy consumption. Developments in other
sectors are marginal, though cumulatively developments in smaller sectors are
significant in a bottom-up approach.
Japanese research on energy issues typically focuses on determining the
aggregate demand for different fuels and on the global supply and demand situation
for energy. These themes reflect the underlying concerns for security of supply of
primary energy. There has been little research done on the mechanisms behind the
adjustments that have taken place since 1973, on the impact on sectoral energy
consumption of the changing nature of energy efficiency within the Japanese
economy, or of Japan's changing pattern of foreign trade.
There has been some work pubhshed which decomposes year to year energy
consumption increases in the industrial sector into three components: a structural
change component picking up changes in the shares of output of industries; an output
level component that attributes a part of energy consumption growth to increasing
output levels; and a residual, energy conservation component (EDMC 1993a; ECCJ
1992).
These results relate to energy demand levels, however, and energy efficiency
has not been decomposed. Yet this is the more interesting measure for four main
reasons. Firstly, the rate of change of aggregate energy efficiency in Japan is more
unusual, in comparison with its global partners, than change in aggregate energy
consumption levels. Secondly, energy efficiency and energy intensity analysis allows
estimation of the impact of trade on domestic energy demand. Thirdly it provides
clearer delineation of the new sources of energy demand and energy intensity growth
in the Japanese economy. And finally it enables quantitative assessment of the
projected high rates of energy efficiency growth in the next 15 years by isolating the
key sources of change since 1973 and assessing the scope for further growth in these
and other sectors.
Chapter 4 reports on structural decomposition analysis of energy efficiency in
Japan. The methods developed here allow decomposition both within industries and
sectors, and within a given time period, leading to quantification of the most
significant sub-periods and the most significant sub-sectors in energy intensity change.
Direct-indirect energy consumption
Energy is consumed in two forms in the production of goods: direct energy and
indirect energy. Direct energy consumption takes place when a boiler is heated, or a
fumace used. Indirect energy is embodied in the non-energy inputs to a production
process, in the steel in automobile manufacture, for example. Where a product is used
as an input into the manufacture of many other goods (steel, for example) any gains in
energy efficiency in production of that product are transmitted through the economy
as gains in indirect energy efficiency in production of the final output. Cumulative
gains in indirect energy consumption, invisible in simple modelling of energy
consumption per unit output, may thus be of a similar scale to, or even greater than,
gains in du-ect energy consumption.
Derivation and quantification of direct and embodied (indirect) energy
consumption in production is best done in these circumstances using input-output
analysis and appropriate decompositions (Proops et al 1993). This technique allocates
the economy's energy consumption across all sectors, incorporating indirect energy
consumption in the allocation through the coefficients of production that can be
derived from input-output tables. The results of this analysis can then also be used to
estimate the energy embodied in imports, giving a measure of the equivalent energy
not consumed in Japan in production of these imported goods.
economic structure reflecting different factor endowments might be expected to narrow over time and become insignificant. In a potentially unstable world energy market, an poor economy is likely to produce less low value-added energy-intensive products and more high value-added low energy content products, unless technological or some other kind of comparative advantages exist to offset the reliance on traded raw energy. As the pattem of trade and investment evolves in this climate, the energy-poor economy is likely to import less primary energy and more semi-processed materials embodying energy consumed offshore. There may be some net energy savings from this trade.
Technological change in key industries
In an economy subject to an external energy price shock, adjustments to the change in relative prices take a number of forms. Initially there will be a strong first round of very low cost efforts at better energy 'housekeeping' by minimising obvious energy losses in existing production systems. This will be followed by installation of the most cost-effective energy-saving technologies, improvements in production processes and capture and re-use of energy previously wasted. Generally, more complex and
expensive technologies are installed later, with a fmal round of redesign of whole production processes. Industry level energy intensity is subsequently flat until the next round of process changes. Industry energy intensity in Japan is not smoothly declining but punctuated by innovation and installation and the Japanese steel industry provides a useful example of processes and sequences in improved energy efficiency. The changing mix of inputs and outputs typically brings a change in the amount of energy required in production, even without a major breakthrough in production technology.
Trends in change in energy efficiency within an industry can be misleading if the stage along the technology-diffusion cycle is not clear. To overcome this
Umitation, Chapter 6 reports on the detail of technological and structural change within key energy-intensive manufacturing industries.
Structural change and the new centres of energy demand
In the industrialised economies, as national incomes rise, final demand for energy also rises, with the sources of this demand shifting from the industrial sector towards service industries and households. This trend is clear in Japan, and has been
particularly prominent in the late 1980s and early 1990s (Ikuta 1991; Fujime 1990a;
Fujime 1988).
The shift in sources of energy demand from the manufacturing sector towards
the services sector and the private energy consumption sector (both residential and
transport) is pronounced. Households and service industries are becoming more
automated (office automation and home automation), creating a new and rapidly
growing demand for energy, and for electricity in particular (Kibune 1990). Electricity
demand is one of the fastest growing areas of energy demand and the technologies
and trends in the efficiency with which primary fuels are converted to electricity will
have a major impact on future net primary energy consumption.
The increasing energy intensity in the tertiary and household sectors is in
marked contrast to the net decreasing energy intensity in the heavy industry segment
of the manufacturing sector (Sagawa 1990). The rate of aggregate energy intensity
decline in the industry sectors has slowed, however, meaning that the increase in
energy intensity in these other sectors will be the major determinant of Japan's overall
energy efficiency in the next decade.
Energy policy context
The eighteen year period that this study focuses on provides a useful test of the
adaptability of energy policy in different environments. For the fu-st ten years crude oil
prices rose, at times sharply. The latter period has seen world crude oil prices fall and
non-price concerns, such as pressure to conform to global greenhouse gas emission
reduction targets, become significant in the policy context. The changes in energy
consumption and energy intensity that are analysed using the approaches above are all
set in the context of energy pohcy in Japan.
Japanese energy policies deserve particular attention given that Japan's
aggregate energy intensity declined more than any other OECD country between
1973 and 1991. The effectiveness of Japan's energy policies in supporting this
achievement is assessed in Chapter 8 of this study. The assessment is used to review
the prospects for the revised energy policies that emerged in the early 1990s in Japan.
These revised policies emerged in Japan in response to global concerns about the
impact of energy consumption on the environment, and coincided with the emergence
of a stronger role for Japan in regional and international fora.
Energy policy in Japan since the first oil shock in mid 1973 has had four main
aims: securing oil supplies; diversification away from oil as the primary fuel;
increased efficiency of energy use; and development and promotion of altemative
energy sources (Samuels 1987).
Japan's Ministry of International Trade and Industry (MITI) has been
instrumental in establishing a policy environment which conforms to the interests of
the private sector while supplementing and encouraging extension of market
responses to changing international oil market conditions (Samuels 1987; Lesbirel
1989; Hein 1990; Perkins 1989). Lesbirel, for example, states that 'MITI played a key
role in diversification policy by intervening in, and expanding its influence over,
energy markets and the energy-policy-making process' (Lesbirel 1989 p 290).
Over the 1973-1991 period MITI has promoted a range of measures to
address the four policy goals noted above.
• Funds have been allocated to assist Japanese corporations in exploring for and
developing new oil reserves, and a 90 day stockpile has been secured (Shigen
Enerugii Cho 1993a).
• The Law on the Rational Use of Energy was passed in October 1979. Its three
focal points are large factories, the building industry and standards for appliances.
The Alternative Energy Law was also put in place at this time to promote
diversification away from the heavy dependence on oil as a primary fuel.
• The Moonlight Project was launched in 1978 by the Science and Technology
Agency, to further research and development of energy conservation technology
(Agency of Natural Resources and Energy 1991). Under the broad banner of this
project, funded mostly from MITI's energy budget, a number of energy
conservation technology development projects receive funding, such as research
into more efficient conversion of fuels, electricity storage, heat pumps and super
conductors.
• The Sunshine Project, launched by MITI in 1974, aims to develop new energy
technologies, those using fuels other than oil. It now provides funding for projects
focused on solar voltaics, coal liquefaction and gasification, geothermal and
hydrogen energy sources. The New Energy Development Organisation (NEDO)
manages the research being carried out under this project. There is a separate
program and budget for expansion of the nuclear power network.
This study analyses the effectiveness of energy pohcy measures under
[image:30.609.63.563.231.790.2]scenarios of both increasing and decreasing world oil prices. These two scenarios are
useful in attempting to separate the impacts on energy demand and aggregate energy
efficiency of exogenous price movements and policy measures.
Figure 1.4 Wholesale price indices of crude oil, gasoline and electricity
(1985=100)
real crude price index
real gasoline price index
real electricity price index
Source: Indices derived from Enerugii Keiryo Bunseki Senta [Energy Data and
Modelling Centre] Enerugii Keizai Tokei Yoran '93 [Energy
Economics Statistical Handbook 1993] and Enerugii Keizai Tokei
Yoran ' 94 pp 42, 44.
One of the primary goals of post-1973 energy policy in Japan was
diversification away from crude oil as the dominant primary fuel source. The
instruments used to pursue this goal restricted the amount of the fall in crude oil
prices in the late 1980s that was passed on to energy consumers (Lesbirel 1989).
Figure 1.4 shows real yen oil prices, real wholesale gasoline prices and real wholesale
electricity prices in Japan, indexed to 1985 = 100. Clearly the domestic gasoline and
electricity prices, which might under fully competitive and flexible circumstances
correlate closely with crude oil prices, are quite sticky and resistant to change.
Despite this stickiness, wholesale energy prices in Japan had returned to early 1980s levels by the early 1990s.
MITI's instruments have generally been used to promote stability in the Japanese oil market, and the basis of and rationale for these market-conforming strategies are well described in Samuels (1987). One of the aims of this study is to assess the relationship between energy policies and broader industrial pohcies and to assess the extent to which policies underpinned the decline in aggregate energy intensit}' between 1973 and 1991. These assessments are used to evaluate the likely outcomes of Japan's current energy policy goal of limiting total emissions of CO2 per capita to 1990 levels by 2000.
The stimulus to more efficient use of energy provided by the crude oil price rises in the 1970s, especially as an input into manufacturing processes, was common to all the industriahsed countries. The following sections in this chapter summarise energy consumption and energy efficiency changes in a number of countries and highhght the extent of change in Japan relative to its competitors. Japan is the only economy for which energy demand growth and GDP growth diverged strongly in the years following the first oil shock. The characteristics of Japan's response to these shocks is the subject of the following chapters.
ENERGY EFFICIENCY IN A GLOBAL CONTEXT
Japan has one of the largest economies in the world, as well as one of the world's highest levels of per capita income. A medium-sized population, poorly endowed with natural energy resources, its net per capita primary energy supply is low by world standards (Figure 1.5). The energy data in Figure 1.5 is total primary energy supply (TPES) which is the preferred measure of aggregate energy demand as it includes energy directed, before conversion, to the electricity generation sector.
There is a close superficial correlation in Figure 1.5 between energy natural resource endowments and per capita energy intensity. The countries with the greatest reserves of fossil fuels — Australia, Canada and the United States — also have high per capita energy consumption levels while the resource poor Japan and Italy use much less energy per person.
Figure 1.5 Total primary energy supply per capita, 1991
(10,000 kcal/person)
8 T7
6
5
4
3
2
1 0-liiP
a:!:;:;-:-ms^
m
03
Cre Q .
03
-3
3
CD o c
03
>> c03
E 03
O
Q O
LUO
.re CO <CO
3
rec
re
O
Source: Derived from Energy Balances of OECD Countries, International
Energy Agency (lEA), 1992 country-by-country tables.
Where a country has a comparative advantage in energy-intensive industry by
virtue of abundant local energy supplies it follows that it would tend to specialise in
these activities, resulting in a high level of energy consumption per capita. The United
Kingdom is an anomaly, in that it is virtually self-sufficient and yet has a relatively low
per capita energy intensity.
Energy consumption profiles
Looking at the G7 group of industrialised nations as a subset of the OECD economies gives a good indication of where Japan fits in the global context
(Table 1.1).
Considering energy consumption profiles by main economic sector shows marked differences across countries in the relative sizes of these sectors in the energy budget. In 1989 the industrial sector accounted for 46 per cent of Japan's GDP and just 35 per cent in the United States and France. These high shares of output are
mirrored in the high shares of energy consumption.
Despite considerable growth in energy consumed by the non-industrial sectors, Japan still has a strong industrial bias in energy consumption. This gap has closed somewhat with the industrial sector accounting for 67 per cent of final energy
consumption in 1971, but 46 per cent in 1989. Table 1.1 also shows the relatively low proportion, still, of residential energy consumption in Japan, which is only 26 per cent of the total while in most of the other countries in this group it is well over
30 per cent. Household energy consumption in France exceeds industrial energy consumption.
There is a general correlation betw-een the industry share of GDP and reduction in energy intensity for the countries that are not major energy exporters. Japan, the United Kingdom and Germany all have large industry shares of GDP and all showed significant aggregate energy intensity declines after the first oil shock. With the industrial sector t>T)ically accounting for a large share of energy
consumption, it seems that the large industry share of GDP gives more scope for large scale industry-based energy efficiency gains. Large scale industry-based energy
efficiency gains would serve to pull down aggregate energy intensity.
Looking at the share of imported fuels emphasises the resource poor economies of Japan and Italy. The ver}' high dependence on imported energy raw materials in both countries stands out. with Japan importing 86 per cent of all energy (99 per cent of crude oil), and Italy importing 86 per cent of all energy (95 per cent of crude oil) in 1991. Of the G7 countries it is the changes in the energy profile in Italy that most closely resemble those of Japan. Japan's high dependence on imported crude oil also brings a high dependence on oil from the Middle East, accounting for over 65 per cent of Japan's crude imports in 1991.
Table 1.1 Energy consumption in G7 countries and Australia, 1989
(%, mtoe^)
Japan US Germany Canada France UK Italy Australia
Solid fuels (%) 18.0 27.3 27.9
16.8
11.4 30.3 27.9 45.9
Oil (%)
57.8 40.8 40.1
36.4
41.1 38.4 40.1 37.6
Natural gas (%) 10.1 22.8 17.3
25.9
10.9 21.8 17.3 15.3
Nuclear (%)
11.8
7.5 14.3
9.6
36.1
9.0 14.3
0
Hydro (%)
1.9
1.2
0.4
11.4
1.8
0
0.4
1.2
Electricity
21
16
17
22
18
16 15
18
share (%)
Industry
46
31
35
37
31
36 35
37
share (%)
Transport
24
35
26
26
29
29 26
39
share (%)
Household &
26
31
36
34
36
32 35
19
commercial
share (%)
Total primary
407
1955
360
220
218
210
153
85
energy supply
(mtoe)
Share of
86.5
17.3
44.7
-25.6
53.7
3.3
86.2 -68.4
imported
energy supply
^ million tonnes of oil equivalent
Source:
Energy Balances ofOECD Countries, lEA, 1992 country-by-country
tables; and Enerugii Keizai Tokei Yoran '93 [Energy Economics
Statistical Handbook 1993], EDMC 1993a pp 188-195.
Across these economies there is similarity in the proportions of primary and
secondary consumption (the former mainly crude oil, coal and natural gas and the
latter electricity and town gas). Japan has one of the highest rates of electrification
amongst the G7 countries, with electricity supplying almost 21 per cent of energy
consumed in 1989; Canada has a similarly high rate at just over 22 per cent. Growth
rates of electricity consumption have been similar across this group of countries, with
the United Kingdom showing the least change since 1971.
Following the rapid price rises and supply disruptions in 1973, dependence on
oil as a primary energy source declined in the 07 countries through the 1970s, with
natural gas and nuclear energy taking larger shares of energy supply profiles. The
extent of this switch varies across countries, with Australia and Canada exhibiting a
small shift to these sources, and Japan, the United States and Italy showing change on
a much greater scale. In the United States, for example, dependence on oil declined
from 66 per cent to 41 per cent between 1970 and 1989. In Japan it declined from
77 per cent in 1973 to a low of 56 per cent in 1985 before climbing again to over
58 per cent in 1992 (EDMC 1994 p 18). Nuclear energy has boomed in France where
it has risen from providing 1 per cent of energy requirements in 1970 to 36 per cent in
1989. In Japan it has risen from 1 per cent to 12 per cent, and in Germany from
1 per cent to 14 per cent.
The differences in these broad economic structures are reflected in the
aggregate energy coefficients for these country.
Energy coefficients
The overall supply of energy to an economy can be divided by the economy's total
output (GDP) to yield a highly aggregated measure of the overall intensity of energy
use, often called 'the energy coefficient'. This can be expressed as either a simple ratio
or the elasticity of growth rates. The trend of such statistics over time suggests a
parallel between energy consumption and economic development, of increasing then
decreasing aggregate energy intensity ratios and elasticities (Figure 1.1). Some theory
developed from these observations is discussed in the following chapter.
In the 1970s and 1980s, for most of the OECD countries energy elasticities
were less than 1, signalling that the rate of energy demand growth fell below the rate
of economic growth. Energy intensities in many of these economies therefore declined
through this period.
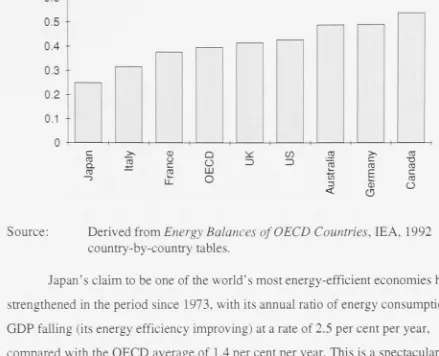
Energy intensity profiles
As can be seen in Figure 1.6 below, in gross terms Japan and Italy are among the most
energy efficient economies. The ranking by energy intensity closely resembles the
reverse of the ranking by share of imports of raw energy in Table 1.1. Only the United
Kingdom and Germany are out of rank order in intensity — almost self-sufficient in
energy, the United Kingdom might be expected to rank alongside the other energy
exporters Australia and Canada. Germany has an unexpectedly high energy intensity
for an economy importing close to half its energy needs. While there is a general
correlation, there are clearly factors other than share of imports of energy at work in
determining aggregate energy intensities.
Figure 1.6
0.6 T
0.5
0.4
0.3
0.2
0 . 1
-0
Energy intensities in G7 countries, Australia and OECD average, 1991
{mtoe/1985US$billion)
c 0) Q CO >> 03
03
Q. re o c
o
3 ZD C 03 -o 03 03 03m
D
E
OJ C - 3 U-^O
DE
OJo
03<
O
o
03Source:
Derived from Energy Balances of OECD Coun tries, lEA, 1992
countr}'-by-country tables.
Japan's claim to be one of the world's most energy-efficient economies has
strengthened in the period since 1973, with its annual ratio of energy consumption to
GDP falling (its energy efficiency improving) at a rate of 2.5 per cent per year,
compared with the OECD average of 1.4 per cent per year. This is a spectacular
improvement in the efficiency of energy use in Japan, at least as far as converting
energy into GDP is concerned. The other G7 countries also reduced their levels of
energy consumption per unit of GDP, but not to the same extent or while maintaining
high overall economic growth as Japan did (Figure 1.7).
Japan has had the lowest aggregate energy intensity of this group of countries
since before the 1973 oil crisis. Not only is Japan's level of aggregate energy intensity
low, it has had the fastest rate of reduction of aggregate energy intensity in the years
following 1973. CK'erall, total primar>^ energy supply (TPES^) per unit of real GDP in
Japan is now^ some 34 per cent less than it was in 1974.
Figure 1.7 Energy intensities in G7 countries and Australia
(nitoe/1985US$billion)
0.7 J
0 . 6
0.5
--0.4
0.3
0 . 2
0 . 1
-0
c
03
Q.
ro


![Table 3.1 Sogo Enerugii Tokei [General Energy Statistics] summary energy balance table for 1991](https://thumb-us.123doks.com/thumbv2/123dok_us/8042335.221519/89.850.49.808.75.540/table-enerugii-tokei-general-energy-statistics-summary-balance.webp)
