0022-538X/06/$08.00⫹0 doi:10.1128/JVI.80.6.2987–2999.2006
Copyright © 2006, American Society for Microbiology. All Rights Reserved.
RNase L Plays a Role in the Antiviral Response to West Nile Virus
Svetlana V. Scherbik,
1Jayashree M. Paranjape,
2Bronislava M. Stockman,
1Robert H. Silverman,
2and Margo A. Brinton
1*
Department of Biology, Georgia State University, Atlanta, Georgia 30302,1and Department of Cancer Biology/NB40,
The Lerner Research Institute, The Cleveland Clinic Foundation, Cleveland, Ohio 441952
Received 18 August 2005/Accepted 21 December 2005
Alleles at theFlvlocus determine disease outcome after a flavivirus infection in mice. Although comparable numbers of congenic resistant and susceptible mouse embryo fibroblasts (MEFs) are infected by the flavivirus West Nile virus (WNV), resistant MEFs produce ⬃100- to 150-fold lower titers than susceptible ones and flavivirus titers in the brains of resistant and susceptible animals can differ by >10,000-fold. TheFlvlocus was previously identified as the 2ⴕ-5ⴕ oligoadenylate synthetase 1b (Oas1b) gene. Oas gene expression is up-regulated by interferon (IFN), and after activation by double-stranded RNA, some mouse synthetases produce 2-5A, which activates latent RNase L to degrade viral and cellular RNAs. To determine whether the lower levels of intracellular flavivirus genomic RNA from resistant mice detected in cells at all times after infection were mediated by RNase L, RNase L activity levels in congenic resistant and susceptible cells were compared. Similar moderate levels of RNase L activation by transfected 2-5A were observed in both types of uninfected cells. After WNV infection, the mRNAs of IFN-and threeOasgenes were up-regulated to similar levels in both types of cells. However, significant levels of RNase L activity were not detected until 72 h after WNV infection and the patterns of viral RNA cleavage products generated were similar in both types of cells. When RNase L activity was down-regulated in resistant cells via stable expression of a dominant negative RNase L mutant,
⬃5- to 10-times-higher yields of WNV were produced. Similarly, about⬃5- to 10-times-higher virus yields were produced by susceptible C57BL/6 RNase Lⴚ/ⴚ cells compared to RNase Lⴙ/ⴙ cells that were either left untreated or pretreated with IFN and/or poly(I) · poly(C). The data indicate that WNV genomic RNA is susceptible to RNase L cleavage and that RNase L plays a role in the cellular antiviral response to flaviviruses. The results suggest that RNase L activation is not a major component of the Oas1b-mediated flavivirus resistance phenotype.
Variation in susceptibility to flavivirus-induced disease among mice was first observed in the 1920s and subsequently shown to be controlled by a single locus (56, 72). This virus-specific
resistance is dominant. Studies with the C3H.PRI-Flvr and
C3H/HeJ congenic pair of mouse strains (26) showed that although resistant mice support the replication of flaviviruses, virus titers in their tissues are significantly lower and the spread of infection is slower compared to that in susceptible mice (4, 24, 32, 65). Cell cultures prepared from various tissues ob-tained from resistant mice also produce lower yields of flavi-viruses than do comparable cell cultures from susceptible mice (13; reviewed in reference 8). Coinheritance of theFlvalleles
with those of theRic locus on chromosome 5 identified the
chromosomal location of theFlvlocus (36). TheFlvlocus was
then mapped on mouse chromosome 5 by linkage analysis first with known flanking genes (61) and then with microsatellite markers (67). TheOas1bgene was identified as theFlvlocus by a positional cloning strategy (51). Mashimo et al. (45) con-firmed the identification of this gene. The transcript of the
Oas1b allele in susceptible mice contains a premature stop codon and encodes a truncated protein. The mechanism(s)
through which the products of the differentOas1balleles
con-fer difcon-ferential susceptibility to flavivirus-induced disease in mice and affect the level of viral RNA produced in infected
cells is not known. These proteins may act via direct and/or indirect mechanisms.
The Oas1b gene is a member of the oligoadenylate
syn-thetase family, which in humans consists of theOAS1(a single
unit),OAS2(two tandem units),OAS3(three tandem units),
andOAS-like(a single unit plus two C-terminal ubiquitin-like domains) genes (11, 33, 35). These genes encode a total of eight or more isoforms via alternative splicing. The mouse
genome contains eightOas1genes and twoOas-likegenes, in
addition to single copies of theOas2and Oas3genes. After
activation by double-stranded RNA (dsRNA), enzymatically
active human OAS proteins polymerize ATP into 2⬘-5⬘-linked
oligoadenylates ranging in size from dimers to 30-mers, but the predominant species is the trimer (38, 53, 58). The domains required for human OAS synthase activity were previously mapped (21, 22). To date, the only well-established biochem-ical function for 2-5A is the activation of a ubiquitous 2-5A-dependent, single-strand-specific, cytoplasmic endoribonuclease, RNase L (77). RNase L is always present in mammalian cells at low levels in an inactive form (63). When activated by 2-5A, RNase L degrades both viral and cellular single-stranded RNAs preferentially at UA and UU dinucleotides (18, 75). Overexpres-sion of RNase L has been shown to inhibit the replication of a number of RNA viruses (79).
It has also been reported that activation of the 2-5A syn-thetase/RNase L pathway by interferon (IFN) inhibits a variety of viruses (5, 73). Clear correlations between the activation of the Oas/RNase L pathway and inhibition of picornavirus
rep-* Corresponding author. Mailing address: Department of Biology, Georgia State University, P.O. Box 4010, Atlanta, GA 30302-4010. Phone: (404) 651-3113. Fax: (404) 651-2509. E-mail: mbrinton@gsu .edu.
2987
on November 8, 2019 by guest
http://jvi.asm.org/
lication have been shown. For example, overexpression of the 40-kDa form of the human OAS1 protein in hamster cells rendered them resistant to Mengo virus infection but not to infections with vesicular stomatitis virus (VSV) (12). Constitu-tive expression of the 69-kDa form of the OAS2 protein in human cells inhibited the replication of encephalomyocarditis virus (EMCV) but not that of VSV, Sendai virus, or reovirus (23). Overexpression of a dominant negative mutant form of RNase L decreased the antiviral activity induced by IFN against EMCV (34).
Since more efficient degradation of flavivirus RNA by RNase L in resistant cells could explain the reduced yield of flaviviruses produced by these cells, RNase L activity was com-pared in resistant and susceptible cells. The results showed that RNase L was activated in West Nile virus (WNV)-infected cells and did play a role in the cellular antiviral response. However, RNase L activity was higher in susceptible and not resistant cells and down-regulation of RNase L activity in re-sistant cells did not restore WNV production to the level ob-served in susceptible cells.
MATERIALS AND METHODS
Cells. Resistant C3H.PRI-Flvr
(RV) and congenic C3H/HeJ (He) primary MEFs were prepared from 14- to 18-day-old mouse embryos and frozen after the first passage. Only cells from passages 3 to 5 were used for experiments. The establishment of continuous MEF lines by simian virus 40 transformation of low-passage primary RV and He MEFs was previously reported (13).
Immor-talized (postcrisis) RNase L⫺/⫺and RNase L⫹/⫹MEF cell lines derived from
transgenic and normal C57BL/6 mice, respectively, were produced as described previously (78). MEFs were grown in minimum essential medium (MEM) sup-plemented with 10% heat-inactivated fetal bovine serum and 1% gentamicin (or
100-g/ml penicillin-streptomycin for the C57BL/6 MEFs). Baby hamster kidney
21/WI2 cells (hereafter referred to as BHK cells) (69) were maintained in MEM
supplemented with 5% heat-inactivated fetal calf serum (FCS) and 10-g/ml
gentamicin. All cells were grown at 37°C in a 4.5% CO2atmosphere.
Virus.A stock of WNV strain Eg101 was prepared by infecting BHK cells at a multiplicity of infection (MOI) of 0.1 and harvesting culture fluid 32 h after
infection. Clarified culture fluid (4⫻107PFU/ml) was aliquoted and stored at
⫺80°C. Plaque assays were done on confluent monolayers of BHK cells in
six-well plates. After adsorption for 1 h at room temperature, the virus inoculum was removed and the wells were overlaid with 1% SeaKem ME agarose
(Bio-Whittaker Molecular Applications, Rockland, Maine), mixed 1:1 with 2⫻MEM
containing 5% FCS, and incubated at 37°C for 72 h. After removal of the agarose, the cells were stained with 0.05% crystal violet in ethanol. To assay viral
growth kinetics, confluent cultures in 25-cm2
flasks were infected at the desired MOI. Cells from a replicate flask were counted prior to infection to accurately calculate the amount of virus needed. Virus was adsorbed for 1 h at room temperature, and the monolayers were rinsed four times to remove unbound virus before replacing 5 ml of MEM containing 5% FCS. Samples (0.5 ml) of
culture fluid were removed at various times after infection and stored at⫺80°C.
Fresh medium (0.5 ml) was replaced at each time point. Virus titers were determined by plaque assay on BHK cells. Viral growth curves and plaque titrations were done in duplicate, and the virus titers shown are average values.
Establishment of stable RNase L mutant cell lines.The pcDNA-ZB1 plasmid, which contains a truncated form of murine RNase L that functions as a dominant negative mutant, was kindly provided by Aimin Zhou (Cleveland Clinic, Cleve-land, OH) (34). MEFs were transfected with empty vector pcDNAI/Neo DNA (Invitrogen, Carlsbad, CA) or pcDNA-ZB1 DNA by using Lipofectamine 2000
(Invitrogen). Stable transfectants were selected with 300-g/ml G418
(Invitro-gen). Clones were isolated with cloning rings and then expanded. The clones were first screened for RNA transcripts produced from the vector DNA by reverse transcription (RT)-PCR with transcript-specific primers (T7
vector-spe-cific forward primer 5⬘-TAATACGACTCACTATAGG-3⬘and RNase L-specific
reverse primer, 5⬘-GGTGGCCCCATTCTTCTTCCT-3⬘). Both endogenous and
truncated RNase L protein levels in the different clones were then estimated by measuring 2-5A binding activity.
2-5A binding assay. A 32
P-labeled, bromine-substituted 2-5A analogue,
p(A2⬘p)2(br8A2⬘p)2A3⬘[32P]pCp (probe), was cross-linked to the RNase L
present in crude cell extracts (200g) under UV light as described previously
(49). Briefly, cell extracts containing equal amounts of total protein were
incu-bated with the probe (105cpm; specific activity, 3,000 Ci/mmol) in 50l of buffer
(the final concentrations in the assay were 25 mM Tris HCl [pH 7.4], 100 mM
KCl, 50M ATP, 14 mM 2-mercaptoethanol, and 100-g/ml leupeptin) on ice
for 60 min and then exposed to 308-nm light on ice for an additional 60 min. Protein-probe complexes were separated by electrophoresis on 10% sodium dodecyl sulfate (SDS)-polyacrylamide gels, and bound probe was detected by autoradiography of the dried gels.
Analysis of cellular mRNAs by RT-PCR.Total RNA was extracted from primary RV and He MEFs (mock infected or infected with WNV) with Tri-Reagent (Molecular Research Center, Cincinnati, Ohio) and then passed through an RNeasy spin column (QIAGEN, Valencia, Calif.). Total cellular RNA (500 ng) was subjected to RT-PCR with SuperScript III One-Step RT-PCR
by using PlatinumTaq(Invitrogen). A single RT cycle (48°C for 30 min and 94°C
for 5 min) was followed by 21 PCR cycles of 94°C for 30 s, 55°C for 30 s, and 72°C
for 2 min. The oligonucleotide primers used to detect IFN-(Ifnb1) mRNA
(GenBank accession number NM_010510) were sense primer 5⬘-CATGAACAA
CAGGTGGATCCTCCACGC-3⬘and antisense primer 5⬘-CAGTTTTGGAAG
TTTCTGGTAAGTCTTCG-3⬘. Mouse glyceraldehyde-3-phosphate
dehydroge-nase (GAPDH; GenBank accession number NM_001001303) mRNA was
de-tected with sense primer 5⬘-GCTCATGACCACAGTCCATGCCATCAC-3⬘
and antisense primer 5⬘-TACAGCAACAGGGTGGTGGAC-3⬘.
Quantitative real-time RT-PCR (Q-RT-PCR).Real-time RT-PCR was per-formed to quantify WNV genomic RNA. A primer-probe set targeting the NS1 region of WNV (62) was designed from the published sequence of the Eg101 strain (GenBank accession number AF260968). The primer sequences were as
follows: forward primer 3111V, 5⬘-GGCGGTCCTGGGTGAAGTCAA-3⬘;
TaqMan probe 3136V, 5⬘
-6FAM-TGCACTTGGCCTGAAACGCACACTTTGT-TAMRA-3⬘; reverse primer 3239C, 5⬘-CTCCGATTGTGGTTGCTTCGT-3⬘.
The reaction mixture contained 500 ng of cellular RNA, the primer pair (1M),
and the probe (0.2M) in a total volume of 50l. Intracellular genomic WNV
RNA was quantified by using a standard curve generated with serial dilutions of a known concentration of WNV genomic RNA in vitro transcribed with an AmpliScribe SP6 High Yield Transcription kit (Epicenter, Madison, Wis.) from a pRepWNVE101 (S. V. Scherbik and M. A. Brinton, unpublished data) cDNA template. After in vitro transcription, the DNA template was digested with DNase I at 37°C for 30 min. The RNA was phenol-chloroform extracted, ethanol precipitated, washed with 70% ethanol, resuspended in RNase-free water, and quantified by UV spectrophotometry, and the number of RNA molecules in the sample was calculated.
Oas1a,Oas1b,Oas-like2, and IFN-mRNAs were detected with specific As-says-on-Demand 20 X assay primer mixes and TaqMan MGB probes (FAM dye labeled; Applied Biosystems, Foster City, Calif.). The RNAs were quantified with an Applied Biosystems 7500 sequence detection system. As an endogenous control, the mRNA of a housekeeping gene, GAPDH, was detected in each sample tested with primers and probe from the TaqMan Rodent GAPDH Con-trol Reagents kit (Applied Biosystems). One-step RT-PCR was performed for each target gene and for the endogenous control in a singleplex format with 200 ng of RNA and the TaqMan one-step RT-PCR master mix reagent kit (Applied Biosystems). The cycling parameters were RT at 48°C for 30 min, AmpliTaq activation at 95°C for 10 min, denaturation at 95°C for 15 s, and
annealing-extension at 60°C for 1 min (repeated 40 times). Triplicate Ctvalues were
analyzed with Microsoft Excel by the comparative Ct (⌬⌬Ct) method (Applied
Biosystems). The amount of target (2⫺⌬⌬CT
) was determined by normalization to the endogenous control (GAPDH) and relative to a calibrator (uninfected He sample).
Northern blot hybridization.Total cellular RNA (5g/lane) was electropho-resed on a 1% agarose gel containing morpholinepropanesulfonic acid (MOPS)-formaldehyde buffer (NorthernMax denaturing gel buffer; Ambion, Austin, Tex.)
and 0.1-g/ml ethidium bromide under a constant voltage of 100 V and then
transferred overnight in 20⫻SSC (1⫻SSC is 0.15 M NaCl plus 0.015 M sodium
citrate) by capillary diffusion to a Hybond-XL membrane (Amersham Bio-sciences, Piscataway, N.J.). Alternatively, RNA was separated by 5% urea-poly-acrylamide gel electrophoresis (PAGE) and transferred to a Hybond-XL
mem-brane in 0.5⫻ Tris-borate-EDTA in a Trans-Blot transfer cell (Bio-Rad,
Hercules, Calif.). RNA was fixed to membrane by UV cross-linking. Prehybrid-ization and hybridPrehybrid-ization were performed in Rapid-hyb buffer (Amersham Bio-sciences) according to the manufacturer’s protocol. The probe, which
corre-sponded to the 3⬘-terminal 800 nucleotides of the WNV genome, was obtained
by PCR amplification of a pRepWNVE101 cDNA template with primers
5⬘-AGGACATCTGGTGTGGC-3⬘and 5⬘-AGTATCCTGTGTTCTCG-3⬘. The
PCR fragment was gel purified and labeled with [␣-32P]dCTP by using the
on November 8, 2019 by guest
http://jvi.asm.org/
Rediprime II Random Prime Labeling System (Amersham Biosciences). Unin-corporated label was removed with a Quick Spin DNA column (Roche, India-napolis, Ind.). After hybridization with probe overnight at 65°C, the membrane was washed and the bands were detected by autoradiography.
Western blotting.For Western blot analysis, monolayer cells were scraped into
RIPA buffer (1⫻phosphate-buffered saline, 1% Nonidet P-40, 0.5% sodium
deoxy-cholate, 0.1% SDS) containing Complete, Mini, EDTA-free protease inhibitor cock-tail (Roche, Indianapolis, Ind.) and Phosphatase Cockcock-tail Inhibitor II (Sigma-Al-drich, St. Louis, Mo.). Following separation by 7.5% SDS-PAGE, the proteins were electrophoretically transferred to a nitrocellulose membrane. The membrane was
blocked with 1⫻TBS containing 5% bovine serum albumin and 0.1% Tween 20 (1
h at 22°C) and incubated with a polyclonal primary antibody specific for Stat1 (Cell Signaling, Beverly, Mass.), phospho-Stat1 (Tyr701; Cell Signaling), or actin (C-11; Santa Cruz Biotechnology, Santa Cruz, Calif.) overnight at 4°C in the presence of
blocking buffer. The blots were then washed with 1⫻TBS and incubated with the
secondary antibody (horseradish peroxidase-conjugated anti-rabbit; Santa Cruz) for 1 h at 22°C. The washed blots were processed for enhanced chemiluminescence assay with the Super-Signal West Pico detection kit (Pierce, Rockford, Il.) according to the manufacturer’s instructions.
Assay of intracellular RNase L activity.RV and He MEFs were transfected
with the designated concentrations of 2-5A [p3(A2⬘p)nA, wheren⫽1 to⬎3] for
4 to 5 h with Lipofectamine 2000 (Invitrogen). The 2-5A was prepared enzymat-ically with ATP and recombinant 2-5A synthetase and was generously provided by Rune Hartmann (University of Aarhus, Aarhus, Denmark) and separated into individual oligoadenylate species by fast protein liquid chromatography with a mono-Q column (Amersham Biosciences). Total RNA was extracted from trans-fected cells with TriReagent (Molecular Research Center) according to the manufacturer’s protocol and quantified by measuring absorbance at 260 nm. The cell RNA (250 ng) was separated on RNA chips (RNA 6000 Nano Assay Kit; Agilent Technologies, Palo Alto, Calif.) and analyzed with an Agilent Bioanalyzer 2100 (Agilent Technologies). The peak areas representing 28S and 18S rRNAs and the cleavage products of these RNAs were determined with the Bio Sizing (version A.02.12 SI292) program (Agilent Biotechnologies).
Assay of RNase L activation in cell extracts.The protocol used to prepare S10 cell extracts from congenic resistant RV and susceptible He MEFs and the reaction conditions used to assay RNase L activation were similar to those described previously by Han and Barton (30). A 4.6-kb WNV RNA representing
the 3⬘portion of the WNV genome (nucleotides 6264 to 11029 of the WNV
Eg101 sequence) was transcribed in vitro from a cDNA clone (Scherbik and
Brinton, unpublished),32
P-labeled, and incubated with the S10 extracts at 34°C for 2 h. Poly(I) · poly(C) (Sigma-Aldrich, St. Louis, Mo.) was used as a positive control to activate 2-5A synthetases. The RNA from these reactions was then fractionated by electrophoresis on a 1% agarose gel containing
MOPS-formal-dehyde buffer (NorthernMax denaturing gel buffer; Ambion) and 0.1g/ml
ethidium bromide and visualized with UV light. Radiolabeled RNAs in dried gels were detected by phosphorimaging.
Transcription of hepatitis C virus (HCV) and WNV RNAs.The plasmid Con1/SG-Neo(I), which contains a subgenomic HCV replicon (genotype 1b), was kindly provided by Keril Blight (Washington University, St. Louis, Mo.). Con1/SG-Neo(I) DNA was linearized with ScaI. pRepWNVE101 DNA, which contains a WNV strain Eg101 replicon that has most of the structural protein region deleted (Scherbik and Brinton, unpublished), was linearized with AflII. The linearized cDNA templates were transcribed in vitro with AmpliScribe T7 or SP6 RNA polymerase (for the HCV and WNV cDNAs, respectively) and ribo-nucleoside triphosphates according to the protocols of the manufacturer
(Epi-center). To produce radiolabeled RNA, 20Ci of [␣-32P]GTP (3,000 Ci/mmol;
Perkin-Elmer, Boston, Mass.) was included in the transcription reaction mix-tures. Transcribed RNAs were ethanol precipitated, washed with 70% ethanol, solubilized in RNase-free water, and quantified by measuring UV absorption at 260 nm.
In vitro RNA cleavage assay.Recombinant human RNase L prepared from insect cells infected with a baculovirus vector containing an RNase L cDNA was purified by fast protein liquid chromatography (16) and activated with
unsepa-rated 2-5A prepared as described above. RNA cleavage reaction mixtures (30l)
contained 50 nM HCV or WNV RNA, 10 nM RNase L, 25 nM 2-5A, 25 mM
Tris-HCl (pH 7.4), 100 mM KCl, 10 mM MgCl2, 50M ATP, and 7 mM
2-mercaptoethanol and were incubated at 30°C for various times. RNA from these reaction mixtures was precipitated with ethanol, separated by electrophoresis on 1%
agarose gels containing MOPS-formaldehyde buffer and 0.1-g/ml ethidium
bro-mide, and visualized by UV light or detected by phosphorimaging. The relative amounts of radioactivity in the genomic RNA bands in each lane were quantified with MacBAS software on an image analyzer (ImageGauge, version 3.122; Fuji Photo Film Co., Ltd., Tokyo, Japan).
RESULTS
Comparison of viral RNA levels in congenic susceptible He and resistant RV MEFs at various times after WNV infection. Resistant MEFs produce lower yields of flaviviruses than con-genic susceptible cells (see Fig. 3A) (13; reviewed in reference 8). Q-RT-PCR was used to quantify intracellular viral RNA levels in RV and He MEF cell lines at 24, 48, and 72 h after infection with WNV at an MOI of 1 as described in Materials and Methods (Fig. 1). GAPDH expression was used as an endogenous control to normalize the samples. Intracellular viral RNAs were quantified by reference to serial dilutions of a known concentration of in vitro-transcribed WNV RNA. At each time tested, the levels of WNV RNA were significantly higher in the He cells compared to the RV cells. Similar results were obtained after infection with an MOI of 10 and in WNV-infected primary MEFs (data not shown). These results con-firmed previous reports that assessed viral RNA levels by Northern blotting and [3H]uridine incorporation (8, 68).
Activation of IFN and OAS gene expression after WNV infection of congenic susceptible He and resistant RV MEFs. Infection of cells by viruses can induce the production of IFN. The interaction of secreted IFN type 1 with cell surface recep-tors activates signaling pathways that in turn up-regulate the expression of a large number of IFN-stimulated genes (ISGs),
including the Oas genes (reviewed in reference 66). Since
IFN-is one of the first type 1 IFNs induced after virus
infec-tion (66), the levels of IFN- mRNA were compared in RV
and He MEFs at various times after WNV infection. In a
preliminary experiment, IFN- mRNA levels in total RNA
extracted from primary He and RV MEFs at 8 and 12 h after infection with WNV at an MOI of 10 were estimated by RT-PCR. Compared to uninfected cells, no increase in the expres-sion of this mRNA was observed by 8 h after WNV infection, but by 12 h increased expression was detected in both types of
cells (Fig. 2A). IFN- mRNA levels in infected cells were
[image:3.585.337.504.69.226.2]subsequently measured by Q-RT-PCR at 12, 24, 48, and 72 h
FIG. 1. Quantification of intracellular viral RNA in RV and He MEFs. Congenic flavivirus-resistant (RV) and susceptible (He) mouse MEFs were infected with WNV (strain Eg101) at an MOI of 1, and total cell RNA was extracted at the indicated times after infection. Plus-sense viral RNA was quantified by real-time RT-PCR with a reference viral genomic RNA of known concentration. The amounts of viral RNA were normalized by comparison to GAPDH mRNA levels.
on November 8, 2019 by guest
http://jvi.asm.org/
after infection as described in Materials and Methods. The values obtained were normalized to the levels of GAPDH
mRNA. The IFN-gene was transcriptionally up-regulated by
more than 20-fold in both types of cells by 12 h after infection and by more than 100- to 1,000-fold at later times after
infec-tion (Fig. 2B). Beginning at 24 h, the levels of IFN-mRNA
detected in He cells were consistently higher than those in RV cells. Similar results were obtained with WNV-infected RV and He immortalized cell lines (data not shown).
Phosphorylation of Tyr701 on STAT1 is indicative of acti-vation of the cellular JAK-STAT signaling pathway by type 1 IFN. Activation of this signaling pathway is a prerequisite for the transcriptional induction of ISGs, such as theOasgenes, by IFN (66). As a means of demonstrating that IFN was produced by WNV infection, the time courses of STAT1 phosphoryla-tion following WNV infecphosphoryla-tion of RV and He cells were com-pared by immunoblot assay (Fig. 2C). By 16 h after infection in
extracts from primary He cells, phosphorylation of both the␣
andisoforms of STAT1 was observed (Fig. 2C, middle left
panel). The peak levels of STAT1 phosphorylation in these cells was detected at 40 to 48 h after infection and decreased to
some extent by 64 h, consistent with the time course of IFN-
mRNA up-regulation (Fig. 1B). In RV extracts, low levels of phospho-STAT1 were detected by 16 h; moderate levels of phosphorylation of both isoforms were detected between 24 and 48 h and then decreased by 64 h. The IFN response was efficient in both types of cells, but the higher replication of WNV in susceptible He cells likely resulted in the production of higher levels of IFN and STAT1 phosphorylation in these cells. However, the enhanced IFN signaling, as monitored by STAT1 phosphorylation, in the He cells did not result in more efficient inhibition of WNV RNA replication (Fig. 1). Some STAT1 protein was observed in both He and RV extracts collected after 1 h of mock infection, and a portion of this protein was phosphorylated in both extracts (the He band is present but very faint on the blot shown). This STAT1 phos-phorylation may be due to stress experienced by the second-passage primary MEFs during incubation for an hour with a small volume of medium. However, phosphorylation of STAT1 was not observed in either type of WNV-infected cell at either 4 (data not shown) or 6 h after infection.
[image:4.585.83.502.72.372.2]Among the small mouse Oas proteins, only the Oas1a,
FIG. 2. Induction of IFN-andOasgene expression and STAT1 phosphorylation in WNV-infected RV and He MEFs. Total cell RNAs were purified from primary RV and He MEFs that had been either mock infected or infected with WNV at an MOI 10 for 12, 24, 48, or 72 h. The RNA was subjected to semiquantitative RT-PCR (A) or real-time RT-PCR (B). Real-time RT-PCR was performed with inventoried TaqMan Gene Expression Assays (Applied Biosystems) for the gene for IFN-and for the endogenous control gene, GAPDH. (C) Western blot analysis of STAT1 and phosphorylated STAT1. Cell lysates were harvested at various times after infection (6 to 64 h) or after 1 h of mock infection (M) and detected with primary antibodies specific for the indicated proteins and horseradish peroxidase-conjugated secondary antibodies. Bands were detected via enhanced chemiluminescence. Actin was used as the loading control. Lanes M, mock. (D to F) Total cell RNAs were purified from primary RV and He MEFs that had been mock infected or WNV infected with an MOI of 10 for 12, 24, or 48 h. Q-RT-PCR analysis was performed with inventoried TaqMan gene expression assays (Applied Biosystems) for theOas1a(D),Oas-like2(E), andOas1b(F) genes. The gene for GAPDH was used as an endogenous control. PI, postinfection; RQ, relative quantification.
on November 8, 2019 by guest
http://jvi.asm.org/
Oas1g, and Oas-like2 proteins have been reported to be able to synthesize 2-5A (17, 37). However, full-length Oas1b was not previously tested. To assess the effect of IFN induction in RV
and He cells on ISGs, Oas1a, Oas-like2, and Oas1b mRNA
levels in primary RV and He MEFs infected with WNV at an MOI of 10 were compared by Q-RT-PCR. Total cell RNA was extracted at 8, 12, 24, and 48 h after infection, purified, and
analyzed. Uninfected cells contained very low levels ofOas1a
and Oas-like2 mRNAs, and no up-regulation of these genes was observed by 8 h after WNV infection (data not shown). However, the expression of both of these genes increased be-tween 8 and 48 h after WNV infection (Fig. 2D and E). By 12 h after infection in both types of cells, the expression ofOas1a
mRNA was up-regulated by at least twofold and the expression ofOas-like2mRNA was up-regulated by at least fivefold com-pared to uninfected control RNA samples. By 24 h after in-fection, both genes were up-regulated by more than 50-fold and by 48 h by more than 100-fold in both types of cells.
Although the IFN-response in WNV-infected RV MEFs was
less intense compared to that in He cells, the expression of the
Oas1aandOas-like2mRNAs was up-regulated to similar ex-tents in both types of cells.
The time course for the activation of theOas1b(Flv) gene,
was similar to that of the two otherOasgenes analyzed (Fig.
1F). The Oas1b proteins produced in the RV and He cells
differ due to the presence of a premature stop codon in the He cell transcript (51). The truncated Oas1b protein was previ-ously reported to be an inactive synthetase (37). Although the
level of wild-type Oas1b mRNA was more than five times
higher in uninfected resistant RV MEFs than that of the mu-tantOas1bmRNA in susceptible He cells, the extent and time course of up-regulation of both mRNAs were similar after WNV infection. These findings suggest that the presence of the
premature stop codon in the HeOas1btranscript does not lead
to rapid turnover of this mRNA (74).
Effect of IFN and/or poly(I) · poly(C) pretreatment on WNV replication in RV and He MEFs.The effects of IFN and poly(I) · poly(C), another activator of innate antiviral pathways, on WNV production in susceptible He and resistant RV primary MEFs were next compared. Since in a preliminary time course, transcriptional activation of a broad spectrum of ISGs was detected between 2 and 4 h after a 1-h incubation with IFN-␣/ (52; Scherbik and Brinton, unpublished), MEFs were treated with 1,000-IU/ml universal type I IFN for 4 h prior to in-fection with WNV at an MOI of 1. Viral titers produced by RV cells were reduced by about 1.5 log units, while those from He cells were reduced by about 1 log unit (Fig. 3A). Pretreat-ment of MEFs with 10-g/ml poly(I) · poly(C) for 1 h prior to WNV infection reduced virus yields from RV and He cells by 1.5 and 1 log units, respectively (Fig. 3B). Pretreatment of RV
FIG. 3. Effects of poly(I) · poly(C) and IFN pretreatments on WNV growth in MEFs. After various pretreatments, primary RV and He MEFs and C57BL/6 RNase L⫹/⫹and RNase L⫺/⫺MEF cell lines were infected with WNV at an MOI of 1. Samples of culture fluid were taken at the indicated
times, and titers were determined by plaque assay on BHK cells to compare the kinetics of virus growth. (A and D) Cells were either left untreated or incubated with 1,000-IU/ml universal type I IFN for 4 h prior to infection. (B and E) Cells were left untreated or incubated with 10-g/ml poly(I) · poly(C) for an hour prior to infection. (C and F) Cells were left untreated or incubated with 1,000-IU/ml universal type I IFN for 4 h and with poly(I) · poly(C) (10g/ml) for the last hour prior to infection. The virus titers at each time point are the averages of results of duplicate titrations from two experiments. Error bars indicate standard deviation and are shown where appropriate. Asterisks indicate titers below the detection limit of 102PFU/ml.
on November 8, 2019 by guest
http://jvi.asm.org/
and He MEFs with IFN-␣/for 4 h and with poly(I) · poly(C) for the last hour prior to WNV infection reduced virus pro-duction at 24 h after infection in both types of cells by about 1,000-fold, indicating that the antiviral effects of IFN and poly(I) · poly(C) were additive (Fig. 3C). While the level of virus produced by He MEFs increased slightly between 48 and 72 h, the RV MEF virus yields were below detectable levels by 48 h.
Effect of IFN and/or poly(I) · poly(C) pretreatment on WNV replication in RNase Lⴚ/ⴚ MEFs. To analyze the extent to which the Oas/RNase L pathway contributed to the anti-WNV response in susceptible cells, the effects of poly(I) · poly(C) and/or IFN pretreatment on WNV replication were analyzed in C57BL/6 (RNase L⫹/⫹) and C57BL/6 (RNase L⫺/⫺) MEFs. C57BL/6 mice are homozygous for the sameOas1ballele as susceptible He mice. Virus yields from RNase⫺/⫺cells were about 10-fold higher than those from RNase⫹/⫹cells (Fig. 3D). As observed with He and RV MEFs (Fig. 3A), pretreatment with 1,000-IU/ml type I IFN reduced virus yields by about 10-fold in both RNase L⫹/⫹and
RNase L⫺/⫺MEFs (Fig. 3D). However, pretreatment of RNase
L⫹/⫹or RNase⫺/⫺MEFs with poly(I) · poly(C) (10g/ml) only slightly reduced the yield of virus from RNase L⫺/⫺cells at the later time points (Fig. 3E). The effect of pretreatment with both IFN and poly(I) · poly(C) on virus yields (Fig. 3F) was the same as that seen with IFN treatment alone (Fig. 3D). The inability of the C57BL/6 cells to develop an effective antiviral response to
WNV after poly(I)䡠poly(C) pretreatment was unique to C57BL/6
MEFs since it was not seen with C3H-derived MEFs (Fig. 3B) and was not related to the presence or absence of RNase L.
Comparison of RNase L activity levels in resistant and sus-ceptible MEFs.To further investigate the role of RNase L in the antiviral response in RV and He MEFs, the levels of RNase L in the two types of cells were assessed. Naturally occurring mutations in the human RNASEL gene had been previously described (9, 10, 54). Proteins with the mutation
R462Q bound 2-5A at wild-type levels but showed a three-fold decrease in RNase activity. This mutant RNase L protein also showed a reduced ability to dimerize into a catalytically active form (10). To rule out the possibility that the susceptible He and congenic resistant RV MEF cell lines differ by a mutation in the RNASEL gene, RNase L mRNAs from the two types of cells were first cloned and sequenced. Full-length RNase L cDNAs were amplified from total cell RNA by RT-PCR
with primers 5⬘-TGCCAATTACTAGCTCCCTTCTTT-3⬘ and
5⬘-GGTGGAGGCTGTGGGAAGTGTTT-3⬘. The RNase L
cDNA sequences obtained from the RV and He cells were identical to each other and to the C3H/An sequence (GenBank accession no. NM_011882) (data not shown).
Sustained activation of endogenous RNase L via interaction with 2-5A results in cleavage of 28S and 18S rRNAs at unique sites, and detection of characteristic rRNA cleavage fragments is utilized as a means of assaying intracellular RNase L activity (64, 75). Monolayers (90% confluent) of each cell type were
transfected with 2, 5, or 10M 2-5A for 4 to 5 h. Total cell
RNA was then isolated, separated on RNA chips, and analyzed as described in Materials and Methods (Fig. 4A). Similar mod-erate levels of RNase L activity were observed in the two cell types after transfection of 10M 2-5A for 5 h; the percentages
of rRNA cleavage calculated for the RV extracts were 8.0⫾
2.6 (18S) and 7.6⫾4 (28S), and the percentages for the He
extracts were 8.9⫾3.6 (18S) and 7.8⫾5.2 (28S). With lower
concentrations of 2-5A, weak RNase L cleavage bands were observed in the He extracts but not in the RV extracts (Fig. 4A).
RNase L activity in WNV-infected susceptible He and resis-tant RV MEFs. Although 2-5A transfection did not induce higher levels of RNase L activity in resistant cells compared to susceptible cells, the possibility that WNV infection could have a differential effect on the activation of RNase L in the two types of cells had not been ruled out. To analyze rRNA
cleav-FIG. 4. Assay of intracellular RNase L activity in RV and He MEFs. RNase L produces characteristic rRNA cleavage products in the presence of 2-5A. (A) RV and He MEF cell lines were transfected with 2-5A at a concentration of 2, 5, or 10M for 4 to 5 h with Lipofectamine (Invitrogen). Total cell RNA was then isolated, separated on RNA chips (Agilent Technologies), and analyzed with an Agilent Bioanalyzer 2100. The positions of major RNase L-mediated rRNA cleavage products are indicated on the right. (B) Assay of RNase L activation after WNV infection. Total cell RNAs extracted from RV and He MEFs infected with WNV at an MOI of 1 for 24, 48, or 72 h were separated on RNA chips and analyzed. (C) Northern blot analysis of total cellular RNA from He and RV cells infected with WNV at an MOI of 1 for 48 or 72 h. Total cell RNA (5g) was separated on a 1% denaturing agarose gel and transferred to a Hybond-XL membrane. The blot was hybridized to a 32P-labeled DNA probe specific for the 3⬘UTR of the WNV genome RNA.
on November 8, 2019 by guest
http://jvi.asm.org/
age after WNV infection, confluent monolayers of the RV and He cell lines were infected with WNV at an MOI of 1, and at 24, 48, or 72 h after infection, total cell RNA was isolated and separated on RNA chips (Fig. 4B). No characteristic rRNA cleavage products were detected at 24 h after infection in extracts from either cell type. By 48 h, a weak band migrating at a position characteristic of a major RNase L-generated 28S rRNA cleavage band was detected only in the He cell sample. By 72 h, bands characteristic of RNase L rRNA cleavage were detected in both cell types of about the same density as
ob-served after transfection of 2M 2-5A (Fig. 4A). Many
addi-tional RNA bands, including an increased amount of small RNA fragments, were also detected in both types of cell ex-tracts. To further analyze the viral cleavage bands generated, Northern hybridization was done with total cellular RNA pu-rified from RV and He cells at 48 and 72 h after infection with WNV at an MOI of 1. The probe was an 800-nt fragment
corresponding to the 3⬘ end of the WNV genome. Strong
bands of 11 kb and⬃0.6 kb were detected (Fig. 4C). Also,
multiple faint bands ranging between⬃2 and 8 kb were
ob-served which likely represent both incomplete nascent viral genomes and RNase digestion fragments of different lengths. The 11-kb band corresponds to the full-length viral genomic
RNA. The⬃0.6-kb band is a genome fragment that has
pre-viously been reported to accumulate in flavivirus-infected cells
and mouse brains (42, 68). The ratios of the⬃0.6-kb band to
the genomic RNA were similar in RV and He extracts. In vitro activation of RNase L in MEF extracts by WNV
RNA.It was previously reported that addition of HCV genomic
RNA (9.6 kb) to S10 cell extracts prepared from IFN-treated HeLa cells induced the appearance of rRNA fragments char-acteristic of RNase L activity (30). Human 2⬘-5⬘OAS present in these extracts was activated by the HCV RNA to synthesize 2-5A, which in turn activated RNase L. The minimal
concen-tration of HCV RNA required for the activation of 2⬘-5⬘OAS
and RNase L was ⬃20 nM. Below this concentration, HCV
RNA was stable; above this concentration, HCV RNA was rapidly cleaved by RNase L. Although HCV genomic RNA is
single stranded, in solution it forms a significant amount of secondary or tertiary structures with conserved structures in the terminal regions (6, 70). To analyze the ability of WNV
RNA to activate Oas/RNase L in mouse cell extracts, 32
P-labeled 3⬘WNV RNA (4.6 kb) in vitro transcribed from WNV
Eg101 cDNA was incubated at 34°C for 2 h with S10 extracts prepared according to the protocol of Han and Barton (30) from RV and He MEF cell lines treated for 18 h with 1,000 IU/ml of universal type I IFN. A truncated WNV RNA was
used to achieve concentrations of⬎20 nM. At the end of the
incubation period, the RNA was fractionated by electrophore-sis on 1% agarose gels. The rRNA in the extracts was visual-ized by UV light, and the radiolabeled WNV RNA was de-tected by phosphorimaging the dried gel. In contrast to what was observed with HCV in HeLa cell extracts, the WNV RNA did not activate rRNA cleavage to a level sufficient to be detected by ethidium bromide staining in mouse MEFs (data not shown). As a positive control, the RV and He S10 extracts were incubated with 50-g/ml poly(I) · poly(C) to activate Oas proteins in the extracts to synthesize 2-5A. Faint characteristic rRNA cleavage bands were observed in extracts from both types of cells after incubation with poly(I) · poly(C), indicating that sufficient levels of both Oas and RNase L proteins were present in these extracts for detectable rRNA cleavage to be induced by poly(I) · poly(C) (data not shown).
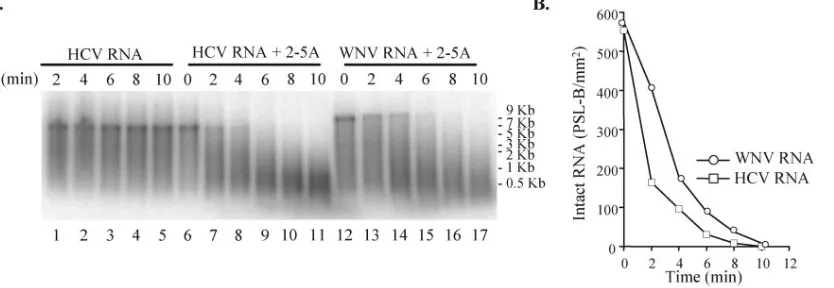
Cleavage of WNV RNA by recombinant RNase L.It was pre-viously reported that various viral RNAs differ in their sensitivity to RNase L cleavage (30, 31). To examine the sensitivity of WNV RNA to cleavage by recombinant RNase L, a 9.4-kb replicon WNV RNA was transcribed from pRepWNVE101 cDNA in re-action mixtures containing purified human RNase L. HCV RNA (8 kb) transcribed from replicon Con1/SG-Neo(I) (genotype 1b) cDNA was used as a positive control. HCV RNAs of both genotypes 1a (30) and 1b (D. J. Barton, personal communica-tion) were shown to be highly susceptible to RNase L degra-dation. In the absence of 2-5A, HCV RNA was not degraded by 10 nM RNase L (Fig. 5A, lanes 1 to 5). Also, HCV RNA was not degraded after incubation with 2-5A alone at
concen-FIG. 5. Cleavage of HCV and WNV RNAs by purified recombinant RNase L. (A)32P-labeled HCV (8 kb) or WNV (9.4 kb) RNA was incubated for 0 to 10 min in reaction mixtures containing purified human RNase L (10 nM). Lanes 1 to 5, HCV RNA; lanes 6 to 11, HCV RNA plus 25 nM 2-5A; lanes 12 to 17, WNV RNA plus 25 nM 2-5A. The radiolabeled RNAs were then fractioned by electrophoresis on 1% agarose gels and visualized by phosphorimaging. (B) Graphic depiction of the kinetics of disappearance of genome-sized RNA. The relative amounts of radioactivity in the viral RNA bands in each lane in panel C were quantified with MacBAS software on an image analyzer. The values obtained were expressed as photostimulated luminescence (PSL) minus the background (B) per square millimeter and plotted versus time of incubation.
on November 8, 2019 by guest
http://jvi.asm.org/
[image:7.585.87.504.73.217.2]trations of up to 2,500 nM (data not shown), indicating that few nucleases other than RNase L were present in these reaction mixtures. In the presence of 25 nM 2-5A, 50 nM HCV RNA was rapidly cleaved by activated RNase L into 200- to 1,000-nt fragments (Fig. 5A, lanes 6 to 11) so that by 6 min no length HCV RNA remained. Under the same conditions, full-length WNV RNA (50 nM) was still detected after 6 min of incubation (Fig. 5A, lanes 12 to 17). The lengths of the major WNV RNA cleavage fragments observed by 10 min ranged from 500 to 2,000 nt, suggesting that about 5 to 20 sites within the WNV replicon RNA were cleaved. The results show that WNV RNA is susceptible to cleavage by RNase L. However, under the same conditions WNV RNA was degraded less ef-ficiently than HCV RNA (Fig. 5B). A distinct WNV cleavage
band of⬃0.6 kb was not observed.
Beutler et al. (3) suggested that reduced susceptibility to RNase activity might be a possible reason for the lower-than-expected frequency of UA dinucleotides in cell mRNA. Rima and McFerran (55) reported that the fre-quency of various dinucleotides varied in single-stranded RNA genomes, and Han and Barton (30) reported that all natural isolates of HCV RNA contain a lower number of UA and UU dinucleotides than expected and that IFN-resistant HCV strains have fewer UA and UU dinucleotides than do strains more sensitive to IFN. The numbers of UA (or AU) and UU dinucleotides in the coding regions of the genomes of several single-stranded, positive-sense RNA vi-ruses were estimated from the base compositions (Table 1, predicted values) and compared with the actual numbers of UA, AU, and UU dinucleotides present (Table 1, observed values). A reduction in the number of UA dinucleotides was observed for all of the viral genomes analyzed, and these
reductions ranged from⫺10% in the mouse hepatitis virus
genome to⫺56% in the yellow fever virus genome. Notably,
the greatest reductions in the observed versus predicted number of UA dinucleotides were found in the flavivirus
genomes. In contrast, the observed and predicted numbers of AU and UU dinucleotides did not differ significantly in the genomes analyzed. These results indicate that the re-duced susceptibility of WNV RNA to RNase L cleavage compared to that of HCV RNA is not due to fewer cleavage sites, since the open reading frames of the two genomes contain similar numbers of UA dinucleotides (Table 1, ob-served numbers of UA dinucleotides) and there are more UU dinucleotides in the WNV than in the HCV RNA. A larger number of the cleavage sites in the WNV RNA may be inaccessible because they are located within double-stranded regions of RNA structures. Alternatively, the se-quences flanking some of the UA nucleotides may alter the efficiency of their recognition or cleavage.
Suppression of RNase L expression in flavivirus-resistant mouse cells.It was previously reported that when an inactive, truncated form of RNase L which lacks 89 of the C-terminal amino acid residues in the RNase domain is stably expressed at high levels in murine cells, it functions as a dominant negative mutant, strongly inhibiting endogenous RNase L activity (34). As another means of investigating whether RNase L plays a role in the flavivirus resistance phenotype, RNase L activity in flavivirus-resistant cells was suppressed by stable expression of the trun-cated form of RNase L. The resistant RV MEF cell line was transfected with pcDNA-ZB1 DNA, which expresses the domi-nant negative RNase L protein, or with the empty vector pcDNAI/Neo DNA. Transfected cells were then selected for re-sistance to G418 and cloned. Truncated RNase L mRNA levels in extracts prepared from individual selected clones were first as-sayed by RT-PCR for the expression of vector-specific transcripts. Those clones that produced an RT-PCR band were then tested for the expression of the truncated (dominant negative) protein with an in vitro 2-5A binding assay (Fig. 6A). In this assay, both the endogenous RNase L and the stably expressed truncated RNase L present in the cell extracts are covalently cross-linked to a32P-labeled, bromine-substituted 2-5A analog probe. The
cross-TABLE 1. Potential RNase L cleavage sites in the open reading frames of selected positive-strand RNA viruses
Virus (GenBank accession no.)
No. of dinucleotides
predicted (AU or UA)
No. of UA dinucleotides
observed
Deviation from predicted, %
No. of AU dinucleotides
observed
Deviation from predicted, %
No. of UU
dinucleotides Deviation from
predicted, %
Predicted Observed
WNV Eg101 (AF260968) 604 279 ⫺54 575 ⫺5 496 475 4
WNV (NC_001563) 609 281 ⫺54 578 ⫺5 485 509 5
YFV (NC_002031.1) 644 282 ⫺56 632 ⫺2 554 571 3
JEV (NC_001437.1) 593 315 ⫺47 560 ⫺5 447 470 5
Dengue 2 virus (AB189123) 714 421 ⫺41 697 ⫺2 453 498 10
Hepatitis G virus (NC_001710) 360 248 ⫺31 357 ⫺1 465 432 ⫺7
HCV 1a (NC_004102) 382 291 ⫺23 367 ⫺4 409 370 ⫺9
Hepatitis A virus (NC_001489) 661 376 ⫺43 634 ⫺4 716 826 15
Poliovirus (NC_002058) 481 348 ⫺27 487 1 382 412 8
Hepatitis E virus (NC_001434) 215 192 ⫺11 233 8 314 333 6
EAV (NC_002532) 525 337 ⫺36 441 ⫺16 622 685 10
SHFV (NC_003092) 625 413 ⫺34 578 ⫺8 779 763 ⫺2
MHV (AY700211) 1,793 1,621 ⫺10 1,701 ⫺5 2,327 2,298 ⫺1
Sindbis virus (NC_001547) 451 367 ⫺19 420 ⫺7 327 372 14
a
YFV, yellow fever virus; EAV, equine arteritis virus; SHFV, simian hemorrhagic fever virus; MHV, mouse hepatitis virus.
on November 8, 2019 by guest
http://jvi.asm.org/
[image:8.585.46.541.81.298.2]linked complexes were separated by gel electrophoresis, and en-dogenous and truncated RNase L bands were visualized by phos-phorimaging (Fig. 6A). Expression of the dominant negative protein was detected in only two of the six clones tested, RT/ ZB1-83 and RT/ZB1-86 (Fig. 6A, lanes 4 and 7). Interestingly, these clones were both ones that expressed lower levels of endog-enous RNase L (equal amounts of total protein were loaded on each well). Different autoradiograph exposure times did not re-veal a truncated RNase L protein band in lane 2, 3, or 5. Extracts from clones expressing the mutant protein were next used to assay RNase L activity after transfection of 2-5A. No characteristic rRNA cleavage products were detected in RT/ZB1-83 (Fig. 6B) or RT/ZB1-86 (data not shown) cell extracts after transfection with 10M 2-5A for 4 to 5 h, indicating that RNase L activity in these RV clones was significantly reduced. In contrast, distinct rRNA cleavage products were observed in untransfected control resistant cells and in resistant cells transfected with the empty vector under the same conditions (Fig. 6B).
The effect of expression of dominant negative RNase L in
RV cells on the RNase L activity induced 72 h after WNV infection was next investigated. No rRNA cleavage products
were observed in the RT/ZB1-83 or the C57BL/6 RNase L⫺/⫺
extracts, while a characteristic rRNA cleavage band was ob-served under the same conditions in extracts from C57BL/6
RNase L⫹/⫹and control empty vector-containing RV RT/neo
MEFs (Fig. 6C).
Among the infected cell extracts, the highest amounts of the very small RNA bands that increased with time after WNV infection (Fig. 6C) were observed in extracts from the RT/ ZB1-83 cells that had reduced RNase L activity and from the
C57BL/6 RNase L⫺/⫺ cells that had no RNase L activity.
These bands were further analyzed by Northern hybridization of cellular RNAs purified 72 h after WNV infection (MOI of
1) from RNase L⫹/⫹and RNase L⫺/⫺MEFs with a WNV 3⬘
untranslated region (UTR) probe (Fig. 6D). Similar patterns of viral RNA bands were observed in the two types of C57BL/6 cells. The predominant bands were the 11-kb genome and the
[image:9.585.80.503.70.376.2]⬃0.6-kb band, and the relative intensity of the⬃0.6-kb band
FIG. 6. Effect of suppressing or knocking out endogenous RNase L activity on the cleavage of rRNA and WNV RNA. (A) Clones of RV MEFs stably expressing truncated RNase L were generated as described in Materials and Methods. To detect those clones that expressed both RNase L proteins, covalent cross-linking of32P-labeled 2-5A to endogenous and truncated (dominant negative) RNase L in cell extracts was used. Lane 1, extract from untransfected RV MEFs (RU). Lanes 2 to 7, extracts from six G418-selected clones of RNase L mutant-transfected RV MEFs (RT/ZB1). Lane 8, 2g of crude extract from insect cells expressing human RNase L from a baculovirus vector (16). (B) rRNA cleavage assay of total RNA extracted from untransfected RV cells (RU) or RV cells transfected with the empty expression vector pcDNAI/Neo (RT/neo) or an RV clone expressing mutant RNase L (RT/ZB1-83). 2-5A (10M) was transfected into cells with Lipofectamine 2000 for 4 h. Total RNA was then extracted, separated, and analyzed with RNA chips (Agilent). (C) rRNA cleavage assay of total RNA isolated from RT/neo, RT/ZB1-83, C57BL/6 RNase L⫹/⫹, or C57BL/6 RNase L⫺/⫺MEFs.
Cells were infected with WNV at an MOI of 1 for 72 h. (D and E) Northern blot analysis of total cellular RNAs from C57BL/6 RNase L⫹/⫹and RNase
L⫺/⫺MEFs infected for 48 or 72 h with WNV at an MOI of 1. RNA (5g) was separated on a 1% denaturing agarose gel (D) or by 5% urea-PAGE
(E) and then transferred to a Hybond-XL membrane. The blots were hybridized to a32P-labeled DNA probe specific for the 3⬘UTR of the WNV genome RNA. vRNA, viral RNA.
on November 8, 2019 by guest
http://jvi.asm.org/
correlated with that of the 11-kb RNA (Fig. 6D). This pattern was similar to the one observed in WNV-infected RV and He MEFs (Fig. 4C). To further analyze the small RNAs in these samples, the RNA was separated by 5% urea-PAGE and
detected by Northern blotting with the 3⬘ UTR probe. The
⬃0.6-kb band was the major band detected (Fig. 6E). The well
is shown at the top of the gel and contains the longer viral RNAs that had not run into the gel under the conditions used to visualize the smaller-size viral RNAs. Several faster-migrat-ing faint bands were also detected. The RNA patterns in the two types of cell extracts were similar. These results indicate that RNase L is not mediating the cleavage of an⬃0.6-kb viral RNA in infected cells, since this band accumulates in WNV-infected RNase L⫺/⫺cells and in RNase L⫹/⫹cells.
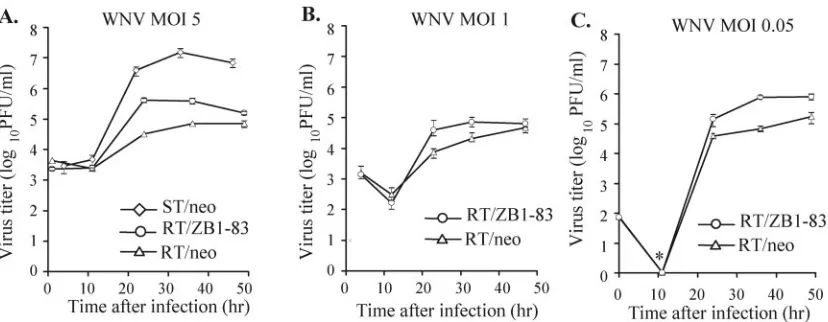
Effect on the growth of WNV of reducing RNase L activity in RV MEFs.Since the extent of Oas activation was previously reported to vary with the infectious dose of virus used (1), three different MOIs of WNV were used. Empty-vector-con-taining resistant cells (RT/neo) and RV clone RT/ZB1-83 (RNase L dominant negative expressing) cells were infected with WNV at MOIs of 0.05, 1, and 5, and viral growth in the two types of cells was compared. After infection with each of the three MOIs, RT/ZB1-83 cells produced 5- to 10-times-higher yields of virus than control resistant cells (peak titer of 5⫻104to 105versus 104PFU/ml) by 24 to 36 h postinfection
(Fig. 7A-C). A 5- to 10-fold increase in virus yields was also seen when growth curves were determined with the other RV clone, RT/ZB1-86, that expressed the RNase L dominant neg-ative protein (data not shown). As expected, the congenic susceptible He MEFs (ST/neo, stably transfected with the empty vector) produced 100 times more virus than the control resistant cells (107versus 105PFU/ml) (Fig. 7A). Similar virus
yields and growth kinetics were consistently observed with un-transfected He MEFs (Fig. 3A).
DISCUSSION
In a previous study, both biochemical and microarray analyses
of a human embryonic kidney cell line showed that IFN-mRNA
was induced at a very low level by 24 h after WNV infection and that up-regulation of ISGs was not observed until 36 h (19). Delayed activation of the transcription factor IFN regulatory fac-tor 3 was reported to be the cause of the delayed expression of the antiviral genes in these WNV-infected cells. However, despite induction of the host antiviral response by 36 h, WNV was still able to replicate efficiently (19). Others have reported that flavi-virus nonstructural proteins NS4B and NS2A partially inhibit the IFN-induced response via inhibition of the Jak-Stat signaling pathways (28, 43, 44, 47). In the present study, a more rapid
induction of IFN-was observed. IFN-mRNA was shown to be
up-regulated in both resistant RV and susceptible He MEFs between 12 and 72 h after infection with WNV. Although the levels of IFN-produced were not assayed directly, observation of increasing levels of STAT1 phosphorylation beginning at 16 h after infection and of the progressive up-regulation of mRNA expression from known ISGs, such asOas-like2andOas1a, be-tween 12 and 48 h after infection indicated that IFN-had been produced and secreted and had interacted with cell surface IFN receptors.
The higher levels of IFN-mRNA and STAT1
phosphory-lation observed in WNV-infected susceptible He MEFs com-pared to those in resistant RV cells likely correlated with the higher levels of viral components produced in these cells (7, 13, 50). However, even though the levels of STAT1 phosphoryla-tion were lower in infected RV cells, the up-regulaphosphoryla-tion of the ISGs tested (Fig. 2) was as efficient, suggesting that the level of IFN activation was sufficient in both cell types for the activa-tion of ISGs or, alternatively, that another virus-mediated pathway contributed to the activation of these genes (59, 80).
[image:10.585.84.498.69.230.2]AlthoughOas1bmRNA levels were similarly up-regulated in
FIG. 7. Effect of suppressing endogenous RNase L activity on the growth of WNV in MEFs. Cells were infected with WNV at an MOI of 5 (A), an MOI of 1 (B), or an MOI of 0.05 (C), and virus growth kinetics were compared. Samples of culture fluid were harvested at the indicated times, and titers were determined by plaque assay on BHK cells. ST/neo, susceptible He MEFs stably transfected with the empty expression vector pcDNAI/Neo. RT/neo, resistant RV MEFs stably transfected with the empty expression vector pcDNAI/Neo. RT/ZB1-83, resistant RV MEFs stably expressing dominant negative mutant RNase L from pDNAI-ZB1. The virus titers at each time point are the averages of results of duplicate titrations from two experiments. Error bars indicate standard deviation and are shown where appropriate. The asterisk indicates titers below the detection limit of 102PFU/ml.
on November 8, 2019 by guest
http://jvi.asm.org/
RV and He cells after WNV infection, the levels of Oas1b
mRNA in uninfected RV cells were consistently found to be about fivefold higher. Pantelic et al. (50) detectedOas1bgene activation by WNV in RV and He macrophages by 3 and 5 days after infection by Northern blot analysis but did not detect
Oas1bmRNA in uninfected cells.
The 2-5A/OAS/RNase L pathway can be activated in cells by IFN, dsRNA, and virus infection (reviewed in references 57 and 60). This pathway has been shown to be a key component of the innate immune response against such viruses as vaccinia virus, reovirus, and EMCV (15, 23, 48). Treatment of either resistant or susceptible MEFs with a high dose of IFN for 4 h or with poly(I) · poly(C) for 1 h prior to infection with WNV reduced virus yields from both resistant and susceptible MEFs by about 10-fold com-pared to those from untreated control cells, suggesting that the induction of an antiviral response had similar effects in both types of cells. The finding that WNV RNA is susceptible to cleavage by
recombinant RNase L and the consistent observation of an⬃
10-fold increase in the yields of WNV when RNase L activity was suppressed in RV cells (Fig. 7) or knocked out in susceptible C57BL/6 cells (Fig. 3) indicated that the 2-5A/OAS/RNase L pathway does play a role in the cellular antiviral response to WNV in both resistant and susceptible MEFs. It was previously reported that the antiviral effect of IFN against dengue virus infection was PKR, RNase L, and Mx independent (14). The findings of the present study show that RNase L does mediate an inhibitory response against the flavivirus WNV.
It has previously been suggested that low levels of 2-5A result in RNase L-mediated selective degradation of viral mRNA (41) while higher levels of 2-5A lead to broader effects such as cleavage of 18S and 28S rRNAs (75). The levels of characteristic rRNA cleavage bands observed in both types of RV and He cells by 72 h after WNV infection were similar to
those observed after transfection of 2M 2-5A. Similar
pat-terns of viral 3⬘cleavage bands were detected in WNV-infected RNase L⫹/⫹, RNase L⫺/⫺, RV, and He MEFs, and the relative amounts of viral cleavage products in these cells correlated with the amount of genome RNA present. The major cleavage
product detected from the 3⬘region of the WNV genome was
⬃0.6 kb in size. The accumulation of a 3⬘fragment of 521 to
523 nt in Japanese encephalitis virus (JEV)-infected BHK and C6/36 cells was previously reported (42), and an⬃0.6-kb frag-ment was detected in Murray Valley encephalitis virus-infected mouse brain cells (68). Equivalent increases in the levels of the
small 3⬘viral RNA fragment and the full-length genome RNA
were observed in RV cells with suppressed levels of RNase L
and in susceptible RNase L⫺/⫺cells. The detection of small
viral 3⬘ cleavage bands of the same sizes in cells with and
without RNase L indicated that these bands were not gener-ated by RNase L. It seems unlikely that the 0.6-kb RNA is a viral transcript, since there is no evidence for the existence of a flavivirus subgenomic promoter. Some previous studies have supported the existence of other cellular RNases involved in viral RNA degradation (2, 25).
Additional functions for RNase L have recently been proposed.
Selective stabilization of PKR mRNA, a longer period of eIF2␣
phosphorylation, and a significant inhibition of EMCV and VSV protein synthesis were observed in RNase L⫺/⫺cells, suggesting a novel negative feedback role for RNase L in the control of PKR mRNA stability that transiently regulates the levels of PKR in
IFN-treated cells (39). The human translation factor eRF3/ GSPT1 was recently identified as an interacting partner of RNase L, and the interaction between eRF3 and RNase L was shown to
reduce premature translation termination and to increase ⫹1
frameshifting (40). RNase L has also been reported to play a role in the development of prostate cancer (9, 10, 54, 76).
The antiviral responses activated by pretreatment with
IFN-␣/ (1,000 IU/ml) and/or poly(I) · poly(C) (10 g/ml) were
compared in RV and He MEFs. In both types of cells, IFN-␣/
or poly(I) · poly(C) reduced the yield of WNV by about 10-fold (Fig. 3). Pretreatment with both poly(I) · poly(C) and IFN-␣/
prior to infection with WNV reduced virus yields by⬃
1,000-fold from both types of cells by 24 h after infection. Thereafter, the virus titers dropped to undetectable levels in resistant RV cell culture fluids but increased slightly in susceptible He fluids. These results suggest that the antiviral responses induced by either IFN-␣/ or poly(I) · poly(C), although not identical, inhibit WNV yields to similar levels in both types of cells. The effect of combined pretreatment was synergistic in both types of cells. However, in all cases tested, the virus titers produced by the resistant cells were lower than those produced by the susceptible cells. Our results differ from those of Pantelic et al. (50) in the extent of the antiviral effect induced by combined IFN and poly(I) · poly(C) pretreatment in susceptible He cells. In their experiments, pretreatment of He macrophages with both IFN and poly(I) · poly(C) completely suppressed WNV replication up to 5 days after infection, while we observed only
an⬃1,000-fold decrease in the virus titer in He MEFs.
A surprising finding was that poly(I) · poly(C) did not induce an efficient antiviral response to WNV in C57BL/6 MEFs. A previous study showed that the signal transduction pathway(s) required for poly(I) · poly(C)-dependent induction of 2-5A
Oas mRNA was intact in both C57BL/6 RNase L⫹/⫹ and
RNase L⫺/⫺mice (27). Gariglio et al. (20) reported thatOas gene activation in response to poly(I) · poly(C) treatment in C57BL/6 mice and cells was normal but that the expression of p202 mRNA was not up-regulated. p202 mRNA is usually
strongly up-regulated by IFN-␣. Results from reporter assays
suggested that C57BL/6 cells may have defectivetrans-acting
factors that impair the ability of IFN-␣to activate particular genes. The Mx protein, an IFN-induced GTPase that selec-tively inhibits influenza viruses and bunyaviruses (29), is not involved in the antiviral response in C57BL/6 mice since they are deficient in Mx (29, 66). Interestingly, C57BL/6 mice have been reported to be more resistant to the development of JEV-induced encephalitis after peripheral inoculation than are other susceptible inbred mouse strains even though they pro-duce equal levels of viremia (46). This may be due to the inability of C57BL/6 mice to mount an effective dsRNA-in-duced response to flaviviruses. A recent report stated that mice that are deficient in Toll-like receptor 3, which recognizes dsRNA, are resistant to lethal WNV infection (71). The au-thors of that report postulated that the WNV-induced Tlr3-dependent inflammatory response compromises the blood-brain barrier and allows virus entry into the blood-brain.
Although the gene controlling resistance to flavivirus-induced
disease has been identified as Oas1b(51), the mechanisms by
which the alleles of this gene differentially regulate the levels of viral RNA in infected cells and disease in mice are not known. The decreased levels of viral RNA in resistant cells observed even