STATISTICAL ARTICLE
ERTHYGL YSTADEGOL
Young people not in education, employment or training (NEET)
1(Year to 30 June 2009)
This article summarises the available statistics on young people not in education, employment or training (NEET) in Wales. The definitive source for NEET estimates for Wales is the annual Statistical First Release (SFR) currently published around 19 months after the reference year. This article provides users with more timely, but less statistically robust, NEET statistics and includes analysis by gender, age and region.
This analysis is being published as a Statistical Article as the more timely statistics using the Annual Population Survey are based on relatively small sample sizes of 16-18 year olds and are statistically less robust than those published in the SFR. Care also needs to be taken when comparing estimates from the different sources due to differences in definitions.
The Welsh Assembly Government in the Learning Country: Vision into Action set a target to increase the percentage of young people in employment, education or training to reach 93 per cent by 2010. The SFR NEET estimates are used to measure progress against this target.
The statistics included in this article are taken from the following sources:
• Statistical First Release ‘Participation of young people in education and the labour market’ using education data sources and the Annual Population Survey (APS);
• Annual Population Survey (ONS); and
• Careers Wales Pupil Destinations from Schools in Wales survey.
The number of young people who are NEET in Wales is measured using data published annually in the Statistical First Release (SFR) ‘Participation of young people in education and the labour market’. This is the definitive source for NEET figures for Wales. However, these data are only available annually, with a time lag of around 19 months after the end of the reference year and cannot be disaggregated at unitary authority level.
Analysis of the Annual Population Survey (APS) provides less robust in-year estimates to be made of the annual SFR measure.
Date of Publication: 20 January 2010
Next update: April 2010 (provisional)
Author: Susan Full, Cross-cutting Education and Skills Statistics, Statistical Directorate
E-mail: post16ed.stats@wales.gsi.gov.uk
Telephone: 029 2082 3507
Most recent results from these sources:
• SFR basis - As at end 2007, 11.5 per cent of 16-18 year olds were NEET (14,000) compared with 9.8 per cent (12,000) in 2006;
• APS basis - As at year end Quarter 2 2009, 12.9 per cent of 16-18 year olds were NEET compared with 11.6 per cent as at year end Quarter 2 2008;
The Careers Wales pupil destinations data provide estimates of young people NEET in the October after completing Year 11 and is available at a Unitary Authority level. However the Careers Wales survey uses slightly different definitions for NEET than those used in the SFR.
Note that this article is restricted to statistical sources and does not include information derived from non-statistical sources such as Careers Wales management information systems.
NEET SFR series (last updated – July 2009)
Participation of Young People in Education and the Labour Market, 2007
For this series the data presented covers 16-18 year olds on an academic age basis (ie age as at 31 August prior to the start of the academic year).
The NEET estimates published in the SFR are a measure of the proportion of young people who are NEET as at the end of the calendar year. It is based on population estimates as at the end of the calendar year, education enrolments counts in December for work-based learning, further and higher education and in the following January for schools. The Annual Population Survey is used to estimate the
proportion of those not in education or training who are unemployed or inactive and relates to the whole of the reference year.
As at end 2007, 11.5 per cent of 16-18 year olds were NEET (14,000) compared with 9.8 per cent (12,000) in 2006. Chart 1 shows the published SFR time series of NEET rates for 16-18 year olds. The series shows that the proportion of young people who are NEET has ranged between 10-12 per cent over the years 1996 to 2007 accounting for around 12,000-14,000 young people. Due to the use of survey data there will be some element of sampling variability in the estimates. The chart also shows an estimate of NEET rate based on the Annual Population Survey2 only. These estimates are for the calendar year. Both series
show similar levels and trends.
Chart 1: Young people not in education, employment or training in Wales, age 16-18:
Comparison of estimates in the Statistical First Release and using the Annual
Population Survey (calendar year)
0 2 4 6 8 10 12 14 16
1996 1997 1998 1999 2000 2001 2002 2003 2004 2005 2006 2007 2008
Per cen
t
APS rolling year series (last updated – January 2010)
The data presented covers 16-18 year olds on an academic age basis (ie age as at 31 August prior to the start of the academic year).
The Annual Population Survey (APS) is published on a rolling year basis every quarter. The most recent published year covers the period July 2008 to June 2009. Estimates based on the APS can be used to monitor trends in NEET rates between publications of the SFR.
The reference period for these estimates is the whole year and there is a large overlap in the responses included in consecutive rolling years. Therefore the overall trend of the series should be considered with comparisons to the same point a year previous and not changes between consecutive rolling year
estimates. As these estimates are based on survey data there will be some variability in estimates due to sampling variation.
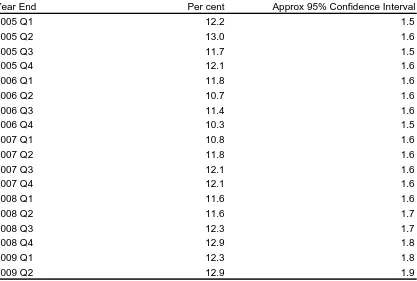
Chart 2 shows the APS rolling year series for the years (April 2004-Mar 2005) to (July 2008-June 2009) along with a four-point moving average of the series. Over this period the estimate of the proportion of young people NEET has fluctuated between 10-13 per cent. The trend was downward over the period up to year end Quarter 1 2007 and since then has shown an upward trend. Table 2 includes approximate 95 per cent confidence intervals for these estimates which for all periods is around ±2 per cent.
As at year end Quarter 2 2009, 12.9 per cent of 16-18 year olds were estimated to be NEET compared with 11.6 per cent as at year end Quarter 2 2008.
Chart 2: Young people not in education, employment or training in Wales, age 16-18:
Annual Population Survey (rolling year end) and 4 point moving average
0 2 4 6 8 10 12 14 16 2005 Q 1 2005 Q 2 2005 Q 3 2005 Q 4 2006 Q 1 2006 Q 2 2006 Q 3 2006 Q 4 2007 Q 1 2007 Q 2 2007 Q 3 2007 Q 4 2008 Q 1 2008 Q 2 2008 Q 3 2008 Q 4 2009 Q 1 2009 Q 2 Year end Per cent
The APS can also be used to provide analysis of NEET rates by characteristics not available via the SFR series. Due to small sample sizes when looking at sub-groups it has been necessary to use estimates based on three year averages and therefore should be use to compare groups or regions only. Chart 3 shows analysis by gender3 and single year of age and chart 4 provides regional data.
Chart 3: Young people not in education, employment or training in Wales:
by age and gender, (Average of years ending 2007Q2, 2008Q2, 2009Q2)
0 2 4 6 8 10 12 14 16
Male 16-18 Female 16-18
16 17 18
Age and gender
Per cent
Chart 4: Young people not in education, employment or training in Wales, age 16-18:
by region, (Average of years ending 2007Q2, 2008Q2, 2009Q2)
0 2 4 6 8 10 12 14 16
Per cen
Comparisons with rest of the UK
DCSF publish estimates of 16-18 year old NEET rates for England using similar methodology to our SFR on an annual basis. The most recent published data are 2008 provisional figures. Chart 5 shows a
comparison of the English and Welsh estimates.
Chart 5: Young people not in education, employment or training in Wales, age 16-18:
Wales and England
0 2 4 6 8 10 12 14
1996 1997 1998 1999 2000 2001 2002 2003 2004 2005 2006 2007 2008 (p)
Per cent
Wales England
The DCSF also publish a quarterly brief on NEET which includes NEET rates estimates based on the Quarterly Labour Force Survey (LFS). These quarterly estimates are not seasonally adjusted. The quarterly estimates are not comparable with the Welsh APS only estimates published in this brief. The sample size for 16-18 year olds in Wales in the Quarterly LFS is not sufficiently large to produce quarterly estimates fro Wales.
Pupil destinations from schools in Wales (last updated – Mar 2009)
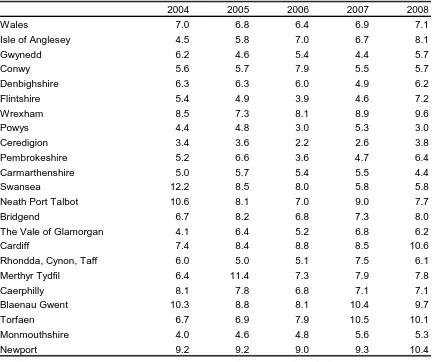
Pupil Destinations from Schools in Wales, 2008Careers Wales undertakes an annual survey of all leavers from maintained schools4 in Wales to obtain
their destinations as at end of October. The results from this survey can be used to provide estimates of NEET rates by UA for 16 year olds. Chart 6 shows the proportion of 2008 Year 11 leavers who were NEET. The definition of NEET used for this survey includes those who are in part-time education. The survey also includes information on whether those recorded as NEET were able to enter employment. Leavers may be unable to enter employment due to sick, pregnancy, custodial etc.
Chart 6: Year 11 leavers who are NEET by Unitary Authority of school, 2008
0 2 4 6 8 10 12
Powys Ceredigion Carmarthenshire Monmouthshire Conwy Gwynedd Swansea Rhondda Cynon Taf Denbighshire Vale of Glamorgan Pembrokeshire Caerphilly Wales Flintshire Neath Port Talbot Merthyr Tydfil Bridgend Isle of Anglesey Wrexham Blaenau Gwent Torfaen Newport Cardiff
Per cent
Chart 7: Year 11 leavers who are NEET and employment entry status, 2008
63.2% 26.5%
10.3%
Summary of data sources
a. NEET SFR series
Description This data is the definitive measure for NEET rates in Wales.
Uses This series should be used as the series for 16-18 year olds NEET in
Wales. It is used to measure progress against the Learning Country: Vision into Action target to increase the percentage of young people in employment, education or training to reach 93 per cent by 2010. Published source WAG Statistical First Release ‘Participation of young people in
education and the labour market’
Primary sources Pupil Level Annual Schools’ Census (WAG)
Lifelong Learning Wales Record (WAG) Student Record (HESA)
Open University
Annual Population Survey (ONS)
End of year estimates of resident population (ONS)
Last period covered End 2007
Last published July 2009
Next published July 2010 (provisional)
b. NEET APS series
Description This series is a rolling year annual estimate of NEET from the Annual
Population Survey.
Uses This series provides more timely data than the annual SFR. It is not
directly comparable with the SFR series. Trends should be considered and not changes between consecutive rolling year estimates.
Published source Annual Population Survey (ONS)
Primary sources Annual Population Survey (ONS)
Last period covered Year end 2009 Q2
Last published APS published Dec 09, NEET APS series published Jan 2010
Next published APS published Mar 10, NEET APS series published Apr 2010
c. NEET Pupil Destinations Survey
Description This series is an annual estimate of the Year 11 leavers (aged 16 ) who are NEET as at October following the end of the academic year.
Uses This series provides Unitary Authority level data. It should only be
used for 16 year olds. It is not directly comparable with the SFR series or the APS series due to differences in definitions.
Published source Destinations of leavers from schools in Wales (Careers Wales) Primary sources Destinations of leavers from schools in Wales (Careers Wales)
Last period covered October 2008
Last published March 2009
Tables
Table 1: Young people not in education, employment or training in Wales, age 16-18
Calendar Year
SFR NEET APS NEET
Per cent Number Per cent
End 1996 12.1 12,800 ..
End 1997 10.6 11,700 ..
End 1998 11.9 13,200 ..
End 1999 11.6 12,800 ..
End 2000 10.7 11,700 ..
End 2001 11.7 13,100 11.8
End 2002 11.8 13,700 11.0
End 2003 12.6 14,900 11.9
End 2004 11.2 13,400 11.9
End 2005 10.2 12,300 12.1
End 2006 9.8 12,000 10.3
End 2007 11.5 14,000 12.1
End 2008 .. .. 12.9
Source: WAG Statistical First Release (SDR 113/09) Participation of Young People in Education and the Labour Market;
[image:8.595.50.467.484.765.2]Annual Local Labour Force Survey for Wales 2001-2003; Annual Population Survey 2004-2008
Table 2: Young people not in education, employment or training in Wales, age 16-18 Annual Population Survey (Rolling Year End)
Year End Per cent Approx 95% Confidence Interval
2005 Q1 12.2 1.5
2005 Q2 13.0 1.6
2005 Q3 11.7 1.5
2005 Q4 12.1 1.6
2006 Q1 11.8 1.6
2006 Q2 10.7 1.6
2006 Q3 11.4 1.6
2006 Q4 10.3 1.5
2007 Q1 10.8 1.6
2007 Q2 11.8 1.6
2007 Q3 12.1 1.6
2007 Q4 12.1 1.6
2008 Q1 11.6 1.6
Table 3: Year 11 Leavers for Schools in Wales known to be not in education, employment or training by Unitary Authority
2004 2005 2006 2007 2008
Wales 7.0 6.8 6.4 6.9 7.1
Isle of Anglesey 4.5 5.8 7.0 6.7 8.1
Gwynedd 6.2 4.6 5.4 4.4 5.7
Conwy 5.6 5.7 7.9 5.5 5.7
Denbighshire 6.3 6.3 6.0 4.9 6.2
Flintshire 5.4 4.9 3.9 4.6 7.2
Wrexham 8.5 7.3 8.1 8.9 9.6
Powys 4.4 4.8 3.0 5.3 3.0
Ceredigion 3.4 3.6 2.2 2.6 3.8
Pembrokeshire 5.2 6.6 3.6 4.7 6.4
Carmarthenshire 5.0 5.7 5.4 5.5 4.4
Swansea 12.2 8.5 8.0 5.8 5.8
Neath Port Talbot 10.6 8.1 7.0 9.0 7.7
Bridgend 6.7 8.2 6.8 7.3 8.0
The Vale of Glamorgan 4.1 6.4 5.2 6.8 6.2
Cardiff 7.4 8.4 8.8 8.5 10.6
Rhondda, Cynon, Taff 6.0 5.0 5.1 7.5 6.1
Merthyr Tydfil 6.4 11.4 7.3 7.9 7.8
Caerphilly 8.1 7.8 6.8 7.1 7.1
Blaenau Gwent 10.3 8.8 8.1 10.4 9.7
Torfaen 6.7 6.9 7.9 10.5 10.1
Monmouthshire 4.0 4.6 4.8 5.6 5.3
Newport 9.2 9.2 9.0 9.3 10.4
Notes on the use of statistical articles
Statistical articles generally relate to one-off analyses for which there are no updates planned, at least in the short-term, and serve to make such analyses available to a wider audience than might otherwise be the case. They are mainly used to publish analyses that are exploratory in some way, for example:
• Introducing a new experimental series of data;
• A partial analysis of an issue which provides a useful starting point for further research but that nevertheless is a useful analysis in its own right;
• Drawing attention to research undertaken by other organisations, either commissioned by the Welsh Assembly Government or otherwise, where it is useful to highlight the conclusions, or to build further upon the research;
• An analysis where the results may not be of as high quality as those in our routine statistical releases and bulletins, but where meaningful conclusions can still be drawn from the results.
Where quality is an issue, this may arise in one or more of the following ways:
• being unable to accurately specify the timeframe used (as can be the case when using an administrative source);
• the quality of the data source or data used; or
• other specified reasons.
However, the level of quality will be such that it does not significantly impact upon the conclusions. For example, the exact timeframe may not be central to the conclusions that can be drawn, or it is the order of magnitude of the results, rather than the exact results, that are of interest to the audience.
The analysis presented does not constitute a National Statistic, but may be based on National Statistics outputs and will nevertheless have been subject to careful consideration and detailed checking before publication. An assessment of the strengths and weaknesses in the analysis will be included in the article, for example comparisons with other sources, along with guidance on how the analysis might be used, and a description of the methodology applied.
Articles are subject to the release practices as defined by the release practices protocol, and so, for example, are published on a pre-announced date in the same way as other statistical outputs. Missing value symbols used in the article follow the standards used in other statistical outputs, as outlined below.
.. The data item is not available
. The data item is not applicable
- The data item is not exactly zero, but estimated as zero or less than half the final digit shown