Proceedings of the SURVEYING & SPATIAL SCIENCES BIENNIAL CONFERENCE 2011 21-25 November 2011, Wellington, New Zealand
A dense surface modelling technique for foot surface imaging
Jasim Ahmed Ali AL-Baghdadi, Albert K. Chong
Faculty of Engineering and Surveying, University of Southern Queensland Toowoomba, QLD. Australia
[email protected], [email protected]
Kevin McDougall1, Duaa Alshadli1, Peter Milburn2, Richard Newsham-West2
1
Faculty of Engineering and Surveying, University of Southern Queensland, Toowoomba, QLD. Australia
2
School of Physiotherapy and Exercise Science, Gold Coast Campus, Griffith University, QLD, Australia
[email protected], [email protected], [email protected],
ABSTRACT
Automated 3D point cloud generation of an object surface from images using a Dense Surface Modelling algorithm is a reliable technique. Recently, this technique has been applied in numerous mapping applications such as the human face, historical building facades, digital archaeological artefact recording and forensic investigation. In this paper, the technique is applied to the mapping of the dorsal and plantar aspect of a human foot during weight-bearing, which is considered a difficult surface for 3D mapping. The purpose of the research is to develop an approach that provides low-cost, high-quality 3D surface models which can be used to study the dynamics of the foot during slow-gait. The objective of this paper is to present the techniques used and the results of this investigation.
The research results show that the total gaps in the generated 3D plantar surface, was less than 0.1 percent. However, these gaps did not reduce the anthropometric mark’s positional measurement accuracy as these marks could be clearly identified in the 3D model. The 3D representation of the dorsal surface of the foot during walking exhibits significantly fewer holes than the plantar surface at about 0.02 percent. All the defined anthropometric landmarks appear clearly on the dorsum of the foot’s 3D surface, thus making digital measurements on the surface an easy task. Light rays coming from the plantar surface must pass through a 12 mm tempered glass and, depending on the camera’s position, some of the light rays suffered refraction and reflection, making the gaps in the plantar surface reconstruction unavoidable. However, the overall accuracy of the developed photogrammetric measurement technique is approximately 0.3mm for all the generated surfaces.
KEYWORDS: human surface texture, 3D surface model, photogrammetry, dorsal and plantar surface
1 INTRODUCTION
just the static dimensions of the foot, and include its shape, flexibility and load during standing, walking gait or running. Accurate 3D modelling of the dorsal and plantar surfaces is one element that may allow researchers to investigate the loading dynamics and flexibility of the foot and guide footwear design. However, capturing accurate, dynamic 3D dorsal and plantar surfaces of the human feet during gait has been a challenge for measurement scientists. The improvement in second generation laser scanning devices is still not a suitable tool for fast gait as these high-speed devices still require a few tenths of a second to complete a scan. During walking gait, the 3D dorsal and plantar surface changes shape rapidly, and thus a fast-rate 3D data capture technique is required. Hawke et al. (2006) states that customised foot orthotics have shown to be more effective at reducing pain and redistributing pressure than standard “off the shelf” orthotics. The authors cite the need for dynamic data of the foot to design customised foot orthotics. Consequently, the capture of 3D dorsal and plantar surface data at slow (walking) gait will provide more benefits than those collected from a stationary foot in the design of footwear and orthotics for general mobility. The aim of the research is to develop an optical imaging technique to capture 3D surface data of the human plantar during low-speed gait.
Currently, digital electronic sensors, optical imaging sensors, flat-bed scanners, and laser scanning devices are available for 3D dorsal and plantar surface capture. Krauss, et al. (2008) investigated sex-related differences in foot morphology using a 3D-footscanner where 847 individual feet were scanned in a static posture. The purpose of their research was to determine whether sex-related differences were significant and thus provide footwear manufacturers with data for designing appropriate shoes for men and women. Tessutti et al. (2008) used a digital electronic sensor to investigate the in-shoe plantar pressure distribution to determine the relationship between chronic injury and surface type during running. Participants ran on two common surfaces: (1) asphalt and (2) natural grass at medium speed. Their investigation found that the type of surface used in running contributed significantly to the greater loads recorded on the rearfoot and forefoot due to differences in surface compliance. The authors concluded that running on grass is likely to cause less injury than running on asphalt over medium and long distance runs. Coudert et al. (2006) developed an anthropometric measurement system which determines the change in foot shape during walking to determine the parameters needed to develop footwear that can adapt its inner volume to foot shape changes. They found that when the forefoot is on the ground, the width of the foot increases by about 5 mm, or about 5%. Zhao et al. (2008) used 3D data of the foot captured by laser scanner to determine girth measurements such as the ball girth, instep girth, waist girth, long heel girth, and short heel girth. These measurements were essential dimensions for the design of personalized footwear. The authors recommended the use of digital 3D feet in footwear manufacturing CAD/CAM systems, thus allowing customized footwear design and manufacturing. Martedi et al. (2009) developed a technique to produce a 3D surface of the plantar using the 2D surface captured by a flatbed scanner. While the authors argued that the error was below 1.0 mm, there were drawbacks such as the generation of accurate sole shape reconstruction. In general, the above-mentioned techniques were not capable of capturing accurate digital 3D surfaces of the dorsal and plantar surface during gait. Therefore, determining the suitability of optical video imaging systems and the photogrammetric technique for obtaining dynamic surface contours of the foot was the objective of this investigation.
2 EQUIPMENT AND SOFTWARE
2.1 Imaging Platform and Synchronising Device
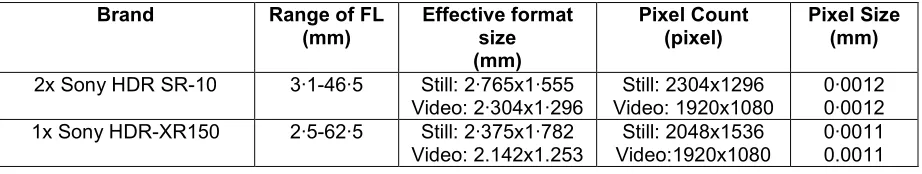
Table 1, Video camera type and imaging sensor specifications.
2.2 Photogrammetric Control
A set of 10 to 30 retro-targets with known coordinates was required for accurate 3D scaling using the photogrammetric technique. The coordinates of these points were determined using a set of 12 convergent (four vertical and four rotated 90° to the left and four rotated at 90° to the right) images taken with a calibrated fix-mount lens camera. The process was repeated three times. A high-precision Invar scale bar was used in the calibration that was calibrated by the manufacturer with a factory-calibration accuracy of ±11 µm at 15° C.
2.3 Photogrammetric Software
Australis® photogrammetric software was used mainly for the self-calibration of the imaging sensors using a bundle adjustment technique which is based on the mathematical equations 1 and 2 below. The software is also suitable for the determination of the high-accuracy retro-target coordinates used in photogrammetric control. In general, the coordinate system of the computed coordinates is based on the geometry of the orientation device used while the scaling is based on the Invar scale-bar used.
∆ ∆ ∆ (1)
∆ ∆∆ (2)
where
∆
∆
: axis-related correction values for imaging errors,∆
∆
: small corrections for perspective centre (Xp, and Yp),∆
: small correction for principal distance,, , : lens distortion parameters,
, : lens decentring parameters,
, : affinity and shear parameters, and
: radial distance.
3D surface models were created using PhotoModeler Scanner® software. The software is capable of scanning image pairs to produce dense point clouds and meshed surfaces using the Dense Surface Modelling (DSM) technique. The software allows the export of point clouds and triangulated meshes in many formats, thus allowing further data-cleaning, data manipulation and analysis.
Brand Range of FL
(mm) Effective format size (mm) Pixel Count (pixel) Pixel Size (mm)
2x Sony HDR SR-10 3·1-46·5 Still: 2·765x1·555
Video: 2·304x1·296
Still: 2304x1296 Video: 1920x1080
0·0012 0·0012
1x Sony HDR-XR150 2·5-62·5 Still: 2·375x1·782
Video: 2.142x1.253
Still: 2048x1536 Video:1920x1080
3 METHODOLOGY
3.1 Camera Calibration and Test-Subject Imaging
The selected high definition (HD) video cameras were calibrated individually using a custom-made camera calibration testfield at an object distance of 1000 mm. This object distance was similar to the gait platform design specifications for imaging the plantar surface. In the calibration, eight sets of convergent video clips of the testfield were captured; individual frames were extracted from the clips; and the frames were processed using Australis® off-the-shelf camera calibration software. Subsequently, the cameras were mounted on the prototype imaging platform which was positioned under the glass-top step-on platform. Spot lights were placed around the platform to ensure the brightness was uniform across the sole of the foot. When the subject was ready to start walking on the step-on platform, the camcorders were started and the LED synchronisation device activated.
Figure1: An extracted image frame showing: 1) image registration target array; 2) the LED synchronization device.
3.2 Skin-Texture Enhancement and Anthropometric Landmark Marking
Tests were carried out to determine the best skin texture enhancement technique for human subjects of varying skin-colours. Test results showed that uniform accuracy of the captured 3D surface of the sole can be attained if the skin was painted with a matte red ‘face and body’ paint, thus creating a uniform matte colour surface. In this investigation an off-the-shelf matte red-colour face and body paint was applied to the subject’s foot. The paint was lightly applied to the sole ensuring no streaks or lumpy appearance and allowed to dry before signalized targets were placed on anthropometric landmarks on the foot. Also, image non-signalised registration marks were placed in the optimal location using black-ink marker pens.
3.3 Gait Method
The test-subject performed a set of slow steps over the glass-top of the step-on platform. In the first activity, the subject stepped on the glass-top and, raised the heel to simulate a gentle step-forward act. In the second activity, the subject placed his foot to the glass-top and gently raised the front of the foot. To minimize error introduced by the disparity of the individual video camera timing error, the LED synchronization device was activated before each task.
3.4 Image Processing in PhotoModeler®
expedite the search for a good match in the subsequent images. This setting was particularly important for this project as human skin surface has weak texture. Once the total error was less than 1.0mm, the orientation was considered satisfactory. As the dorsal and plantar surfaces were smooth, a medium density rate (medium sample rate value) was applied because a high density resulted in wavy and rippled model appearance and a low density resulted in insufficient details on the model.
4 RESULTS AND ANALYSES
4.1 Video Camera Calibration
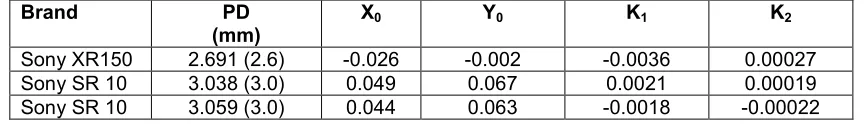
Three video cameras were calibrated in the laboratory and the average of four independent sets of the computed lens parameters is provided in Table 2. The table shows the manufacturer’s stated focal length in brackets and the calibrated principal distance (PD). The Sony XR150 video camera gave the largest variation between the two sets of values while the Sony SR10 had the least variation. Because the differences were approximately +3.5%, +1.2 % and +2.0%, respectively, the approximate scaling error for the three-camera system of +2.2 %, based on the manufacturer’s focal lengths, was adopted in the image processing. In other words, at an object distance of 1000 mm, the computed 3D distance of a 350 mm long human foot would be approximately 8 mm longer if calibration was not carried out. Also, in Table 2, the presented values for parameter K2 were
very small and their contribution to the computed 3D surface error was estimated to be less than 0.05 mm in the real-world dimension. As the radial lens distortion parameter K3, the decentring
distortion parameters and the dynamics fluctuation parameters (Eq. 1 and 2) were less likely to be significant, they were removed in the calibration and not included in Table I. Because the impact of the principal point offset and radial lens parameters (K1) were significant, the video cameras should
[image:5.595.82.514.436.499.2]be calibrated to achieve high-quality photogrammetric measurements.
Table 2. Video camera calibration results
4.2 3D of the Plantar Surface
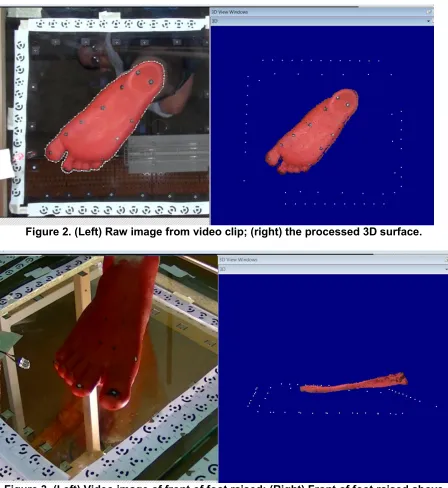
The 3D surfaces generated from the captured images of the plantar surface (left) and the generated 3D surface using the three captured images (right) are presented in Figure 2. The generated 3D surface clearly showed the compressed overlaying fat pad at the heel. The total amount of gaps in the generated 3D surfaces was less than 0.1 percent and did not reduce the anthropometric mark positional measurement as these marks were clearly identifiable. Mapping the individual toes presented a minor problem as the toes were very close together. However, because the plantar surface was the main interest, this problem was considered minor and hence there was no significant drawback in using this mapping technique.Figure 3 shows the 3D surface of the dorsal aspect of the foot being raised above the glass-top platform. The proportion of gaps was significantly less (0.02 percent) than the 3D plantar surface (Fig. 2) due to light rays from the plantar surface passing through a 12 mm tempered glass, and potentially experiencing refraction and/or reflection. In addition, the lighting around the plantar surface created bright and dim spots on the plantar surface of the foot as a result of the glass plate. Figure 4 shows the dorsal surface of the foot when the heel is raised above the glass plate. This 3D surface has the least number of holes as the forward tilt of the foot allowed the light to provide an even brightness of the imaged surface. All the marked anthropometric landmarks appeared clearly on the 3D surface, thus making digital measurements on the surface straightforward.
Brand PD
(mm)
X0 Y0 K1 K2
Sony XR150 2.691 (2.6) -0.026 -0.002 -0.0036 0.00027
Sony SR 10 3.038 (3.0) 0.049 0.067 0.0021 0.00019
Figure 2. (Left) Raw image from video clip; (right) the processed 3D surface.
[image:6.595.88.536.65.553.2] [image:6.595.86.524.67.288.2]Figure 4. (Left): Video image of raised heel; (right) processed 3D surface model
4.3 3D Surface Modelling Accuracy
The 3D distances between signalised-targets were used for accuracy evaluation and were calibrated with a precision of ±0.015 mm. Based on the differences between the calibrated and the measured 3D distances of the 3D surface model, the technique used achieved an accuracy of 0.250 mm, thus confirming the high-quality of the computed 3D surface model.
5 BENEFITS AND DRAWBACKS OF THE DSM PHOTOGRAMMETRIC TECHNIQUE
It is apparent that there are a number of benefits and drawbacks in the developed photogrammetric technique for the generation of a 3D surface model. The benefits include:
1. Dynamic characteristics of the dorsal/plantar surface can be mapped at 25 (SECAM/PAL) or 30 (NTSC) Hz which is sufficient for 3D recording of plantar motion during walking gait, 2. Image capture using standard video cameras has few restrictions; are easy to operate, and
video clips can be processed easily.
3. The overall achievable accuracy of the generated 3D surface of the dorsal/plantar surface is approximately 0.3 mm,
4. Low cost video cameras (approximately $US 200) are suitable for the application,
5. The camera mounting platform, a simple glass-top step-on platform and the photogrammetric control can be fabricated relatively cheaply, and
6. In general, little or no regular maintenance is required.
The drawbacks are:
1. Face and body paint is required to obtain suitable images of different skin-colours,,
2. A small percentage of holes may appear in the generated 3D surface, particularly along the edges, unless the captured images include the side of the foot,
3. The technique is not suitable for individual toe mapping,
4. The system as presented here is suitable for walking gait only as the video frame-rate is low.
5. High definition video cameras are essential for good quality imaging, and
6 CONCLUSION
The objective of the research was to develop a low-cost, high-quality 3D surface model which could be used to study the dynamics of the plantar surface of the foot during walking gait. A three video camera mounting platform, a glass-top step-on platform and a set of photogrammetric targets were constructed and used for imaging and the captured images were processed using PhotoModeler® Scanner.
The total proportion of gaps in the generated surface of the plantar surface of the human foot was approximately 0.08 percent. However, these holes did not reduce the anthropometric mark positional measurement as these marks could be clearly identified. However, individual toe mapping presented a minor problem as the toes were close together and difficult to map individually. The 3D surface of the dorsal surface of the foot showed significantly less holes than the plantar surface (0.02 percent) due to light not having to pass through a 12 mm tempered glass and experiencing light refraction and/or reflection. All the anthropometric landmarks appeared clearly on the dorsum of the foot’s 3D surface thus making digital measurements on the surface convenient. The overall accuracy of the developed optical measurement technique was approximately 0.3 mm.
The results show that the developed technique using off-the-shelf HD video cameras is suitable for the 3D surface mapping of the plantar and dorsal surfaces of the foot. This information provides a unique insight into the dynamic characteristics of the foot during gait which can be incorporated into the design of footwear and orthotics.
REFERENCES
Coudert T., Vacher P., Smits, C., Van der Zande, M., 2006. A method to obtain 3D foot shape deformation during the gait cycle, Ninth International Symposium on the 3D Analaysis of Human Movement, June 28-30. Valenciennes, Frances,
http://www.univ-valenciennes.fr/congres/3D2006/Abstracts/117-Coudert.pdf
Hawke, F., Burns, J., Radford, J.A., du Toit, V., 2008. Custom-made foot orthotics for the treatment of foot pain. Cochrane Database Systematic Reviews, 16(3): CD006801
Kraussa, I., Graua, S., Mauchb, M., Maiwaldc, C., Horstmannd, T. 2008. Sex-related differences in foot shape. Ergonomics, 51(11): 1693-1709.
Martedi, S, Saito, H., 2009. Shape measurement system of foot sole surface from flatbed scanner image. MVA2009 IAPR, Conference on Machine Vision Applications, 20-22nd June. Keio, Japan [http://www.hvrl.ics.keio.ac.jp/paper/pdf/MVA2009_sandy.pdf].
Tessutti, V., Trombini-Souza, F., Ribeiro, A. P., Nunes, A. L., Neves Sacco, I.N., 2010. In-shoe plantar pressure distribution during running on natural grass and asphalt in recreational runners. Journal of Science and Medicine in Sport. 13: 151–155.