Authors: Dhriti Mandalia, Katharine Sadler, Tim Vizard, Tamsin Ford, Anna Goodman, Robert Goodman, Sally McManus
Responsible Statistician: Dan Collinson, Community and Mental Health
Published 22 November 2018
This topic report presents the prevalence of behavioural disorders in 5 to 19
year olds in England and the characteristics of children and young people with
a behavioural disorder. The Development and Well-Being Assessment
(DAWBA) tool
was used to assess for a range of behavioural (or ‘conduct’)
disorders.
About one in twenty (4.6%) 5 to 19 year olds had a behavioural disorder.
Rates were higher in boys (5.8%) than girls (3.4%). Oppositional defiant
disorder was the most common type, present in 2.9% of children.
6.7
7.4
1.0
5.8
3.2
5.0
0.5
3.4
5 to 10 11 to 16 17 to 19 5 to 19 5 to 10 11 to 16 17 to 19 5 to 19 Per cent
Any behavioural disorder by age and sex, 2017
Source: NHS Digital
Base: 5 to 19 year olds
Boys Girls
Age group
Mental Health of Children and Young
People in England, 2017
Main findings
Prevalence of behavioural disorders
About one in twenty (4.6%) 5 to 19 year olds had a behavioural disorder. Rates were higher in boys (5.8%) than girls (3.4%). 5 to 16 year olds were more likely to be identified with a behavioural disorder than those aged 17 to 19.
Oppositional defiant disorder (ODD) was the most common type of behavioural
disorder, present in 2.9% of 5 to 19 year olds. Other types all had a prevalence of less than one child in a hundred.
Characteristics of 5 to 19 year olds with a behavioural disorder
• Demographics: Alongside variation by age and sex, the prevalence of behavioural disorders varied between ethnic groups. Rates were highest in White British
children (5.7%) and lowest in those who were Black/Black British (0.7%) or Asian/Asian British (0.8%).
• Educational needs:About one in four (23.1%) children with a recognised special educational need had a behavioural disorder. The survey did not establish whether the special educational need related to the disorder, but it is possible this was often the case.
• Health and family: Children with poor general health and those living with a parent with poor mental health or a parent in receipt of disability-related benefits were more likely to have a behavioural disorder than other children. Behavioural disorders were also more common among children living in households with less healthy family functioning.
Contents
Main findings 2
Acknowledgements 5
Introduction 6
Background 7
Terminology 8
Prevalence of behavioural disorders 9
Behavioural disorders by age and sex 9
Specific behavioural disorders by age and sex 9
Children with a behavioural disorder 10
Behavioural disorders by ethnic group 10
Behavioural disorders by special educational needs 11
Behavioural disorders by child’s general health 12
Behavioural disorders by parent’s mental health 13
Behavioural disorders by family functioning 14
Behavioural disorders by household income 15
Behavioural disorders by benefits 16
Behavioural disorders by neighbourhood deprivation 17
Behavioural disorders by region 18
Trends in behavioural disorders in 5 to 15 year olds, 1999-2017 18
Discussion 19
Methods 21
Definitions 23
This report may be of interest to people working with children and young people in mental health, social care or educational settings, as well as to policy officials, commissioners of health and care services, and parents, young people and the general public. The prevalence of behavioural disorders in 5 to 19 year olds and a profile of the children and young people most likely to be affected, are presented.
This is an Official Statistics publication
This document is published by NHS Digital, part of the Government Statistical Service.
All official statistics should comply with the UK Statistics Authority’s Code of Practice for Official Statistics which promotes the
production and dissemination of official statistics that inform decision making.
Find out more about the Code of Practice for Official Statistics at
Acknowledgements
First of all, we thank all the children, young people, parents and teachers who so generously gave their time to participate in this survey.
Running a national survey relies on the expertise of many people. We thank the professional and committed interviewers, operations department, computing, statistical, and survey and data management staff based at the National Centre for Social Research (NatCen) and the Office for National Statistics (ONS).
In NatCen, we would like to thank Franziska Marcheselli, Si Ning Yeoh, Laura Brown, Nikki Leftly, Helen Henderson, Emma Fenn, Susan Corbett, Matt Jonas, Sally Bridges, Rachel Craig, Richard Boreham and Gillian Prior.
In the ONS, this survey would not have taken place without the work of Ellie Brodie, Nicola Pearce, Nick Forbes, Jodie Davis, Charlotte Guinee, Steve Maurice, Simon Robinson, Mark Rowland, Adam White, Alexandra Pop, Salah Merad and Dean Fletcher.
We are also indebted to team of ONS and NatCen interviewers who spent countless hours interviewing participants who took part in this survey.
Clinical raters undertook the enormous task of reviewing information on all the children and young people who took part. From the University of Exeter College of Medicine and Health these included Carmen Apostu, Pamela Bowman, Tamsin Newlove-Delgado, Oana Mitrofan and Eva Wooding. From Kings College London: Sophie Epstein, Andrew McWilliams, Helena Hamilton, Christine Kuhn. Thanks to Bruce Clark and the Body Dysmorphic Disorder team from South London and Maudsley Hospital for independently rating the BDD diagnoses.
The survey benefited from an expert steering group, we would like to thank Miranda Wolpert, Peter Fonagy, Catherine Newsome, Lucy Heyes, Helen Duncan, Jessica Sharp, David Lockwood, Jeremy Clark, Alexandra Lazaro and Nilum Patel.
NHS Digital commissioned the survey series with funding from the Department of Health and Social Care. We are particularly grateful to Dan Collinson, Alison Neave, Steven Webster, Jane Town, Ben Osborne and Kate Croft for their thoughtful
Introduction
Major surveys of the mental health of children and young people in England were carried out in 1999 (Meltzer et al., 2000), 2004 (Green et al., 2005), and 2017. The latest survey was funded by the Department of Health and Social Care, commissioned by NHS Digital, and carried out by the National Centre for Social Research, the Office for National Statistics and Youthinmind.
In each of the three surveys, the Development and Well-Being Assessment (DAWBA) was administered to a stratified probability sample of children and young people and their parents and teachers (Goodman et al., 2000). Cases were reviewed by clinically-trained raters. While many surveys use brief tools to screen for nonspecific psychiatric distress or dissatisfaction, this series applied rigorous, detailed and consistent
methods to assess for a range of different types of disorder according to International Classification of Disease (ICD-10) diagnostic criteria (WHO, 1992). Comparable data is available for 5 to 15 year olds living in England in 1999, 2004, and 2017. In keeping with broadening definitions of adolescence (Sawyer et al., 2018), the 2017 sample was the first in the series to include 17 to 19 year olds, as well as 2 to 4 year olds. Behavioural (or conduct) disorders were one of the types of child mental health conditions assessed on the survey. Information on the prevalence of behavioural disorders in 2 to 4 year olds can be found in the Preschool Children topic report.
This topic report examines the:
• Prevalence of any behavioural disorder and of specific types of behavioural disorder in 5 to 19 year olds, by age and sex.
• Health, social, and economic characteristics of children and young people with a behavioural disorder, compared to those without.
As well as a Summary Report, a series of other topic reports are available focusing on:
• Trends and characteristics • Emotional disorders
• Hyperactivity disorders
• Autism spectrum, eating and other less common disorders • Predictors of mental disorders (to be released at a later date) • Multiple conditions and wellbeing
• Professional services, informal support, and education • Behaviours, lifestyles, and identities
• Preschool children.
Background
Behavioural disorders are the most common reason for referral of children and young people to child and adolescent mental health services (CAMHS) (National Institute for Health and Clinical Excellence, NICE 2013). The long term societal costs of severe behavioural problems are estimated to be in the region of £260,000 per child
(Parsonage et al., 2014). The NICE guidelines (2013) outline early intervention strategies as preventative measures in alleviating the damaging effects conduct disorders could have in later life.
Behavioural disorders are generally only diagnosed in children and young people.
They are characterised by repetitive and persistent patterns of disruptive and
antisocial behaviour in which the rights of others and social norms or rules are violated (Pisano et al., 2017). Their presence in childhood is required for certain adult
psychiatric diagnoses, such as antisocial personality disorder.
Different subcategories of behavioural disorder were examined in the survey. Typical symptoms vary by disorder type. While some of these symptoms may be present in many children, to count as a disorder they have to be sufficiently severe to cause distress to the child or impair their functioning:
• Oppositional defiant disorder (ODD): is characterised by temper outbursts, arguing with adults, disobedience, deliberately annoying others, passing on blame, being easily annoyed, resentful, spiteful and vindictive. The behaviour is severe and frequent enough to have caused complaints from parents and teachers. It is one of the most common clinical diagnoses in children and adolescents (Theule et al., 2016). Prevalence estimates around the world vary, and include 6.5% of
adolescents aged 13 to 18 years in the United States (Merikangas et al., 2010).
Unsocialised and socialised conduct disorders have been found to be less common than ODD in other studies with, for example, an estimated prevalence among 13 to 18 year olds in the United States of 2.2%. Their behavioural symptoms are considered more severe than ODD (Merikangas et al., 2010). Typical behaviour includes telling lies, fighting, bullying, staying out late, running away from home, playing truant, being cruel to people or animals, and criminal behaviour such as robbery, rape, and using weapons. This type of behaviour would often have resulted in complaints from school staff or contact with the police, although there is an unusual form of this disorder where challenging behaviour is only manifest in the home environment (conduct disorder confined to the family).
• Socialised conduct disorder: the young person has friends (though usually
antisocial friends). They may engage in antisocial behaviours such as shoplifting or stealing cars together
A diagnosis of conduct disorder may follow a prior diagnosis of ODD (American Psychiatric Association, 2013). Conduct disorder and ODD in childhood has been found to predict the subsequent development of antisocial personality disorder, substance-related disorders, mood and anxiety disorders, and higher accident rates in adulthood (Theule et al., 2016). Conduct disorder and ODD are often comorbid with attention-deficit/hyperactivity disorder (ADHD) (Loeber et al., 2000). For examination of comorbidity, see the Multiple Conditions and Wellbeing topic report.
Terminology
In this report, the words ‘children’, ‘boys’, and ‘girls’ are used, even when 17 to 19 year olds are included in the group. This is to avoid the text becoming cumbersome.
Prevalence of behavioural disorders
Behavioural disorders by age and sex
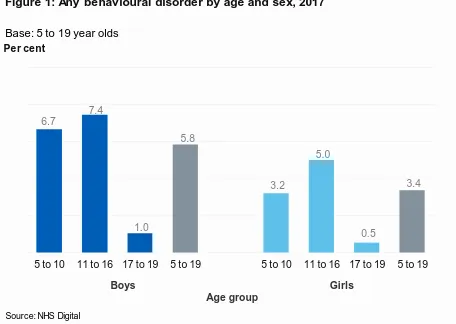
About one in twenty (4.6%) 5 to 19 year olds were identified with a behavioural
disorder. It is likely that if all children in the population had participated, the proportion identified with a behavioural disorder would have been between 4.1% and 5.2%. This range is referred to as the 95% confidence interval (CI). If the sample had been drawn twenty times, for nineteen of those we would expect the estimate to be in this range.1
Behavioural disorders were more common in boys (5.8%) than girls (3.4%). Rates varied by age group, and were higher in children aged 5 to 10 (5.0%) and 11 to 16 (6.2%) than in 17 to 19 year olds (0.8%). (Figure 1; Table 1)
Specific behavioural disorders by age and sex
Of the different types of behavioural disorder assessed, ODD (characterised by
temper outbursts and arguing with adults) was the most common. ODD was present in 2.9% of 5 to 19 year olds, and was more common in boys (3.6%) than girls (2.2%).
1 See the Methods section of this report and the Survey Design and Methods Report for further
confidence interval information for the estimates presented in this report. 6.7
7.4
1.0
5.8
3.2
5.0
0.5
3.4
[image:9.595.70.526.273.597.2]5 to 10 11 to 16 17 to 19 5 to 19 5 to 10 11 to 16 17 to 19 5 to 19 Per cent
Figure 1: Any behavioural disorder by age and sex, 2017
Source: NHS Digital
Base: 5 to 19 year olds
Boys Girls
All the other types of behavioural disorder identified were less prevalent than ODD. Socialised conduct disorder (0.7%), unsocialised conduct disorder (0.4%), conduct disorder confined to the family (0.1%), and other types of conduct disorder (0.5%): each had a prevalence of less than one child in a hundred. Due to sample size limitations prevalence estimates for these disorders are likely to be imprecise.
In general, the different types of behavioural disorder tended to be more common in children aged 5 to 16 than in those aged 17 to 19. (Table 1)
Children and young people with a behavioural disorder
The prevalence of any behavioural disorder was examined by a range of different social, economic, and health-related characteristics, to produce a profile of children and young people affected.
Behavioural disorders by ethnic group
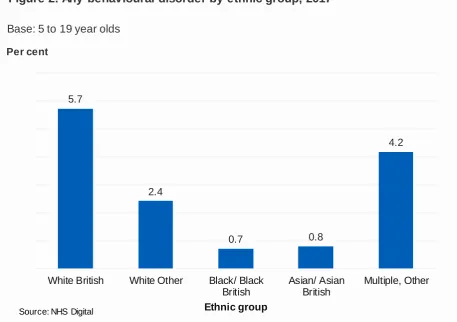
The prevalence of behavioural disorders in 5 to 19 year olds varied between ethnic groups. Rates were highest in White British children (5.7%) and lowest in those who were Black/Black British (0.7%) or Asian/Asian British (0.8%). (Figure 2; Table 2). The pattern of association between ethnic group and behavioural disorder was similar for boys and girls.
5.7
2.4
0.7 0.8
4.2
White British White Other Black/ Black British
Asian/ Asian British
Multiple, Other Per cent
[image:10.595.70.528.440.762.2]Ethnic group
Figure 2: Any behavioural disorder by ethnic group, 2017
Source: NHS Digital
Behavioural disorders by special educational needs
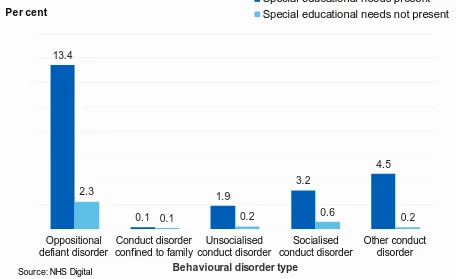
Nearly one in four (23.1%) children with a recognised special educational need had a behavioural disorder, compared with one in thirty (3.3%) children without a special educational need. 13.4% of children with special educational needs were identified with ODD; 3.2% with socialised conduct disorder; 1.9% with unsocialised conduct disorder; 0.1% with conduct disorder confined to the family; and 4.5% with another conduct disorder. (Figure 3; Table 3)
The survey did not establish whether the special educational needs that were recognised related directly to the disorder itself, but it is likely that this would sometimes have been the case. The kinds of disorders that can make it harder to cope in a school environment, like behavioural disorders, may be particularly likely to be recognised as special educational needs.
13.4
0.1
1.9
3.2
4.5
2.3
0.1 0.2 0.6 0.2
Oppositional defiant disorder
Conduct disorder confined to family
Unsocialised conduct disorder
Socialised conduct disorder
Other conduct disorder Per cent
Behavioural disorder type
Figure 3: Behavioural disorders by special educational needs, 2017
Special educational needs present Special educational needs not present
Source: NHS Digital
[image:11.595.71.527.259.538.2]Behavioural disorders by child’s general health
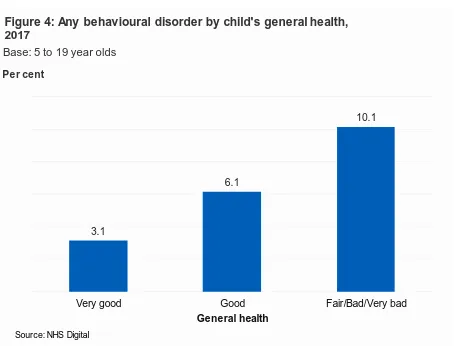
There was a relationship between children’s general health and whether they had a behavioural disorder. One in ten (10.1%) children with fair, bad or very bad general health had a behavioural disorder, compared with 3.1% of those with very good general health. The pattern of association was similar for boys and girls. (Figure 4)
This pattern was also evident among children with ODD (6.0% of those with fair, bad or very bad general health compared with 2.2% of those in very good general health). Similar differences were evident for socialised and unsocialised conduct disorders, and for other conduct disorders. (Table 4)
It should be noted that when children, young people and their parents assessed general health they are likely to have considered both the child’s mental health and their physical health.
3.1
6.1
10.1
Very good Good Fair/Bad/Very bad
Per cent
[image:12.595.74.528.237.583.2]General health
Figure 4: Any behavioural disorder by child's general health, 2017
Source: NHS Digital
Behavioural disorders by parent’s mental health
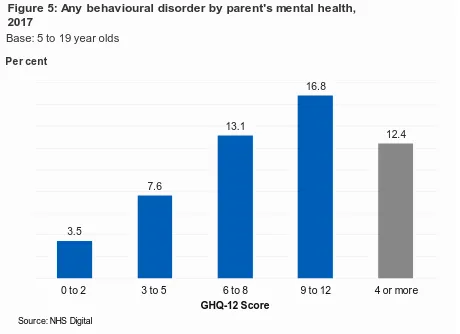
Parental mental health, as assessed by the General Health Questionnaire (GHQ-12), was associated with whether a child had a behavioural disorder. Scores range from 0 (no psychological distress) to 12 (severe psychological distress). A score of 4 or more is indicative of the presence of a common mental disorder like anxiety or depression. Children whose parents had a high GHQ-12 score (9 to 12) were more likely to meet the criteria for a behavioural disorder than children whose parents had a low GHQ-12 score (0 to 2) (16.8% and 3.5% respectively). (Figure 5)
A similar pattern was observed for some of the specific behavioural disorders. For example, parental mental illness was associated with higher rates of ODD in children. 9.3% of children with a parent scoring 9 to 12 on the GHQ-12 had ODD compared with 2.4% of children with a score of 0 to 2. (Table 5)
3.5
7.6
13.1
16.8
12.4
0 to 2 3 to 5 6 to 8 9 to 12 4 or more
Per cent
[image:13.595.71.531.314.648.2]GHQ-12 Score
Figure 5: Any behavioural disorder by parent's mental health, 2017
Source: NHS Digital
Behavioural disorders by family functioning
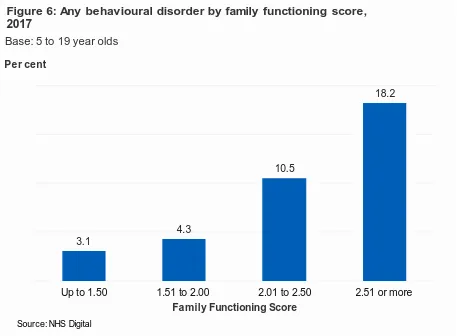
Behavioural disorders were more prevalent in 5 to 19 year olds living in families with unhealthy family functioning (as indicated by a family function score of 2.01 or more). The rates of behavioural disorder ranged from 3.1% of children living in families with the healthiest functioning (a score of up to 1.50) to 18.2% of children living in families with the least healthy functioning (a score of 2.51 or more). (Figure 6)
This pattern was also seen for some of the specific behavioural disorders, such as ODD. (Table 6)
As a cross-sectional survey, these associations cannot explain causality. While problems with family functioning or poor parental mental health may contribute to the onset of behavioural disorders, the presence of behavioural disorders could also lead to problems with family functioning and lead to deterioration in parental mental health.
See the Definitions section at the end of this topic report for details of how family functioning was assessed.
3.1
4.3
10.5
18.2
Up to 1.50 1.51 to 2.00 2.01 to 2.50 2.51 or more Per cent
[image:14.595.72.529.232.568.2]Family Functioning Score
Figure 6: Any behavioural disorder by family functioning score, 2017
Source: NHS Digital
Behavioural disorders by household income
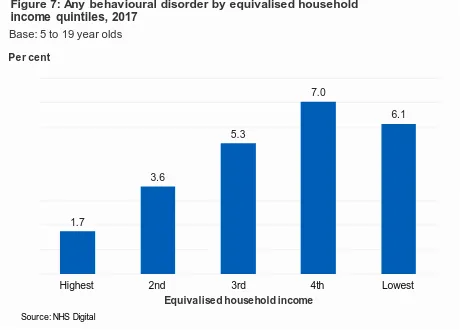
Equivalised household income was associated with the presence of a behavioural disorder. 6.1% of children in the lowest income quintile had a behavioural disorder, compared with 1.7% of children in the highest income households.2 (Figure 7)
This pattern was evident in some of the specific behavioural disorders. For example, ODD was present in 3.6% of children living in households in the lowest income
quintile, and 1.0% of children in the highest quintile. A similar association with income was present for socialised conduct disorder and other conduct disorders. (Table 7)
2 Although the rate for the fourth income quintile appears to be higher than that for t he fifth (lowest)
quintile, this was not significantly different. 1.7
3.6
5.3
7.0
6.1
Highest 2nd 3rd 4th Lowest
Per cent
[image:15.595.68.528.239.573.2]Equivalised household income
Figure 7: Any behavioural disorder by equivalised household income quintiles, 2017
Source: NHS Digital
Behavioural disorders by benefits
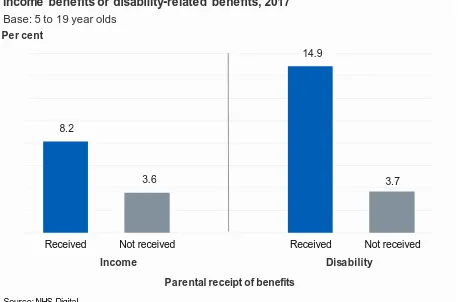
The rate of behavioural disorder was higher in children whose parents received a low income benefit (8.2%) compared with children whose parents did not (3.6%). (Figure 8)
Among specific types of behavioural disorder, this pattern was also evident. For
example, 5.0% of children living with a parent in receipt of income-related benefits had ODD, compared with 2.4% of children without such a parent.
Similarly, 14.9% of children living with a parent in receipt of disability benefits had a behavioural disorder, compared with 3.7% of children whose parents did not receive such benefits. (Figure 8)
A related pattern was observed for specific types of behavioural disorder. For example, the prevalence of ODD in children with a parent who received disability benefits was 9.3%, compared with 2.4% of other children. This pattern was also evident for unsocialised conduct disorder, socialised conduct disorder, and other conduct disorder. (Table 8)
8.2
3.6
14.9
3.7
Received Not received Received Not received
[image:16.595.72.530.396.698.2]Per cent
Figure 8: Any behavioural disorder by parental receipt of low-income benefits or disability-related benefits, 2017
Source: NHS Digital
Base: 5 to 19 year olds
Income Disability
Behavioural disorders by neighbourhood deprivation
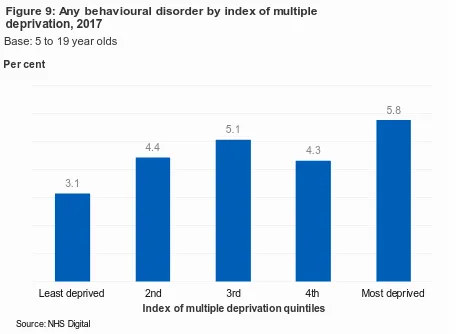
The prevalence of behavioural disorders was associated with neighbourhood-level deprivation. 5.8% of children living in the most deprived index of multiple deprivation (IMD) quintile had a behavioural disorder, compared with 3.1% of children living in the least deprived quintile. (Figure 9)
The prevalence of socialised conduct disorder was also associated with
neighbourhood deprivation and was highest in the most deprived quintile (1.2%) and lowest in the least deprived quintile (0.3%). No significant variations were observed for the other specific types of behavioural disorder. (Table 9)
3.1
4.4
5.1
4.3
5.8
Least deprived 2nd 3rd 4th Most deprived
Per cent
[image:17.595.73.531.248.582.2]Index of multiple deprivation quintiles
Figure 9: Any behavioural disorder by index of multiple deprivation, 2017
Source: NHS Digital
Behavioural disorders by region
The proportion of children with a behavioural disorder varied with region. Rates were lowest in London (1.7%) and highest in the East of England (6.5%). This pattern was also evident for rates of ODD, which ranged from 1.0% in London to 4.9% in the East of England. (Figure 10; Table 10)
Trends in behavioural disorders in 5 to 15 year olds,
1999-2017
The prevalence of any behavioural disorder in 5 to 15 year olds remained stable over time. This stability was evident both in boys and girls; and in younger (5 to 10 year olds) and older age groups (11 to 15 year olds).
For further information about trends in behavioural disorders see the Trends and Characteristics topic report.
5.4
5.3
5.4
5.1
4.2
6.5
1.7
4.5
5.7
North East
North West
Yorkshire & the Humber
East Midlands
West Midlands
East of England
London
South East
[image:18.595.70.525.175.610.2]South West
Figure 10: Any behavioural disorder, by region
Source: NHSDigital
Base: 5 to 19 year olds
Discussion
Behavioural disorders have long been regarded as the most common form of mental health problem in childhood (Theule et al., 2016). That may no longer be the case, given that the prevalence of emotional disorders and behavioural disorders are now similar in 5 to 15 year olds in England. This equalising, however, stems more from an increase in emotional disorder prevalence rather than a reduction in behavioural disorder.
Over the last decade there have been falls among children in the prevalence of several types of antisocial and illicit behaviour. This includes declining rates of smoking (NHS Digital, 2017a), alcohol consumption (NHS Digital, 2017b), and
violence (Youth Justice Statistics, 2015/16). Children now spend more time in school and more time with their parents (Nuffield Trust, 2014). Some of these changes in behaviour have been more evident in boys than girls, and provide an interesting context for understanding trends in behavioural disorder.
Certain groups of children are more likely than others to have a behavioural disorder. Boys remain more likely than girls, and rates peaked in 11 to 16 year olds and were lowest in those aged 17 to 19. Caution, however, is needed with interpretation of the tail off in rates in this older age group. A diagnosis of behavioural disorder ideally needs evidence of impairment in different settings: and valid reports of this are easier to achieve with parent and/or teacher reports. Teacher reports were not obtained for any 17 to 19 year olds on the survey, and about half of 17 to 19 year olds did not have a responding parent. Given non-compliance is an aspect of behavioural disorder, it is likely that survey non-response will also be higher in this group. Another feature of this analysis also impacts on the ability to compare 5 to 16 year old participants with those aged 17 to 19: prevalence in the younger group was uprated with a small adjustment factor (1.06) that took account of the fact that some in this age group did not have a teacher report. Adjustment factors – their rationale, calculation, and impact – are discussed more fully in the Survey Design and Methods Report.
Behavioural disorder rates varied with socioeconomic context. Children living in the lowest income households were three times more likely than the most affluent children to have a behavioural disorder. Higher rates were also found for those living in the most deprived neighbourhoods. These patterns were evident too in the previous survey.
The previous survey also found behavioural disorders to be linked with ethnicity, and more prevalent in White British children than in those who were Asian/Asian British. The current survey, however, now finds that children who are Black/Black British also have lower rates of behavioural disorder than their White British counterparts. Given differences in the ethnicity of populations in different areas, this may be a factor in the lower rate of behavioural disorders for London as a whole.
are also more likely to live with parents’ who have poor mental health, and who receive disability-related benefits. Almost two-fifths of children in families that do not function healthily met the criteria for a behavioural disorder, as did a quarter of children with recognised special educational needs.
The information presented in this report allows us to build a detailed picture of children with behavioural disorders and better understand the complex interrelationships
Methods
The Mental Health of Children and Young People (MHCYP) survey was conducted with 5 to 15 year olds living in Britain in 1999 and 5 to 16 year olds living in Britain in 2004. The 1999 and 2004 surveys sampled from Child Benefit records. For the 2017 survey a stratified multistage random probability sample of 18,029 children was drawn from NHS Patient Register in October 2016. Children and young people were eligible to take part if they were aged 2 to 19, lived in England, and were registered with a GP. Children, young people and their parents were interviewed face-to-face at home using a combination of Computer Assisted Personal Interview (CAPI) and Computer
Assisted Self Interview (CASI), between January and October 2017. A short paper or online questionnaire was completed by a nominated teacher for children aged 5 to 16 years old. Data collection varied with the selected child’s age:
• 2 to 4 year olds: parent interview
• 5 to 10 year olds: parent interview and teacher interview
• 11 to 16 year olds: parent interview, child interview and teacher interview
• 17 to 19 year olds: young person interview and parent interview (if parent present at the same address)
Prevalence estimates for 5 to 16 year olds were adjusted slightly upwards with a factor designed to take account of the fact that only some of this age group had data from teachers. See the Survey Design and Methods Report for detail about the calculation and application of adjustment factors.
Productive interviews (involving one or more participants in each household) were achieved for 9,117 children (1,463 2 to 4 year olds; 3,597 5 to 10 year olds; 3,121 11 to 16 year olds; 936 17 to 19 year olds), and 3,595 teachers (54% of eligible children). The survey included the detailed and comprehensive Development and Well-Being Assessment (DAWBA). This allowed the assessment of emotional, hyperkinetic, behavioural and less common disorders, like autism. After interviews were complete, eleven trained clinical raters reviewed the data to reach disorder codings for each participant. Raters applied the diagnostic criteria for specific disorders set out in the tenth International Classification of Disease (ICD-10) (WHO 1992) and the Diagnostic and Statistical Manual of Mental Disorders (DSM–5) (APA 2013).
The 2017 survey was designed to be comparable with the 1999 and 2004 surveys. This included the continued use of the DAWBA, use of ICD-10, and consistent timing of data collection. However, some differences in design have taken place which may affect comparability with previous survey results, including that the 2017 survey:
• Sampled from the NHS Patient Register, whereas the 2004 and 1999 surveys sampled from Child Benefit records
• Included 2 to 4 and 17 to 19 year olds for the first time
• Covered England, while previous surveys in the series covered Britain. Analyses of 1999 and 2004 data presented in this report have been run on participants aged 5 to 15 years old living in England only to maintain comparability in trends.
The 2017 interviews and analyses are based on participants’ age at 31 August 2017, with participants grouped with their peers in terms of school year.
Differences in data collection and analysis should be considered when comparing results between age groups, as these may affect comparability.
Confidence intervals
Information about confidence intervals are presented in the text and described as the range for which a value is likely to fall within had the whole population participated in this survey rather than a sample. This range was calculated based on 95% confidence interval and indicates the range we would expect estimates to fall within nineteen times in twenty, if the study was repeated with new samples.
Definitions
Mental disorder
Mental disorders were identified on the survey according to the standardised diagnostic criteria in the tenth edition of the International Classification of Diseases (ICD-10). Specific mental disorders were grouped into four broad categories:
emotional, behavioural, hyperactivity and other less common disorders. While some of the symptoms covered in this report may be present in many children, to count as a disorder they had to be sufficiently severe to cause distress to the child or impair their functioning (WHO, 1993).
Figure 11: Disorders included and excluded in trend measures Any mental disorder
Disorder categories
Emotional disorders Hyperactivity
disorders Behavioural (or ‘conduct’) disorders Other less common disorders Disorder subgroups
Anxiety disorders Depressive disorders Bipolar affective disorder Specific disorders (included in trend measures) Separation anxiety disorder Generalised anxiety disorder Obsessive compulsive disorder Specific phobia Social phobia Agoraphobia Panic disorder Post-traumatic stress disorder Other anxiety Major depressive episode Other depressive episode Hyperkinetic disorder Other hyperactivity disorder Oppositional defiant disorder Conduct disorder confined to family Unsocialised conduct disorder Socialised conduct disorder Other conduct disorder Autism spectrum disorder Eating disorder Tics Selective mutism Psychosis Specific disorders (added since 1999, so excluded from trend measures) Body dysmorphic disorder
(added in 2017)1
Bipolar affective disorder Mania (Both added in 2004) Attachment disorder (added in 2004) Feeding disorder Sleep disorder Eliminating disorder (all added in 2017)
1 Body dysmorphic disorder was assessed using the Diagnostic and Statistical Manual of
Trend measures
Trends over time are based on samples, methods, and disorders that are as
comparable as possible. The 1999 and 2004 samples have been reanalysed based on participants resident in England only, and the 2004 and 2017 samples are restricted to those aged 5 to 15 for these analyses. For each survey only those interviewed in English are retained. Some disorders (such as attachment disorder and body
dysmorphic disorder) were only included after the 1999 survey had been completed. To ensure estimates are comparable across surveys these additional disorders were not included in the 2017 trend measures. See the Survey Design and Methods Report for details.
Behavioural (conduct) disorders
A group of disorders characterised by repetitive and persistent patterns of disruptive and violent behaviour in which the rights of others, and social norms or rules, are violated. The umbrella term used in ICD 10 is conduct disorders, in this report we have used the term ‘behavioural disorders’ to avoid confusion with the sub-types of disorder included in the survey.
Oppositional defiant disorder (ODD)
Oppositional defiant disorder (ODD) is more common among younger children, partly because of the types of behaviour involved. ODD is characterised by temper
outbursts, arguing with adults, disobedience, deliberately annoying others, passing on blame, being easily annoyed, resentful, spiteful and vindictive.
Conduct disorder confined to family
In this condition, the challenging behaviour is entirely, or almost entirely, confined to the home and to interactions with members of the immediate family or household.
Unsocialised conduct disorder
A behavioural disorder characterised by the combination of persistent dissocial or aggressive behaviour with significant pervasive abnormalities in the individual's relationships with other children, such that they have no friends.
Socialised conduct disorder
Disorder involving persistent dissocial or aggressive behaviour occurring in individuals who are generally well integrated into their peer group.
Other conduct disorders
Analysis variables
Ethnic group
Ethnic group was self-reported directly by children and young people aged 11 or more, and by parents for children aged 10 or under.
Special educational needs
Presence of special educational needs was based on information provided by the interviewed parent for children aged 2 to 16 and for young people aged 17 to 19.
Child’s general health
Young people aged 17 and over rated their own general health. For children aged 16 and under the interviewed parent rated their child's general health.
Parental mental health
The mental health of the interviewed parent or guardian (usually the mother), was assessed using the GHQ-12. Scores range from 0 (no psychological distress) to 12 (severe psychological distress). A score of 4 or more has been used to indicate the presence of a common mental disorder.
Family functioning
Family functioning was measured using the General Functioning Scale of the
McMaster Family Activity Device (FAD). It comprises 12 statements that parent’s rate on a four point scale. A score was derived. A score above 2 was considered to
indicate ‘unhealthy’ family functioning.
Equivalised household income
An estimate of overall household income was established by means of a showcard, and was adjusted to reflect the number and ages of people living in the household. For further details please refer to the Survey Design and Methods Report.
Welfare benefits
A household was classified as in receipt of 'low income benefits' if any resident adult with parental responsibility for the child reported being in receipt of any of the
following: Housing Benefit, Working Tax Credit, Income Support, Universal Credit (UC), Job Seekers' Allowance, or Pension Credit. Child Tax Credit did not count as the eligible income threshold for this is higher. While UC could be received for disability-related reasons this was not distinguishable in the data collected.
Neighbourhood deprivation
The Index of Multiple Deprivation (IMD) 2015 combines a number of indicators, chosen to cover a range of economic, social and housing issues, into a single deprivation score for each small area (or as described here neighbourhoods) in
England. This allows each neighbourhood to be ranked relative to others according to their level of deprivation. In this report quintiles of IMD are used to give an area-level measure of socioeconomic status, as opposed to a household-level measure. For further details about IMD please refer to the Survey Design and Methods Report.
Region
References
American Psychiatric Association. (2013) Diagnostic and statistical manual of mental disorders (5th ed.). Arlington, American Psychiatric Publishing.
Green H, Maginnity A, Meltzer H et al. (2005) Mental health of children and young people in Great Britain. London, TSO. https://digital.nhs.uk/catalogue/PUB06116
Goodman R, Ford T, Richards H et al. The Development and Well-Being Assessment: description and initial validation of an integrated assessment of child and adolescent
psychopathology. The Journal of Child Psychology and Psychiatry, 2000; 41(5): pp. 645-655.
Huaqing Qi C & Kaiser AP. Behavior problems of preschool children from low income families: Review of the literature. Topics in Early Childhood Special Education, 2003; 23(4): pp. 188-216.
Kim-Cohen J, Caspi A, Moffitt TE et al. Prior Juvenile diagnoses in adults with mental
disorder: development follow back of a prospective-longitudinal cohort. Arch Gen Psychiatry,
2003; 60(7); pp709-17.
Loeber R, Burke JD, Lahey BB, et al. Oppositional defiant and conduct disorder: a review of the past 10 years, part 1. Journal of the American Academy of Child and Adolescent
Psychiatry, 2000; 39: pp. 1468–1484.
Meltzer H, Gatward R, Goodman R et al. (2000) The mental health of children and adolescents in Great Britain. London, The Stationery Office.
http://www.dawba.info/abstracts/B-CAMHS99_original_survey_report.pdf
Merikangas KR, He J, Burstein M et al. Lifetime prevalence of mental disorders in U.S. adolescents: results from the National Comorbidity Study-Adolescent Supplement (NCS-A).
Journal of the American Academy of Child and Adolescent Psychiatry, 2010; 49: pp. 980–989.
NatCen Social Research & UCL. (2017). ‘Children’s health’ in The Health Survey for England 2016. Leeds, NHS Digital. https://files.digital.nhs.uk/publication/m/c/hse2016-child-health.pdf
National Institute for Health and Care Excellence. (2013). Antisocial behaviour and conduct disorders in children and young people: recognition and management: March, 2013.
www.nice.org.uk/guidance/cg158
NHS Digital. (2017a) Smoking, drinking and drug use among young people, England 2016. Leeds, NHS Digital. https://files.digital.nhs.uk/07/49FE46/sdd-2016-rep-cor.pdf
NHS Digital. (2017b) Health Survey for England 2016. Leeds, NHS Digital.
https://digital.nhs.uk/data-and-information/publications/statistical/health-survey-for-england/health-survey-for-england-2016
Parsonage M, Khan L, Saunders A. (2014). Building a better future: the lifetime costs of childhood behavioural problems and the benefits of early intervention. Centre for Mental Health.
Sawyer SM, Azzopardi PS, Wickremarathne D, et al. The Age of Adolescence. The Lancet: Child and Adolescent Health, 2018; 2(3): pp. 223-228.
Theule J, Germain SM, Cheung K, et al. Conduct Disorder/Oppositional Defiant Disorder and Attachment: A Meta-Analysis. Journal of Developmental and Life-Course Criminology, 2016; 2(2): pp. 232-255. https://link.springer.com/article/10.1007/s40865-016-0031-8
World Health Organization. (1992). International statistical classification of diseases and related health problems: tenth revision.
www.who.int/classifications/apps/icd/icd10online/?gf10.htm+f10
Youth Justice Board/Ministry of Justice Statistics Bulletin. (2017). Youth Justice Statistics,
2015/16: England and Wales.
www.digital.nhs.uk
0300 303 5678
enquiries@nhsdigital.nhs.uk
@nhsdigital
This publication may be requested
in large print or other formats.
Published by NHS Digital, part of the Government Statistical Service
Copyright © 2018 Health and Social Care Information Centre.
The Health and Social Care Information Centre is a non-departmental body created by statute, also known as NHS Digital.
You may re-use this document/publication (not including logos)
free of charge in any format or medium, under the terms of the Open Government Licence v3.0.
To view this licence visit
www.nationalarchives.gov.uk/doc/open-government-licence
or write to the Information Policy Team, The National Archives, Kew, Richmond, Surrey, TW9 4DU;