July 2001 : graduate salaries and vacancies : half-yearly review
36
0
0
Full text
(2) AGR, established in 1968, consists of organisations which recruit and employ graduates or which offer services in connection with graduate recruitment. We represent those providing a high proportion of graduate vacancies in the UK and we are increasingly involved with research in and around recruitment needs of employers. Mission Statement ‘To support employers in all aspects of the recruitment of graduates to meet their current and future business needs.’ Objectives AGR will achieve its mission by: ! providing expertise, information and advice to enhance employers’ effectiveness in recruiting graduates ! providing a forum for discussion by employers, of issues relevant to graduate recruitment ! promoting and disseminating best practice in all aspects of graduate recruitment and the transition from education to employment ! encouraging, supporting and initiating research into education, career choice and employment ! representing the views of employers to policy makers, careers services and other practitioners, the media and the general public ! providing informed choice and guidance about graduate recruitment to all concerned ! working with education generally and higher education in particular on relevant matters.. AGR The Innovation Centre Warwick Technology Park Gallows Hill Warwick CV34 6UW Tel: 01926 623236 Fax: 01926 623237 E-mail: info@agr.org.uk Website: www.agr.org.uk. The Institute for Employment Studies (IES), is an independent, apolitical, international centre of research and consultancy in human resource issues. It works closely with employers in the manufacturing, service and public sectors, government departments, agencies, professional and employee bodies, and foundations. For over 30 years the Institute has been a focus of knowledge and practical experience in employment and training policy, the operation of labour markets and human resource planning and development. IES is a not-for-profit organisation which has a multidisciplinary staff of over 50. IES expertise is available to all organisations through research, consultancy, publications and the Internet. IES aims to help bring about sustainable improvements in employment policy and human resource management. IES achieves this by increasing the understanding and improving the practice of key decision makers in policy bodies and employing organisations..
(3) Contents. Contents. 1. Executive Summary. 1. 1. Introduction. 5. 1.1. 6. 2. Starting Salaries 2.1 2.2 2.3. 3. 4. Sample. London Weighting Allowance Salaries Joining payments and incentives. 8 8 8 11. Vacancies. 12. 3.1. 13. Shortfall – anticipated. Selection and Recruitment. 15. 4.1 4.2. 15 16. The recruitment cycle Techniques and issues. 5. Recruitment Difficulties. 19. 6. Retention and Salary Progression. 21. 6.1 6.2 6.3. 21 21 22. Retention Loyalty bonuses Salary progression. Appendix A: Survey Respondents. 24. Appendix B: Questionnaire. 29.
(4)
(5) Executive Summary. This latest Half-Yearly Review, produced by the Institute for Employment Studies (IES) continues to present key benchmark data according to the same two subgroups introduced twelve months ago: ! industry – main business activity ! sector – industrial group. This report offers information regarding salaries for the recruitment years commencing October 1999-2000 and 2000-2001, together with members’ predictions for 2001-2002. The report also provides vacancy data for the recruitment year 1999/2000 and anticipated vacancies for 2000/2001. Two hundred and seven members responded to this latest AGR survey, which is an encouraging five per cent more than the previous survey conducted six months ago. The overall findings suggest that members currently have confidence in the graduate labour market. Newly qualified graduates should also be encouraged, as the number of vacancies and salaries on offer continue to rise.. Starting salaries ! Salaries ranged from £10,000 to £32,000, with a median salary of £18,000 in the recruitment year 1999/2000. Just ten per cent of members were paying their new graduate intake over £23,000. ! In the recruitment year 2000/2001, typical starting salaries on offer ranged from £10,900 to £36,000, with a median salary of £19,000. This was slightly higher than the £18,600 predicted by members earlier this year via the previous survey – only ten per cent offered more than £25,000. ! Members anticipate salaries for new first degree graduates in the recruitment year 2001/2002 to range between £14,500 to £38,000, with a median of £19,800 – just ten per cent are planning to start their intake on more than £26,000. ! Typical starting salaries for a newly qualified first-degree graduate continue to rise. Salaries typically rose by 5.5 per cent between 1999/2000 and 2000/2001 and are expected to rise by a further 4.1 per cent during 2000/2001 and 2001/2002. These statistics have been calculated on those organisations that supplied data for each recruitment year. ! Graduate salaries rose by almost three times the current (1.8 per cent) rate of inflation between 1999/2000 and 2000/2001, and slightly ahead of average GB earnings (5.1 per cent in March 2001). ! Legal firms continue and expect to pay the highest salaries.. Joining payments and incentives ! The trend to offer ‘golden hellos’ or some form of signing-on payment continues. Twentyeight per cent of members in this survey offered a joining payment, the Financial and Legal. AGR ❚ 1.
(6) Sector being more likely to offer such incentives. Payments ranged from £500 to £10,000 although members typically paid signing-on fees of £1,500.. Vacancies ! The total number of vacancies on offer are predicted to rise from 14,681 in 1999/2000 to an anticipated total of 17,890 vacancies in 2000/01. ! Vacancies are predicted to increase by 14.6 per cent overall – which is very similar to the predictions of those members responding to the survey at this same point in time last year. This statistic is based on those members who provided data for both years. ! The anticipated growth in vacancies is not uniform across all organisations. Some 21 per cent of responding organisations were intending to reduce their graduate intake, and a further 35 per cent of employers were not planning to increase it. ! Largest increases are expected to be offered by the larger companies, and the Electronic and Electrical Engineering, and Transport and Communications firms anticipate a growth of at least fifty per cent. ! Further analysis of vacancy data provided for both years shows that the apparent buoyancy in the graduate labour market may be restricted to certain industries – with just a couple of organisations from the Electronic and Electrical Engineering, and Transport and Communications industries aiming to expand their recruitment greatly.. Shortfall – anticipated ! Fewer members anticipate a shortfall in 2000/2001 compared with members responding to the surveys in recent years – a total of 588 vacancies. Just 18 per cent of members in this survey expect shortfalls in 2000/2001, although a quarter were still uncertain. ! Electronic and Electrical Engineering companies expect to suffer the worst – with over 20 per cent of vacancies likely to be unfilled.. Selection and recruitment ! ‘Evaluating at assessment centres’ was (as last year) considered to be the most useful recruitment technique and ‘Using recruitment agencies’ to be the least useful. ! The Internet continues to be considered a very valuable tool for members and almost all members (95 per cent) use the Internet to describe/advertise vacancies – with small organisations rating the Internet to be of most use. ! Members also believe they can reach a wider pool of applicants via the Internet – both in and outside the UK.. Recruitment difficulties ! The ‘war for talent’ continues and areas still proving difficult for members to recruit into are Engineering, IT and Computing. ! HR/Personnel remains the least difficult area to recruit into.. 2 ❚ AGR.
(7) Retention and salary progression ! The Service Sector appears to have overall better longer-term retention rates – although Manufacturing, Production and Industrial companies appear to be retaining their intake for longer during their very early years. ! Offering ‘golden handcuffs’ as a retention measure is not common practice. Just seven members offer loyalty bonuses, typically of around £2,000. This suggests that although 28 per cent of members used ‘golden hellos’ to attract talent, they may not believe financial incentives to have the same influence or effect as a retention tool.. Salary progression ! Graduates recruited by members five years ago typically earn £7,500 more than their counterparts recruited a year ago, and the overall growth in salaries is around 65 per cent over the five years. ! The highest salaries paid and expected salary growth continue to be offered within the Financial and Legal firms. However, the retention rates for this same sector were no better than others in the longer term – reinforcing the view that salaries are not the only determining factor in choice of employer.. AGR ❚ 3.
(8) 4 ❚ AGR.
(9) 1 Introduction. The Institute for Employment Studies (IES) has conducted the biannual Graduate Salaries and Vacancies surveys for AGR since 1985. During the past year the structure of the reports and questionnaires have been reviewed and revised in order that they may continue meeting the needs of the AGR membership. This latest Half-Yearly Review reflects these changes and continues to present benchmark data according to either the organisation’s main business activity (industry), as disclosed by responding members, or, where appropriate, sector. To maintain confidentiality, it has not been possible to present information for the Insurance and Accountancy firms each as a single category. Responses were too few in number: nine Accountancy firms and seven Insurance companies responded to this current survey and their responses have been combined to form a larger single group as they share very similar salary characteristics. In addition, only eight organisations from the Food, Drink and Tobacco industry responded to this survey. Their responses have been combined with those responding from Other Manufacturing firms as they shared a very similar salary profile. The remainder of the statistics presented throughout this report continue to allow the AGR membership the freedom and flexibility to benchmark themselves in a meaningful way according to their own particular industries. Sector 1 – Financial and Legal. (total number = 60). ! Banking and Finance. (N = 27). ! Insurance and Accountancy. (N = 16). ! Legal Services. (N = 17). Sector 2 – Services (excluding financial and legal). (total number = 71). ! Retail, Hotels and Catering. (N = 12). ! Other Business Services (inc. Software/IT and ! Consultancy Services). (N = 29). ! Transport and Communications. (N = 15). ! Public Services. (N = 15). Sector 3 – Manufacturing, Production and Industrial. (total number = 76). ! Energy and Water industries. (N = 12). ! Chemical and Allied (inc. Pharmaceutical), Mineral and Ore industries. (N = 12). ! Engineering and Construction. (N =21). ! Electronic and Electrical Engineering (inc. Telecommunications). (N = 10). ! Other Manufacturing including Food, Drink and Tobacco. (N = 21). AGR ❚ 5.
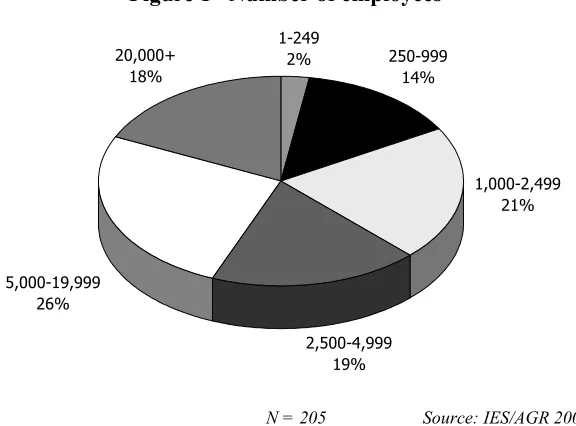
(10) This latest report offers information regarding salaries for the recruitment years October 1999/2000 and 2000/2001, together with members’ predictions for 2001/2002. The Half-Yearly Review also provides vacancy data for the recruitment year 1999/2000 and anticipated vacancies for 2000/2001. However, caution should be taken when interpreting statistics cited at a subgroup level, due to small numbers representing some industries.. 1.1 Sample In the middle of March 2001, IES mailed 376 questionnaires to AGR members, (see Appendix B for a copy of the questionnaire). The survey closed on 25 May 2001, following two reminders; 207 usable responses were received and included in the analysis, representing a good response rate of 55 per cent. Maintaining a good response rate is critical to providing members with reliable benchmark data. Although the response rate to this current survey is slightly lower (three per cent) than this time last year, it is encouraging to note that it is higher (five per cent) than the previous survey conducted six months ago. Figure 1 shows the profile of respondents according to the total number of staff employed by the organisation. As the figure clearly shows, few respondents were organisations employing under 250 staff. Figure 1 Number of employees 20,000+ 18%. 1-249 2%. 250-999 14%. 1,000-2,499 21%. 5,000-19,999 26% 2,500-4,999 19%. N = 205. Source: IES/AGR 2001 Half Yearly Review. Appendix A has become a key feature of the revised reporting structure and shows the identity of those AGR members who agreed to be named according to their industry, together with median starting salaries. In addition, IES telephoned and spoke with 20 graduate recruiters in order to understand the quantitative survey data further, and to add context to the survey findings. We would like to thank all the AGR members who responded to the survey, and especially those who found the additional time to speak with the IES via the telephone. The remaining chapters of the report are as follows: ! Chapter 2 – Starting salaries – offers key benchmark data regarding the starting salaries paid to new recruits in 1999/2000 and 2000/2001, together with anticipated salaries and incentives for 2001/2002. ! Chapter 3 – Vacancies – details numerical information related to the volume of vacancies on offer for the 1999/2000 recruitment year and those anticipated in 2000/2001, together with anticipated shortfalls.. 6 ❚ AGR.
(11) ! Chapter 4 – Selection and Recruitment – draws together the take-up and respondents’ views regarding the value of various techniques and practices. ! Chapter 5 – Recruitment difficulties – identifies the extent and nature of those vacancies that members are finding more difficult to fill in certain career areas. ! Chapter 6 – Retention and salary progression – provides insight into the retention rates and current salaries for the graduate recruited by members in 1994/1995, 1996/1997 and 1998/1999.. AGR ❚ 7.
(12) 2 Starting Salaries. Graduates are influenced by a range of factors in their choice of employer, with financial and non-financial ‘offers’ both playing an important part in their decision-making process. In addition to securing a good starting salary, many graduates seek an employment proposition that maximises their career and personal developmental opportunities, future earnings potential, and an offer of a good benefits package. Employers are also aware of the influence that their company and employer brand may have in the graduate’s choice of employer. However, employers remain mindful that their remuneration package needs to be competitive to attract the talent they need., Their interest in benchmarking the starting salaries offered to newly qualified graduates therefore remains high. This chapter reports key benchmark data about starting salaries and London Weighting Allowances salaries members paid to new recruits in 1999/2000 and 2000/2001 and those anticipated in 2001/2002.. 2.1 London Weighting Allowance Overall, a London Weighting Allowance was offered by 26 per cent of organisations, with Financial and Legal firms being more likely to offer the largest allowances – reflecting their freedom and ability to attract talent into London and to offer financial incentives to offset the higher cost of living. ! In the recruitment year 1999/2000, allowances typically ranged from £1,000 to £20,200 – with just over half offering £2,700 or less. ! In the recruitment year 2000/2001, allowances typically ranged from £763 to £20,920 – with just over half offering £3,300 or less. ! Looking ahead, members anticipate allowances to range from £1,200 to £21,500 in the forthcoming recruitment year 2001/2002 – with just over half expecting to offer £3,000 or less. As in previous AGR reports, London Weighting Allowance has been excluded from all subsequent analysis and reporting of salaries, as it is not directly relevant to the majority of responding employers.. 2.2 Salaries It must be borne in mind, however, that bonuses, performance pay and share schemes form part of ‘earnings’ but not basic salaries. The data presented here may therefore mask more significant increases in earnings for new graduates, as some employers shift the balance between basic pay and variable elements of remuneration. As in previous AGR reports, the median value will be used to describe salaries throughout this report, as extreme salaries, both high and low can be misleading and distort the overall average salary. As in previous years, graduate salaries continue to rise and outstrip inflation. ! In the recruitment year 1999/2000, typical starting salaries for new first-degree graduates ranged from £10,000 to £32,000 with a median salary of £18,000.. 8 ❚ AGR.
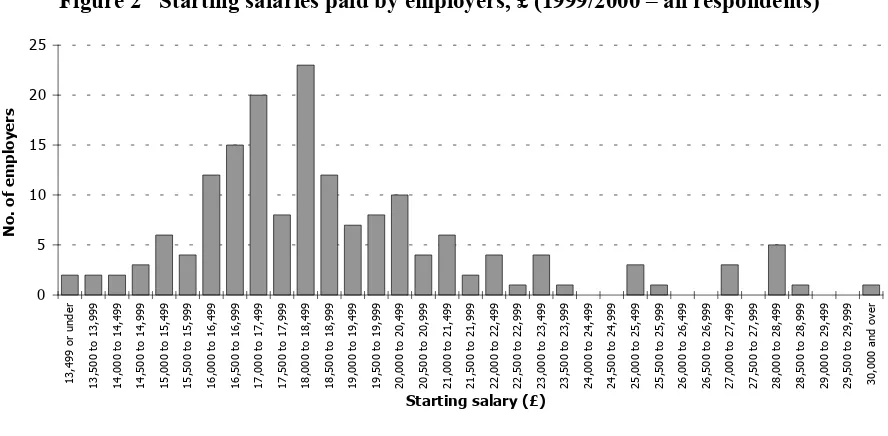
(13) ! In the recruitment year 2000/2001, typical starting salaries for new first degree graduates range from £10,900 to £36,000 with a median salary of £19,000 – which was slightly higher than the £18,600 predicted by members earlier this year via the previous survey. ! Salaries for new first-degree graduates are anticipated to range between £14,500 to £38,000, with a median of £19,800 in the recruitment year 2001/2002. ! Just ten per cent of employers paid their new graduate intake over £23,000 in 1999/2000. ! Only ten per cent offered more than £25,000 in 2000/2001 and just ten per cent plan to start their 2001/2002 graduate intake on more than £26,000. Figures 2, 3 and 4 show the range of starting salaries paid by employers – but do not take into account the number of graduates employed by each organisation each year.. Figure 2 Starting salaries paid by employers, £ (1999/2000 – all respondents) 25. 15 10. 30,000 and over. 29,500 to 29,999. 29,000 to 29,499. 28,500 to 28,999. 28,000 to 28,499. 27,500 to 27,999. 27,000 to 27,499. 26,500 to 26,999. 26,000 to 26,499. 25,500 to 25,999. 25,000 to 25,499. 24,500 to 24,999. 24,000 to 24,499. 23,500 to 23,999. 23,000 to 23,499. 22,500 to 22,999. 22,000 to 22,499. 21,500 to 21,999. 21,000 to 21,499. 20,500 to 20,999. 20,000 to 20,499. 19,500 to 19,999. 19,000 to 19,499. 18,500 to 18,999. 18,000 to 18,499. 17,500 to 17,999. 17,000 to 17,499. 16,500 to 16,999. 16,000 to 16,499. 15,500 to 15,999. 15,000 to 15,499. 14,500 to 14,999. 13,499 or under. 0. 14,000 to 14,499. 5. 13,500 to 13,999. No. of employers. 20. Starting salary (£). NB: Salaries exclude London Weighting Allowance. N = 170. Source: IES/AGR 2001 Half Yearly Review. Figure 3 Starting salaries on offer by employers, £ (2000/2001 – all respondents) 25. 15 10. 30,000 and over. 29,500 to 29,999. 29,000 to 29,499. 28,500 to 28,999. 28,000 to 28,499. 27,500 to 27,999. 27,000 to 27,499. 26,500 to 26,999. 26,000 to 26,499. 25,500 to 25,999. 25,000 to 25,499. 24,500 to 24,999. 24,000 to 24,499. 23,500 to 23,999. 23,000 to 23,499. 22,500 to 22,999. 22,000 to 22,499. 21,500 to 21,999. 21,000 to 21,499. 20,500 to 20,999. 20,000 to 20,499. 19,500 to 19,999. 19,000 to 19,499. 18,500 to 18,999. 18,000 to 18,499. 17,500 to 17,999. 17,000 to 17,499. 16,500 to 16,999. 16,000 to 16,499. 15,500 to 15,999. 15,000 to 15,499. 14,500 to 14,999. 13,499 or under. 0. 14,000 to 14,499. 5. 13,500 to 13,999. No. of employers. 20. Starting salary (£). NB: Salaries exclude London Weighting Allowance. N = 182. Source: IES/AGR 2001 Half Yearly Review. AGR ❚ 9.
(14) Figure 4 Anticipated starting salaries by employers, £ (2001/2002 – all respondents). 20 15 10. 30,000 and over. 29,500 to 29,999. 29,000 to 29,499. 28,500 to 28,999. 28,000 to 28,499. 27,500 to 27,999. 27,000 to 27,499. 26,500 to 26,999. 26,000 to 26,499. 25,500 to 25,999. 25,000 to 25,499. 24,500 to 24,999. 24,000 to 24,499. 23,500 to 23,999. 23,000 to 23,499. 22,500 to 22,999. 22,000 to 22,499. 21,500 to 21,999. 21,000 to 21,499. 20,500 to 20,999. 20,000 to 20,499. 19,500 to 19,999. 19,000 to 19,499. 18,500 to 18,999. 18,000 to 18,499. 17,500 to 17,999. 17,000 to 17,499. 16,500 to 16,999. 16,000 to 16,499. 15,500 to 15,999. 0. 15,000 to 15,499. 5. 14,500 to 14,999. No. of employer. 25. Starting salary (£). NB: Salaries exclude London Weighting Allowance. N = 137. Source: IES/AGR 2001 Half Yearly Review. Further analysis of these salary data shows: ! Of the 166 organisations that were able to supply data for 1999/2000 and 2000/2001, salaries typically rose by 5.5 per cent, compared with the 3.3 per cent predicted by members six months ago. ! Graduate salaries rose by almost three times the current (1.8 per cent) rate of inflation between 1999/2000 and 2000/2001, and slightly ahead of average GB earnings (5.1 per cent in March 2001). ! Members anticipate a further increase of 4.1 per cent between 2000/2001 and 2001/2002, based on the 134 organisations supplying data for both years. ! Variation was found according to industry (see Appendix A for further details) and as in previous years, those responding from the Legal firms have paid, and expect to continue paying, the highest starting salaries. Unfortunately, not all respondents provided information regarding the salaries for each of the three years and therefore caution must be taken when interpreting the proportionate increases from figures 2 to 4. Table 1 offers an alternative view of these salary data, but is based upon the. Table 1 Median starting salaries 1999/2000, 2000/2001 and 2001/2002, by sector Broad industrial group. N. Salary paid 99/00. Salary offered 00/01. % increase 99/00–00/01. Anticipated salary 01/02. % increase 00/01–01/02. Financial and Legal. 28. 18,000. 21,000. 16.7. 22,250. 6.0. Services (excluding financial and legal). 42. 18,000. 19,000. 5.5. 19,500. 2.6. Manufacturing, Production and Industrial. 51. 18,000. 18,859. 4.7. 19,425. 3.0. Total. 121. 18,000. 19,000. 5.5. 19,800. 4.2. NB: Salaries exclude London Weighting Allowance. 10 ❚ AGR. Source: IES/AGR 2001 Half Yearly Review.
(15) responses from those members who provided data for all three years. However, as they were fewer in number, their responses have been grouped according to sector to form a robust group. Several organisations in Banking and Finance accounted for the large leap in salaries in the Finance and Legal industrial group.. 2.3 Joining payments and incentives Employers offer a range of incentives to attract talent to their organisations. This time last year, almost a quarter of members reported using ‘golden hellos’ or some form of signing on payment with a further eight per cent planning to do so. This trend continues as 28 per cent of members responding to this survey reported offering some form of joining payment or incentive. Payments ranged from £500 to £10,000 although members typically paid signing-on fees of £1,500. Further analysis of these data showed that the Financial and Legal Sector were more likely than the other two sectors to offer such incentives (see Figure 5). Figure 5 Offers joining payments/incentives, by sector Financial & Legal Services (exc. Financial & Legal) Manufacturing, Production & Industrial All Organisations 0%. 5%. 10%. 15%. N = 204. 20%. 25%. 30%. 35%. Source: IES/AGR 2001 Half Yearly Review. AGR ❚ 11.
(16) 3 Vacancies. This AGR survey provides key benchmark data regarding the volume of vacancies members had on offer for the recruitment year 1999/2000. As members received the questionnaire in the closing stages of the 2000/2001 recruitment year, they were also asked to estimate their vacancies and shortfalls for 2000/2001. ! Overall, respondents to this current survey reported that the total number of vacancies rose from 14,681 in 1999/2000, to an anticipated total of 17,890 vacancies in 2000/2001. ! Those organisations who provided vacancy figures for both years, predict an increase of 14.6 per cent overall – which was very similar to members responding to the survey at this time last year. ! For 2000/2001, over one-third (37 per cent) of all vacancies were offered by just nine of the 194 members responding to this survey – representing a total of 6,731 vacancies. Sixteen employers, each recruiting over 250 graduates were responsible for over half of all vacancies offered, and as expected, the larger the organisation, the larger the intake anticipated for 2000/2001. However, the anticipated growth in vacancies is not uniform across all organisations. ! Some 21 per cent of responding organisations were intending to reduce their graduate intake, and a further 35 per cent of employers were not planning to increase it.. Table 2 Year on year change in vacancies, by industry Industry. No. of vacancies Anticipated vacancies overall (1999/2000) next year (2000/2001). % change. N. Energy & Water. 364. 422. 15.9. 11. Chemical & Allied, Mineral & Ore. 131. 132. 0.8. 9. Engineering & Construction. 960. 1,203. 25.3. 20. Electronic & Electrical Engineering. 588. 920. 56.5. 8. Other Manufacturing inc. Food, Drink & Tobacco. 474. 468. -1.3. 19. Retail, Hotels & Catering. 559. 622. 11.3. 10. Transport and Communications. 1,029. 1,540. 49.7. 13. Banking & Finance. 1,785. 2,301. 28.9. 25. Insurance and Accountancy. 3,045. 3,309. 8.7. 14. 762. 793. 4.1. 17. Other Business Services. 1,988. 2,318. 16.6. 25. Public Services. 2,846. 2,620. -7.9. 13. Legal Services. Source: IES/AGR 2001 Half-Yearly Review. 12 ❚ AGR.
(17) ! Forty-four per cent of organisations are planning to increase graduate opportunities. Although most predicted a relatively modest growth in vacancy numbers, there is a handful of recruiters spread across all industrial groups aiming for large increases in their intakes for 2000/2001. For example, 14 organisations planned to at least double their intakes – between them, these 14 recruiters are offering an extra 1,382 opportunities in 2000/2001. Further analysis of these vacancy data reveal some interesting variations at a sub group level – according to respondents’ industry, as Table 2 shows. These statistics have been calculated for those respondents who provided data for both years. Again, the data show that the buoyancy in the graduate labour market may be restricted to certain industries. Although it is interesting to note that the Electronic and Electrical Engineering, and Transport and Communications industries anticipate a growth of at least fifty per cent, these figures are skewed by just a small number of organisations aiming to expand their recruitment considerably.. 3.1 Shortfall – anticipated In the closing weeks of the 2000/2001 recruitment year, just 18 per cent of members anticipated a shortfall for the year, whereas over half of members responding to the previous two surveys expected or experienced a shortfall for 2000/2001 and 1999/2000. Bearing in mind that members responding to the AGR surveys may differ at different points in time, it is, however, striking that far fewer employers in this latest survey are expecting a shortfall than in recent years.. Figure 6 Proportion of unfilled vacancies, by industry (2000/2001 recruitment year) Energy & Water Industries N = 11 Chemical & Allied, Minerals & Ore Industries N = 10 Engineering & Construction N = 21 Electronic & Electrical Eng (inc. Telecomms) N = 8 Other Manuf. (inc. Food, Drink & Tobacco) N = 21 Retail, Hotels & Catering N = 10 Transport & Communications N = 13 Banking & Finance N = 27 Insurance & Accountancy N = 14 Legal Services N = 17 Other Bus Svces (inc. Software/IT & Consult.) N = 28 Public Services N = 12 0%. 10%. 20%. 30%. 40%. 50%. 60%. Unfilled vacancies. N = 192. 70%. 80%. 90% 100%. Filled vacancies. Source: IES/AGR 2001 Half Yearly Review. AGR ❚ 13.
(18) However, there is still a high level of uncertainty regarding the success of the 2000/2001 recruitment round – one quarter of responding organisations still could not say whether they would experience a shortfall or not. Interestingly, when asked the same question about the 2000/2001 recruitment round (at the start of the recruitment year), 29 per cent could not predict if they would be hit by a shortfall. This suggests that for some, recruitment outcomes remain uncertain until very late in the recruitment year. Even among recruiters who expected a shortfall, the predicted shortfalls were relatively small – half of those affected estimated that the shortfall would be in the order of eight vacancies or fewer. Although all industries expected some degree of shortfall, closer examination of all data shows: ! those expecting the greatest shortfalls in 2000/2001 are Electronic and Electrical Engineering (see Figure 6), although we cannot be sure whether some organisations are in the process of ‘catching up’ from previous years or anticipate expansion. ! the total number of unfilled vacancies is estimated to be 588 among all respondents.. 14 ❚ AGR.
(19) 4 Selection and Recruitment. Although business needs change, and vary within and between sectors, employers need effective recruitment strategies and processes to ensure that they continue to attract and retain both the quality and quantity of graduates their organisations need. This chapter summarises the information respondents gave regarding the various aspects of their selection and recruitment processes – together with their views regarding the take-up and value of different techniques.. 4.1. The recruitment cycle. Figure 7 shows that over half (57 per cent) of members recruit their graduate intake at one fixed entry point per year, and a quarter (24 per cent) continue to recruit throughout the year. This is a very similar pattern to those who responded to the previous 2000 Half-Yearly review, conducted twelve months ago. In addition companies in: ! Electronic and Electrical Engineering ! Transport and Communications ! Other Business Services – including Software/IT and Consultancy were most likely to recruit graduates throughout the year. It interesting to note that last year, Engineering and Construction firms were also more likely than others to recruit graduates throughout the year, and were also known to be offering attractive packages to attract graduates. This year, over half of Engineering and Construction firms responding to the current survey report having a fixed single entry point for their intake. This might suggest that they are benefiting from the packages they have on offer and are confident that they can recruit for the full year ahead. However attractive, convenient or economic running with just one campaign might Figure 7 Graduate recruitment cycle, all respondents Other 8% Continuous cycle 24%. Yearly cycle 57%. Six monthly cycle 11%. N = 206. Source: IES/AGR 2001 Half Yearly Review. AGR ❚ 15.
(20) appear, employers are mindful of the risk and potential consequences that reducing their resourcing flexibility may have on the business.. 4.2 Techniques and issues A key element of the Half-Yearly Reviews concerns reporting respondents’ experiences and their attitudes towards the various selection and recruitment activities. Table 3 summarises the information. As in previous reports, the far right of the table shows the average scores awarded by respondents with direct experience of each technique, on a scale ranging from one to seven (one being counter-productive and seven being extremely useful). ‘Evaluating at assessment centres’ was (as last year) considered to be the most useful recruitment technique and ‘Using recruitment agencies’ to be the least useful. Further analysis of these data showed: ! Views towards the value of using assessment centres did not vary according to industry, sector or size of organisation. ! The valuable role that the Internet now plays in the recruitment process is reflected in the finding that it was the most frequently used technique and almost all members (95 per cent) used the Internet to describe/advertise vacancies. It is also interesting to note that ‘Receiving completed application forms from the Internet’ and ‘Using the Internet to describe and advertise vacancies’ were also voted the second and third most useful techniques. In addition, employers believe they have benefited from being able to ‘cast their net in a much wider pool’ as they now receive a range of applications via the Internet – from both, within and outside the UK. ! Small organisations – those employing under 250 staff – found the Internet to be of most use. Interestingly they also found ‘specifying specific competencies’, ‘specifying shortlisting criteria in adverts’, ‘outsourcing part or the whole process’ and ‘using recruitment agencies’ more useful than others. This may be a result of them not having a dedicated HR function or resource and therefore must rely on some activities being handled ‘at a distance’. These techniques also offer potential candidates the opportunity and freedom to ‘self select’ at an early stage. ! Manufacturing, Production and Industrial firms tended to rate ‘shortlisting by degree’ and ‘outsourcing the whole process’ as being less useful than other sectors. This suggests they may be keen to have personal contact with applicants early in the process, and may be seeking to understand different qualities and technical capability – whereas their counterparts may be more concerned with generic skills. ! A good number of members target both students and universities, specific departments or courses. In addition, employers looking for technical capability or knowledge often target universities and departments that are ‘known’ to produce the quality of candidate they are seeking from certain disciplines. Many graduate recruiters visit ‘chosen’ universities and run ‘road shows’ in order to market their organisations. As such activities are very time and resource intensive, the number of establishments they can visit is often limited. They can therefore return to the ones that are already ‘known’ to produce the quality and quantity of graduates the need. However, employers should be mindful that such practice does not compromise or conflict their equal opportunity policies or diversity agenda. ! A similar proportion (21 per cent) of employers in both this and last year’s Half-Yearly Review, report either seeking or planning to target Universities outside the UK. However, it would seem that targeting universities overseas was at present largely confined to those employers who have ‘global businesses’ and they tend to look towards those universities that. 16 ❚ AGR.
(21) were local to these business units. It is worth noting that a good number of companies are now seeking to attract and retain individuals are who are geographically mobile – both within and outside the UK. Some members had the unfortunate experience of graduates withdrawing applications when they learned that they needed to be mobile – within and outside the UK. Table 3 Usage and usefulness of recruitment techniques (percentage) Used in the past. Use now. Specific universities. 7. 78. 6. 9. Specific departments/courses. 4. 60. 16. 21. Universities outside the UK. 4. 17. 14. 65. Post-graduates. 7. 47. 9. 37. Students prior to final year. 5. 61. 17. 17. Ethnic minorities. 3. 60. 8. 28. Graduates with disabilities. 2. 42. 11. 45. Mature graduates. 5. 46. 5. 43. Graduates by gender. 2. 37. 5. 56. 1. 95. 4. 0. 1. 68. 21. 10. 1. 25. 17. 56. Shortlists by ‘A’ level points. 9. 55. 1. 34. Shortlists by degree classification. 5. 74. 2. 20. Specifies competencies in advert. 3. 71. 6. 20. Specifies shortlisting criteria in advert. 3. 49. 3. 44. Evaluating at assessment centres. 3. 80. 4. 12. Outsourcing whole process. 3. 4. 0. 93. Outsourcing part of process. 9. 29. 5. 56. Uses recruitment agencies. 13. 23. 3. 61. Counter. Plan Never productive 2 to use used 1. Usefulness 3. 4. 5. Extremely useful. 6. 7. Targeting of:. Diversity. On-line: Using Internet to describe & advertise typical vacancies Receiving completed application forms from Internet Dispensing with recruitment brochure in favour of Internet Methods:. External:. Source: IES/AGR 2001 Half-Yearly Review. AGR ❚ 17.
(22) ! Diversity is currently high on most employers’ agendas and this is reflected in findings shown in Table 3. Some organisations have dedicated initiatives aimed at promoting or redressing the balance of currently under-represented groups within their workforce, but for most their diversity programme is currently grounded in their equal opportunities policies. ! Twelve months ago, respondents’ views towards outsourcing whole ‘process’ were similar to those reported in this survey. This latest Half-Yearly review introduced a new question regarding ‘outsourcing part of the process’. A higher proportion (see Table 3) of members currently outsource a part of their recruitment process and rate it of similar value to those who outsource the whole process.. 18 ❚ AGR.
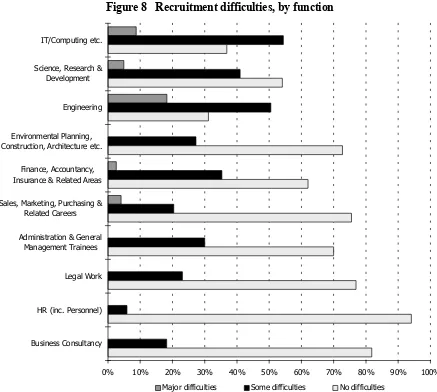
(23) 5 Recruitment Difficulties. Employers continue to compete for the ‘talent’ their organisations need to meet their business needs and objectives. This latest survey shows the career areas that members are finding most difficult to recruit into are the same as those reported twelve months ago (see Figure 8) – suggesting the ‘war for talent’ continues, and those suffering major difficulties are: ! Engineering (18 per cent) ! IT and Computing (nine per cent). Those areas where there was least difficulty were: ! HR/Personnel (94 per cent) ! Business Consultancy (82 per cent). Figure 8 Recruitment difficulties, by function IT/Computing etc.. Science, Research & Development. Engineering. Environmental Planning, Construction, Architecture etc. Finance, Accountancy, Insurance & Related Areas Sales, Marketing, Purchasing & Related Careers Administration & General Management Trainees. Legal Work. HR (inc. Personnel). Business Consultancy. 0%. 10%. 20%. 30%. Major difficulties. 40%. 50%. 60%. Some difficulties. 70%. 80%. 90%. 100%. No difficulties. Source: IES/AGR 2001 Half Yearly Review. AGR ❚ 19.
(24) The overall findings form this latest survey suggest that employers currently have confidence in the graduate labour market and newly qualified graduates should also be encouraged as the number of vacancies and salaries on offer continue to rise. Further analysis of these data suggested that the recruitment difficulties experienced in computing and IT, and engineering, translate into an expected shortfall in recruitment for a large proportion of employers.. 20 ❚ AGR.
(25) 6 Retention and Salary Progression. Managing to retain the ‘talent’ employers have secured, at considerable effort and cost, is critical to achieving a business return on investment in graduate schemes. The previous two AGR surveys reported that members believe their retention rates to have improved. This Half-Yearly Report examines retention trends over a period of one, three and five years – together with salary progression rates.. 6.1 Retention The retention rates for the three graduate intakes for 1994/1995, 1996/1997 and 1998/1999 are shown in Table 4. Analysis of retention rates at an industry level was not possible, due to the relatively small number of respondents in some categories; therefore, Table 4 shows respondents grouped by sector. Although initial ‘shake-out’ rates are relatively high, the Services sector appears to have the overall best longer term retention rates, with the Manufacturing, Production and Industrial companies retaining their intake for longer during their early years. In comparison with those members responding twelve months ago, retention rates appear to be relatively stable. Table 4 Average retention rates as at Spring 2001, by sector (percentage) 98/99. 96/97. 94/95. 82.0. 58.5. 45.0. 29. 20. 19. 82.0. 68.0. 53.0. 39. 31. 20. 86.0. 57.0. 47.5. 51. 42. 36. Financial & Legal Median N Services (excl. Financial & Legal) Median N Manufacturing, Production & Industrial Median N. Source: IES/AGR 2001 Half Yearly Review. 6.2 Loyalty bonuses Managing the expectations of graduates during their early careers can present employers with a number of real challenges. It is interesting that given the proportion of members who now offer ‘golden hellos’ or some form of joining payment (see chapter 2), just seven members in this survey were offering loyalty bonuses as a retention tool. This may suggest that members believe that although financial incentives might act as a ‘hook’ to attract talent, the so-called ‘golden. AGR ❚ 21.
(26) handcuffs’ may not have the same effect as a retention tool. For 1998/1999 recruits, typical bonuses were around £2,000.. 6.3 Salary progression Figure 9 shows the typical salaries currently paid to graduates recruited in 1994/1995, 1996/1997 and 1998/1999. Graduates recruited in 1994/1995 typically earn £7,500 more than their counterparts recruited in 1998/1999. Although this is somewhat less than the £10,000 members reported six months ago, a number of 1998/1999 graduates will have received further salary increases having completed professional training. Figure 10 shows the overall growth in graduate salaries is around 65 per cent over the five years. Figure 9 Typical graduate current salaries, by length of service £35,000. N = 75. £30,000 £25,000. N = 97 N = 121. £20,000 £15,000 £10,000 £5,000 £0 Recruited 1 yr (1998/1999). Recruited 3 yrs (1996/1997). NB: Salaries exclude London Weighting Allowance. Recruited 5 yrs (1994/1995). Source: IES/AGR 2001 Half Yearly Review. Figure 10 Percentage growth in graduate salaries 70. N = 68. 60 50. N = 88. 40 30. N = 108. 20 10 0 1998/1999 to 2000/2001. NB: Salaries exclude London Weighting Allowance. 22 ❚ AGR. 1996/1997 to 2000/2001. 1994/1995 to 2000/2001. Source: IES/AGR 2001 Half Yearly Review.
(27) Figure 11 Percentage growth in graduate salaries, by sector N = 24 Financial & Legal. N = 18 N = 16 N = 37. Services (exc. Financial & Legal). N = 31 N = 19 N = 47. Manufacturing, Production & Industrial. N = 39 N = 33 N = 108 N = 88. All Respondents. N = 68 0%. 20% 1998/1999 to 2000/2001. NB: Salaries exclude London Weighting Allowance. 40%. 60%. 80%. 1996/1997 to 2000/2001. 100%. 120%. 1994/1995 to 2000/2001. Source: IES/AGR 2001 Half Yearly Review. Further analysis of the information members provided (see Figure 11) shows the proportionate growth by sector, and the higher salaries offered by the Financial and Legal firms is apparent. Given this same sector was no better than others at retaining their intake in the longer term, these findings again suggest graduates are seeking other offerings in addition to salaries. Interestingly, and perhaps surprisingly, further analysis shows that salary growth appears to be faster in the smaller organisations, ie those with fewer than 1,000 employees – but we must bear in mind the small number of employers in this group.. AGR ❚ 23.
(28) Appendix A: Survey Respondents. This Appendix shows survey respondents clustered into their respective industry groups. It should be noted that not all organisations agreed to be named, and allocation to a specific industry was dependent on the respondents’ self-selection on the questionnaire. Some of the smaller industries have been combined with others in order to protect the confidentiality of respondents. Alongside each industry, the median starting salary for 2000/2001 and anticipated salary for 2001/2002 is shown. This was calculated from all respondents in each industry, not just from those who are named below. Please note that fewer organisations were able to provide data for 2001/2002 than for 2000/2001. In addition, some organisations have offered more conservative estimates for 2001/2002, which may result in overall salaries appearing lower than the previous year.. ENERGY & WATER INDUSTRIES 2000/2001 Median starting salary = £18,300 2001/2002 Anticipated salary = £19,000 British Energy plc. National Grid. BNFL. Powergen. Centrica plc. Scottish Power. Exxon Mobil. Thames Water. Kvaerner E & C. TXU Europe Group plc. Yorkshire Water (Plus one other organisation who did not wish to be named). CHEMICAL & ALLIED INDUSTRIES AND MINERAL & ORE INDUSTRIES 2000/2001 Median starting salary = £19,500 2001/2002 Anticipated salary =£20,375 Acordis UK Ltd. BG Group. Tarmac. Croda International plc. AstraZeneca. ICI. Johnson Matthey plc. Reckitt Benckiser. The BOC Group. UCB Films plc. (Plus two other organisations who did not wish to be named). 24 ❚ AGR.
(29) ENGINEERING AND CONSTRUCTION 2000/2001 Median starting salary = £18,150 2001/2002 Anticipated salary = £18,500 ABB Power UK Ltd. Halcrow Group. ABB Ltd. Hymatic Engineering Co Ltd. Alstom Power. One2One. AWE plc. Perkins Engines Co Ltd. BSS Group plc. Rolls-Royce plc. Carillion Building. Siemens plc. E C Harris. Sir Robert McAlpine Ltd. Ford Motor Company. Thales Group. Westland Helicopters Ltd (Plus four other organisations who did not wish to be named). ELECTRONIC & ELECTRICAL ENGINEERING, INCLUDING IT & TELECOMS 2000/2001 Median starting salary = £21,000 2001/2002 Anticipated salary = £22,000 3Com Europe Ltd. Nokia UK Ltd. Agilent Technologies. Novar plc. Hitachi Europe Ltd (Plus five other organisations who did not wish to be named). OTHER MANUFACTURING (INC. FOOD, DRINK & TOBACCO) 2000/2001 Median starting salary = £18,500 2001/2002 Anticipated salary = £19,825 British Sugar. Nestlé. Bunzl plc. Northern Foods plc. Corus. Peugeot Motor Co plc. Cussons International. Pilkington plc. IMI plc. Palmer Harvey McLane Group of Companies. Kerry Group. Procter & Gamble. L’Oreal. Tate & Lyle Europe. Kimberly-Clark Ltd. Vauxhall Motors Ltd. Mars (Plus four other organisations who did not wish to be named). AGR ❚ 25.
(30) RETAIL INDUSTRY, HOTELS & CATERING 2000/2001 Median starting salary = £17,500 2001/2002 Anticipated salary = £18,000 B&Q plc. McDonalds Restaurants Ltd. The Boots Company. Next Retail Ltd. Debenhams. Safeway plc. Harrods Ltd. Spirit Health & Fitness. John Lewis Partnership. Tesco Stores Ltd. Kingfisher plc (Plus one other organisation who did not wish to be named). TRANSPORT & COMMUNICATIONS 2000/2001 Median starting salary = £19,000 2001/2002 Anticipated salary = £18,600 British Airways. Railtrack. Concert Communications. Reuters Ltd. e-peopleserve. Thomas Cook UK Travel Ltd. Haymarket Business Publications Ltd. Vodafone. IPC Media. Wincanton. Nortel Networks. Worldcom. Consignia plc (Plus two other organisations who did not wish to be named). BANKING AND FINANCE 2000/2001 Median starting salary = £22,500 2001/2002 Anticipated salary = £23,000 Abbey National. FCE Bank plc. Alliance & Leicester. Girobank plc. Bank of Scotland. Halifax plc. Barra International Ltd. HSBC Bank plc. Barclays plc. J P Morgan. Commerzbank Securities. Lazard. Coutts & Co. Lloyds TSB plc. Dresdner Kleinwort Wasserstein. The Royal Bank of Scotland Group. Fidelity Investments. Towers Perrin. (Plus nine other organisations who did not wish to be named). 26 ❚ AGR.
(31) INSURANCE AND ACCOUNTANCY 2000/2001 Median starting salary = £17,250 2001/2002 Anticipated salary = £18,375 AXA UK. Grant Thornton. BDO Stoy Hayward. Ing Barings. Co-operative Insurance Society. Kingston Smith. Cornhill Insurance. KPMG. Deloitte & Touche. PKF. Ernst & Young. Price Waterhouse Coopers. EULER Trade Indemnity (Plus three other organisations who did not wish to be named). LEGAL SERVICES 2000/2001 Median starting salary = £24,000 2001/2002 Anticipated salary = £26,000 Addleshaw Booth & Co. Nabarro Nathanson. Allen & Overy. Norton Rose. Berwin Leighton. Osborne Clarke OWA. Clyde & Co. Richards Butler. CMS Cameron McKenna. Simmons & Simmons. DLA. Taylor Joynson Garrett. Hammond Suddards Edge. Stamp, Jackson & Procter. (Plus three other organisations who did not wish to be named). OTHER BUSINESS SERVICES, INC. SOFTWARE/IT & CONSULTANCY SERVICES 2000/2001 Median starting salary = £20,000 2001/2002 Anticipated salary = £20,000 AIT Group plc. Midas-Kapiti International. Accenture. Defence Engineering & Science Group (DESG). Arthur Andersen. Oracle Corporation UK Ltd. Cable & Wireless. PA Consulting Group. CMG (UK) Ltd. RM plc. Computacenter. Sun Microsystems Ltd. Compaq Computer Ltd. Walker International. CSC. Wilco International. Data Connection Ltd. Yell Ltd. DTZ Debenham Thorpe. Phee Farrer Jones (inc. The Graduate Recruitment Co). ICL. Reed Graduates. Logica (Plus six other organisations who did not wish to be named). AGR ❚ 27.
(32) PUBLIC SERVICES 2000/2001 Median starting salary = £17,133 2001/2002 Anticipated salary = £19,500 District Audit. NHS MGT Training Scheme. Civil Service Fast Stream. London Underground Ltd. Cleanaway Limited. Accelerated Promotion Scheme for Graduates in Police Service. HM Prison Service. Royal Air Force. Inland Revenue. The Army. Lancashire Constabulary (Plus four other organisations who did not wish to be named). 28 ❚ AGR.
(33) Appendix B: Questionnaire. AGR ❚ 29.
(34) GRADUATE SALARIES AND VACANCIES SURVEY 2001 HALF-YEARLY REVIEW Confidential to the Institute for Employment Studies Please answer the following questions as fully as you are able by ticking the boxes or writing in the spaces provided. Please return the completed questionnaire to IES in the reply-paid envelope provided. If you have any queries, please contact Linda Barber (01273 873682) or Sarah Perryman (01273 873642) at IES. Fax: 01273 640930; email: sarah.perryman@employment-studies.co.uk. Thank you for your co-operation. Throughout this questionnaire a ‘typical’ graduate is 21 years old with a second class honours degree. Starting Salaries 1. Do you offer a London Weighting Allowance to any of your typical new first degree graduates? Yes. No. 2. If yes, please state the average London Weighting Allowance for each of the following recruitment years: Paid: £ Oct 1999–2000. pa. Offering: £ Oct 2000–2001. Anticipated: £ Oct 2001-2002. pa. pa. 3. Excluding London Weighting, please state the average graduate starting salary for typical new first degree graduates for each of the following recruitment years: Paid: £ Oct 1999–2000. pa. Offering: £ Oct 2000–2001. Anticipated: £ Oct 2001-2002. pa. pa. 4. Do you offer ‘golden hellos’ or joining payments/incentives? Yes. No. If yes, how much for Oct 2000-2001 £. Graduate Recruitment 5. How many vacancies for new first degree graduates: Did you have in the recruitment year 1999/2000? Do you anticipate in the recruitment year 2000/2001? 6. Do you anticipate any shortfall in the recruitment year 2000/2001? Yes. No. Don’t know. 7. If yes, how many unfilled vacancies do you anticipate?. Retention 1998/1999. 1996/1997. 1994/1995. 8. What was the average starting salary paid to new recruits in the following years?. £. £. £. 9. What are they earning now?. £. £. £. 10. What percentage are still with the organisation? 11. If you offer loyalty bonuses/golden handcuffs, how much during the last year? 30 ❚ AGR. £. %. %. %. pa £. pa £. pa.
(35) Recruitment Techniques and Issues 12. Which of the following statements best describes your typical graduate recruitment cycle? (Please tick one box only) Yearly cycle – with only one fixed entry date per year Six monthly cycle – with two fixed entry dates per year Continuous cycle – with entry at any time during the year Other (please specify) .......................................................................... We are also interested in other aspects of your organisation’s graduate recruitment practices. 13. In the first four columns please indicate your usage of the following practices: (Please tick one box per row) For those you have used in the past, or currently use, please rate their usefulness using a scale of 1 to 7, where 1 is counter productive, 4 is neutral and 7 is extremely useful: (Please circle the appropriate number) Used in the past. Use now. Plan to use. Never used. The usefulness of the measure Counter Extremely productive useful. Targeting of: Specific universities. 1. 2. 3. 4. 5. 6. 7. N/A. Specific departments/courses/disciplines. 1. 2. 3. 4. 5. 6. 7. N/A. Universities outside the UK. 1. 2. 3. 4. 5. 6. 7. N/A. Post graduates. 1. 2. 3. 4. 5. 6. 7. N/A. Students prior to their final year. 1. 2. 3. 4. 5. 6. 7. N/A. Ethnic minorities. 1. 2. 3. 4. 5. 6. 7. N/A. Graduates with disabilities. 1. 2. 3. 4. 5. 6. 7. N/A. Mature graduates. 1. 2. 3. 4. 5. 6. 7. N/A. Graduates by gender. 1. 2. 3. 4. 5. 6. 7. N/A. Using the Internet to describe and advertise vacancies. 1. 2. 3. 4. 5. 6. 7. N/A. Receiving completed application forms from the Internet. 1. 2. 3. 4. 5. 6. 7. N/A. Dispensing with your recruitment brochure in favour of the Internet. 1. 2. 3. 4. 5. 6. 7. N/A. Shortlisting by ‘A’ level points/scores. 1. 2. 3. 4. 5. 6. 7. N/A. Shortlisting by degree classification. 1. 2. 3. 4. 5. 6. 7. N/A. Specifying competencies in adverts. 1. 2. 3. 4. 5. 6. 7. N/A. Specifying shortlisting criteria in adverts. 1. 2. 3. 4. 5. 6. 7. N/A. Evaluating at assessment centres. 1. 2. 3. 4. 5. 6. 7. N/A. Outsourcing the whole process. 1. 2. 3. 4. 5. 6. 7. N/A. Outsourcing part of the process. 1. 2. 3. 4. 5. 6. 7. N/A. Using recruitment agencies. 1. 2. 3. 4. 5. 6. 7. N/A. 1. 2. 3. 4. 5. 6. 7. N/A. Diversity:. On-line:. Methods:. External:. Other recruitment techniques/issues not specified (please specify) ............................................................................ © Institute for Employment Studies.
(36) Recruitment Difficulties 14. For each of the career areas below, are you experiencing any difficulties in recruiting sufficient graduates this current recruitment year (2000/2001)? (Please tick one box per row). IT, computer analysis, programming etc.. Major difficulties ....................................................... Some No Not difficulties difficulties applicable. Science, research & development ..................................................................... Engineering ............................................................................................................ Environmental planning, construction, architecture etc. ............................ Finance, accountancy, insurance & related areas ......................................... Sales, marketing, purchasing & related careers ............................................ Administration and general management trainees ....................................... Legal work .............................................................................................................. HR (includes personnel) ...................................................................................... Business consultancy ........................................................................................... Other career area (please specify) ................................................................... Other career area (please specify) .................................................................... Additional Information 15. What is your organisation’s main business activity: (Please tick one box only) Energy & water industries. Mineral & ore industries. Chemical & allied industries. Engineering. Electrical/ronic engineering. Food, drink & tobacco. Other manufacturing. Construction. Hotels & catering etc.. Retail industry. Transport & communication. Banking & finance. Insurance. Legal services. Accountancy. Other business services Inc. software/IT. Public services. Other (please specify) .......................................................... 16. In total, how many people are currently employed by your organisation in the United Kingdom? 1 249. 250 999. 1000 2499. 2500 4999. 5000 19999. 20000 or more. In order to broaden the commentary in the report, a few respondents will be asked to participate in a short telephone interview. If you would not be willing to participate please put a cross in the box. If your organisation does not wish to be named as a survey respondent please put a cross in the box. (All information supplied will remain strictly confidential. Data on individual organisations will not be published) Your name and job title: ............................................................................................................................................................................ Your organisation: ....................................................................................................................................................................................... Your telephone number: ............................................................................................................................................................................ Your email address: ..................................................................................................................................................................................... Thank you for completing this questionnaire Please return this questionnaire to: The Institute for Employment Studies, Mantell Building, University of Sussex, Falmer, Brighton, BN1 9RF in the reply paid envelope provided or fax a copy to: 01273 690430 32 ❚ AGR.
(37)
Figure


+7


Related documents
people identify along a spectrum of masculinity--femininity as a “man” or “woman.” Delight, who identifies as “gender non-binary” uses “they/them” pronouns.. that
Hands-on activities Site visits Lab experience Meet Indigenous elders Provide mentors/role models Formal dinner Research project Meet STEM professionals Presentations
During each of the five peer tutoring test review sessions that were implemented in the classroom and two typical test reviews, the researcher charted the behavior of
Analysis of covariance, regression and logistic regression methods are used to determine if any of the following variables from time 1 are significantly associated with
Actually, they, in turn, can be subdivided into several types depending on their origin and production time: the prompt photons from the very initial stage of collision, the
Based on the background, the author aimed to determine the relationship between nurse knowledge and nurse attitudes with the implementation of the Patient Safety
Introduction of a child-allowance policy and a PAYG- pension system increases the number of children and decreases the labor time.. When the government introduces the
As in the case of single-electron pumps, the device operation is based on Coulomb-blockade effects allowing the controlled transfer of individual Cooper pairs, which means in the
