1
Introduction
1.1
Background to the project
Despite some progress in extending access to higher education to various disadvantaged groups (e.g. ethnic minorities, lower socio-economic groups) and a big political as well as academic interest in this process, little is known about how these ‘non-traditional’ students will fare in the graduate labour market. Some empirical findings (usually carried out for other purposes) and also anecdotal evidence suggest that graduates from such groups do relatively poorly on entry to the labour market. This project is utilising the results of existing studies carried out by the research team to address this major problem. The project links equity issues with graduate employment in a direct and detailed way and aims to have impact upon both national and institutional policies.
The aim of the project is to improve the employment prospects of students from socially ‘disadvantaged’ groups. It is organised in three phases: (i) factors determining graduate employability: statistical analysis of existing data, (ii) policies and practices to support greater equity in the graduate labour market, (iii) evaluation and dissemination. This report describes the results of phase one.
The project objectives are:
(i) To identify the educational factors associated with employment success for such students (e.g. characteristics of study programmes, mode and timing of study, work experience, counselling and careers advice and information, expectations and attainment levels). (ii) To identify the employment factors associated with employment success for such students
(e.g. size and type of employer, induction and training arrangements).
(iii) To identify the transitional factors associated with employment success for such students (e.g. timing and method of job search, further training or study, temporary work). (iv) To identify the national policy implications of the above (e.g. for institutional funding
and student support arrangements).
(v) To identify the institutional policy implications of the above (e.g. for admissions, guidance and counselling, careers advice, curriculum and planning).
(vi) To identify the implications for employers of the above (e.g. for recruitment strategies, induction and training procedures).
(vii) To disseminate the results.
This report presents the findings of phase one of the project. It investigates the transition from higher education into employment of graduates from three groups: (i) ethnic minorities, (ii) lower socio-economic groups, (iii) mature students. Account has been taken of the effects of subject and mode of study, institution attended and other educational variables, as well as the effects of socio-biographical factors such as gender, ethnic group etc. The relationship between social and educational disadvantage and between both and employment success has been explored.
The analyses are based on the data from the UK sample of an international study of graduate employment undertaken for the EC1. The survey was conducted among members of the cohort of UK domiciled students that had graduated in 1994/1995. The UK sample was drawn from 27 universities and colleges in England, Wales, Scotland and Northern Ireland stratified by size and type of institution. Overall, 4,340 questionnaires were returned from the UK graduates (representing a response rate of 34%). Before the analysis stage, the responses were weighted to reflect the subject spread and type of institution for the UK 1994/5 graduating cohort. The
1
resulting database comprised 3461 UK graduates. For this report, analysis is based on 2997 full-time and sandwich students.
To test how representative the findings from this survey were and to get additional information for sub-groups for which the cell sizes from the data were too small, additional analyses of data gathered by the Higher Education Statistics Agency (HESA) from the 1995 First Destinations Survey were undertaken.
1.2
Context
The numbers of students from lower socio-economic groups, from certain ethnic minorities and mature students in higher education has increased significantly in the 1990s. For example, the participation in higher education of people from lower socio-economic groups was only 3% in 1950 and had grown to 17% in 1998 (Connor et al, 2001). Although certain ethnic minority groups (e.g. Bangladeshis) are still underrepresented, overall ethnic minority participation in higher education is high. In 1994, over 8% of 18-20 year olds in higher education were from ethnic minorities compared with just over 5% in the population as a whole (Dearing Report 1997). Despite the trend towards widening participation, low socio-economic groups and also some ethnic minorities (some Black groups, Bangladeshis) are still underrepresented among those entering higher education. Also, different segments (types, subjects) of higher education are not equally accessible to these student groups. These segments are typically at the most prestigious end of higher education. Moreover, as a result of the above-average drop-out rates of many of these groups, their proportion is even lower among the successful graduates (HEFCE 2001b).
However, the starting point for the present project is that even a fully successful equalisation of access to higher education would not necessarily result in the equalising of outcomes. As Lynch and O’Riordan point out “…equalising formal rights to education, or achieving proportionate patterns of participation, does not equate with equal rates of success or outcomes for disadvantaged groups” (Lynch and O’Riordan, 1998, p 449). In the case of those accessing and also successfully finishing higher education, equality of outcome raises the following question: does a higher education degree provide access to the same labour market benefits for everyone with similar educational achievements irrespective of their socio-biographical background? In a mass higher education system, where over one-third of the relevant population earns a degree, it is natural to find a significant level of heterogeneity in employment situation, type of job, salary and other labour market outcomes of graduates. But can these kinds of variations in employment success at least partly be attributed to inherent differences in social origins and/or to ethnic differences and/or to the age the graduate entered university? These are the first questions this study looks at.
In the following section we introduce the notions of direct and indirect effects of the socio-biographical background. Differentiating between these two major sources of inequalities in the labour market provides a helpful framework for the analyses given here and will be applied throughout this report.
1.3
The notion of employment success
There are various individual benefits from attending higher education and employment benefits form only one group of these. As suggested in earlier studies (Brown and Scase 1994) a sense of personal improvement and enrichment of the personality is a common experience of students which is highly valued even if it is not accompanied by a high-flying career. In the UK subsample of the international graduate survey on which this report is based, 77% of the graduates reported that their degree had helped them considerably to develop as a person – this percentage was higher than that of those who found their degrees helpful to find a satisfying job (54%).
considered to constitute an elite in the labour market, there is no doubt about the high rates of financial return from attending higher education. Salary, however, is only one aspect of employment outcomes.
This project will argue that the notion of employment success is complex and problematic. It is not only multidimensional – meaning that even the various “objective” measures of success might be loosely correlated – but it also carries a considerable element of subjectivity in the sense that the personal meaning and experience of success can vary significantly. Although empirical (especially quantitative) research is bound to simplify, we are making attempts to grab as much of this complexity as possible.
One fairly obvious measure of employment success is the ability to find a job, that is the lack of unemployment experiences. As we will see, however, among young graduates in Britain finding some kind of a job is rarely a problem. The actual nature of the job, however, seems to be a much more sensitive question and one that can be answered in different ways. First we will look at the “level” of job, assuming that higher education should ideally lead to certain high level jobs, in which skills and knowledge of graduates are fully utilised. Accordingly, having a managerial or professional job; or a job that is traditionally done by graduates, and also the self-report by graduates that the job they are doing requires a degree will all be considered as indicators of labour market success. Similarly, positive responses to a range of questions regarding the level to which the acquired skills and competencies are actually needed for the job are also used as indicators of employment success in this study. Furthermore, we are certainly not eliminating income as one measure of success, accepting that financial recognition in a job is one with significant impact on life opportunities and life quality in a broad sense and is also a reasonably good proxy of other important characteristics of the job such as social prestige. To provide a somewhat longer view of the graduates’ position in the labour market than the 4 years after graduation snapshot provides, we also investigate the expectations of the graduates regarding possible promotions and salary-increases.
Although all the characteristics of success listed so far represent a general consensus on what is desirable to achieve in the labour market, the variations in the importance attached to each characteristic can be considerable. The relative importance of the “objective” characteristics of employment is strongly dependent on the value-system, aspirations and preferences of the individual. The above success criteria can be differently “weighted” by the various graduate groups. A job in the care industry can provide a substantial amount of personal fulfilment despite failing to meet certain criteria listed above. Similarly, flexibility in use of time in a mundane low status job can compensate for lower salary and even for lower social prestige for many people. In this study therefore we put a special emphasis on job-satisfaction as a measure of employment success.2
1.4
The notion of ‘disadvantage’
The students who are the subject of this report do less well on average, according to a wide range of measures, in the labour market than other students. In other words, they are disadvantaged in terms of outcomes, i.e. in their access to the economic benefits of higher education.
They may of course face many other kinds of disadvantage. Students from lower socio-economic backgrounds will lack material resources and access to the ‘best’ secondary schools, for example. Students from ethnic minorities are perhaps more likely to have encountered prejudice and discrimination. Age, however, is not of itself a disadvantage, except in this specific case of seeking entry into the more desirable end of the graduate labour market. Thus, the three categories of ‘disadvantage’ with which this report is concerned are quite different from each other. Perhaps the most important thing they share in common is that they are not ‘advantaged’ or privileged. The three characteristics differ in other ways. Age, by definition, is never constant.
Social class can be denied, faked or escaped (mobility is possible). Only ethnicity is a permanent feature of the individual. Individual students, of course, possess all three characteristics: they have an age, a race and a social class. For some, a favourable feature in one - especially class – will be sufficient to outweigh the unfavourable features of the other. For other students, two or more unfavourable features may reinforce each other – a kind of double or even treble disadvantage. The complexities of real lives are revealed in section 5 in the reports of some interviews with graduates.
Thus, the notion of a ‘disadvantaged’ student or group or background is problematic. And, as we shall see in the analyses that follow, it is frequently overlain by a further feature of the individual, i.e. gender. Perhaps the fairest thing to say about the notion of ‘disadvantage’ is that it occurs in respect of certain aspects of people’s lives at certain times of their lives.
The way in which some key concepts have been operationalised in this report is explained in appendix I.
1.5
Key concepts in this report: Direct and indirect effects
This paper will focus on variations in the employment outcomes of graduates and will explore the connections between variations in outcomes and the graduates’ socio-biographical backgrounds. Based on earlier research (described later) we expect that those from a disadvantaged socio-biographical background experience more difficulties and are in a worse position in certain aspects of the graduate labour market than other graduates.
It is important to make clear at this stage that our project is certainly not assuming that these student groups do not achieve considerable benefit from attending a university, i.e. that they do not improve considerably their labour market prospects. Indeed, earlier research suggests that certain groups can enjoy above average benefits from entering higher education even if their situation in the graduate labour market is worse than that of other graduates. Our assumption is only that the employment situation of graduates from disadvantaged socio-biographical backgrounds might be less successful in certain aspects in comparison to their fellow graduates from more advantaged backgrounds.
We differentiate between two major possible sources of the connection between socio-biographical origin and success in the labour market. (Chart 1 provides a schematic model for this differentiation.) The first are indirect effects of socio-biographical background. Indirect effects of background apply when graduates from disadvantaged backgrounds face worse than average opportunities in the labour market because of characteristics of their educational careers. Decisive sources of background effects via educational career are that students from disadvantaged socio-biographical backgrounds tend to study in lower-status institutions, and (in some cases) they also tend to study a subject with a relatively low labour market demand. They may also possess below average entry qualifications and obtain lower degree classifications. All of these are factors likely to disadvantage them in the labour market, irrespective of their social background.
We will talk about direct effects of background if graduates from disadvantaged socio-biographical backgrounds realise more difficulties in the labour market than their counterparts even if they had similar educational experiences and followed the same higher education tracks. (See arrow 3.) If two graduates with different socio-biographical backgrounds but with identical educational characteristics experience different opportunities in the labour market then these differences might be attributed to their social or biographical characteristics.
Social and Biographical Background
• parents’ social status and education
• ethnicity • age of entry
Success in the Labour Market • Difficulties in Finding a Job
• Income
• Quality of Job
• Job Satisfaction Intervening Factors
• Work experience;
term-time work • Extra-curricular
activities • Overseas
experiences • Job search
employment inequalities since employers’ recruitment strategies systematically discriminate in favour of graduates with certain educational characteristics such as good A levels, good reputation of higher education institution, subject studied and a good degree classification. (Purcell and Hogarth, 1999.)
When interpreting direct effects of socio-biographical background, we are directed towards factors such as cultural characteristics acquired in the family, lack of appropriate social networks and financial assets as well as various forms of self-exclusion from certain high-status jobs. These are factors which can continue to disadvantage graduates after they have left higher education, irrespective of their educational achievements. This project focuses on what can be done to minimise the negative effects of such factors.
Chart 1 identifies a set of factors which are likely to affect direct relationships between socio-biographical background and employment. Under the heading “Intervening Factors” we are suggesting mechanisms that can be possible targets of policy interventions aiming to equalise opportunities for various graduate groups. In other words, we are looking at ways of mitigating the direct effects of socio-biographical background. The role of work experience, term-time work, extra-curricular activities, overseas experiences, the job search process and also certain characteristics of the employer are investigated.
Chart 1: The effects of social origin on the graduates' labour market situation
1.
3. 2. 4.
1.6
Earlier research
Some research in the UK suggests that people from disadvantaged backgrounds do not realise the same amount of benefit from their higher education as others. Some studies have compared the employment outcomes for graduates from disadvantaged and advantaged backgrounds. In these cases we get a good overview of the employment situation of different groups, but we cannot necessarily tell whether the inequality found can be attributed to direct effects of background, to indirect effects or to both. In a range of other cases, however, the analysis clearly indicates the existence of direct effects of background. These analyses are typically based on regression
Education: pre-HE and HE • pre-He schooling and achievement • type of HE institution
• field of study
modelling and show the labour market disadvantages of one or the other “non-traditional” student group even when their educational characteristics are the same as “traditional” students.
Brennan and McGeevor (1990) discovered that in the first few months after graduation ethnic minority graduates were much more likely to be unemployed than others, around 13-17% more non-white than white graduates unemployed. Asians and Black Caribbeans also reported more difficulties in finding the ‘right job’ than did their white counterparts. When controls for factors such as subject of study and class of degree were introduced, the differences were even larger. Similarly, a more recent study (Department for Education and Employment, 1999) provides individual data on the likelihood of unemployment in the different graduate groups. These indicate that there is a greater than average risk of unemployment among those whose parents are unemployed themselves, and also in many ethnic minority groups such as Pakistani, Chinese, Bangladeshi and Black-African.
In the same DfEE study researchers found indications for direct background effects. Using multivariate models they showed that graduates who entered higher education at the age of 26-29, and those with parents in partly skilled occupations or with parents unemployed, are more likely than others to work in a non-graduate job 18 months after graduation. Being a mature student can mean an increase of this risk by around 4%, whereas having parents in partly skilled jobs can increase it by over 30%, having no parent in work by almost 80%. Another related finding was that three and a half years after graduation those from lower social classes also tend to earn less. Those with no parent in work earned 10% less, those with unskilled parents 6% less, and those with partly skilled parents 7% less than graduates with parents in managerial and technical positions.
Working on the improvement of performance indicators for higher education, J. Smith et al (2000) found that in the cohort of 1993 university leavers, those from lower social classes are ceteris paribus around 2% more likely than others to be unemployed or inactive six months after graduation. Mature students also have a higher risk of unemployment than those who entered higher education before the age of 24. Their analysis also shows that social class affects the likelihood of working in a graduate level occupation six months after graduation. Compared to social class II, graduates from the social class V are around 5-6 percentage points less likely to work in a job considered to be at graduate level.
In a paper aiming to contribute to the debate on fees in higher education, R. Naylor and his colleagues (2001) show that graduates from higher social classes tend to move into occupations with salaries 1-3% higher than those from lower social classes. However, in the case of females other than the 1993 cohort, this finding proves to be unstable.
In a HEFCE report on employment indicators (2001a) the graduate cohort of 1999 was investigated. The models originally constructed for the purposes of providing performance indicators included information on the socio-biographical background of graduates. These suggest that social class, age of entry and ethnicity all have some influence on the likelihood of being employed six months after graduation. The extent of these impacts varies from only 0.2-0.3% differences in the likelihood of unemployment between the different classes to around an 8% additional risk of being unemployed in the case of Pakistani, Bangladeshi and also Chinese graduates.
1.7
The structure of this report
Sections 2 and 3 aim to explore and specify disadvantages in the labour market attributable to differences in the socio-biographical backgrounds of graduates. In Section 2 the focus will be on the effects of parental education and occupation and the effects of students’ age. Using data from a major international graduate employment survey, a range of employment outcomes such as unemployment, salary and job-satisfaction will be looked at and we will explore to what extent these elements of ‘labour market success’ are associated with being a ‘traditional’ student in higher education.
In Section 3 a similar analysis will be undertaken but with an emphasis on the effects of ethnicity. In this section HESA First Destination Survey data will be used. Being unemployed six months after graduation and not being in a graduate job are applied as indicators of lack of success in the labour market. Members of various ethnic minorities are compared to whites on these indicators.
2
The effects of social background and age on the
employment of graduates
The majority of the analysis in this section3 is based on data from the UK sub-sample of a major international survey of graduate employment, funded by the European Community (EC) in 1999 (Brennan et al 2001). 16,104 graduates from the 1995 cohort were randomly selected from 27 UK higher education institutions stratified by size and type and by field of study. Members of the sample were contacted by a mailed questionnaire nearly four years after their graduation. The number of responses was 4,340 (representing a response rate of 34%).
For the purposes of the present project, the 2,997 full-time or sandwich course students were selected. On this sub-sample, firstly bivariate analyses were conducted, then a range of linear and logit regression models were estimated. All the analyses presented below were done separately for males and females to allow for gender-specific observable and unobservable effects. For a more detailed description of the sample and also information on the indicators used see Appendix I.
Since the case numbers do not allow us to make a detailed analysis of ethnicity, the focus of this section will be on socio-economic background and age. Comments on ethnicity in this section will only be made when case numbers allow. A more thorough investigation of ethnic differences will be provided in Section 3, based on the HESA First Destination Survey for the same group of graduates. Although the First Destination Survey is more representative regarding the 1995 cohort, it is limited in terms of the data collected.
2.1
Graduates from different backgrounds in the labour market
In this section simple cross-tables and average measures are reported. The aim is to identify the connections between socio-biographical background and employment success, without differentiating between direct and indirect effects. In this way we can tell whether people from disadvantaged backgrounds have more difficulties and less opportunities in the labour market in a statistical rather than explanatory way.
As stated in the introduction, ‘employment success’ will be measured by several different indicators:
• Likelihood of unemployment; • Income level;
• Type or “level” of job done defined by objective criteria (as measured by a graduate/non-graduate divide and also by having a managerial or professional job);
• The graduate’s subjective perceptions of the level of the job (whether it requires a degree, to what extent his or her skills are utilised…);
• The graduate expectations regarding a promotion and salary-increase; and • Job-satisfaction.
(A detailed description of the employment success measures used is given in Appendix I.)
If we simply look at the different employment outcomes of graduates from various social/ethnic backgrounds we find a rather complicated and sometimes contradictory picture. (Tables are
provided in Appendix II.) Most importantly, different types of “success measures” lead to different conclusions, and different forms of socio-biographical disadvantages show their effects on employment outcomes in different ways.
However, the findings support other studies which indicate that success in the labour market is to some extent associated with the socio-biographical characteristics of the graduates. In particular: • Males with less qualified parents and/or with parents in lower level occupations are more likely to spend
some time unemployed in the first 3.5 years after graduation. They also tend to be in a non-managerial and non-professional occupation and characterise their job as one which does not provide opportunities to use their knowledge and skills. Furthermore, they also tend to describe their job as one for which it is not necessary to hold a degree or as one that does not provide attractive career prospects. A promotion or higher income in the coming years are also rarely expected. Graduates from families where parents completed only compulsory education earned on average £1,500 less a year and were also slightly less satisfied with their employment situation.
• Among females however, there is a higher than average proportion of graduates with less qualified parents in managerial or professional jobs and also in jobs defined as “graduate”. Nevertheless, members of these groups are less likely to perceive their job as one for which a higher education degree is necessary or to expect an increase in their income. Both parental education and parental occupation tend to have an impact on salaries, resulting in approximately £1,000 annual difference in favour of those from “better backgrounds”. These differences show themselves in a slightly lower level of job-satisfaction as well.
• Asian males are more likely to be in a managerial or professional position than white male British graduates, but are less likely to characterise their job as one which provides good opportunities to use relevant knowledge and skills acquired.
• Similarly, compared to white British females, Asian female graduates are also more likely to be in a managerial or professional position. They are also more likely to have a graduate job; to characterise their job as a graduate one, to find their job challenging and to describe it as one that provides good opportunities to use possessed skills and knowledge. Also, they tend to have fairly good mid-term career prospects. However, these advantages do not seem to be reflected in their salaries and job-satisfaction.
• Male graduates who entered higher education after the age of 24 are more likely than others to spend some time unemployed in the first 3.5 years after graduation. The subjective measures of job quality suggest clear disadvantages for those starting higher education after the age of 24 and their mid-term career prospects also lag behind those of the younger graduates. Differences in their average income clearly reflect these disadvantages.
• Regarding the likelihood of spending a minimum of six months unemployed, males in the 21-24 years entry age group also seem to be at a disadvantage. Also, their career prospects stay somewhat behind those of the ‘traditional age’ students as does their average income. However, members of this age group are more likely to be in a graduate job than younger graduates. In terms of subjective level of job, they are in no worse a position (in some respects even better) than the youngsters. They are also slightly more pleased with their jobs than either younger or older graduates.
• As is the case with males, the mid-term career prospects of women decline as we move from the younger towards the older graduates, although the middle age (21-24) group is more similar to the younger one than to the mature group (25+). There is also a gradual decrease in income moving from the youngest towards the oldest group of female graduates.
clear negative effect of entering higher education after the age of 24, but a somewhat ambivalent effect of starting between the age of 21 and 24 compared with younger students.
In the following sections we will investigate the factors behind these background-linked variations in the graduates’ employment situation.
2.2
Sources of indirect background effects: socio-biographical differences in
educational careers
2.2.1 The importance of institution attended and subject studied
As we have noted, indirect effects of socio-biographical background on graduate employment can come about because of the impact on employment of certain educational factors. Key ones are institution attended and subject studied.
Differences in the “reputation” of institutions were measured through a 3-category grouping: pre-1992 (‘old’) universities, post-pre-1992 (‘new’) universities, and colleges. As earlier research (e.g. Brennan and McGeevor 1988; Brennan et. al. 1993) and our findings show, in addition to type of institution, subject studied is a fundamental determinant of later employment success.
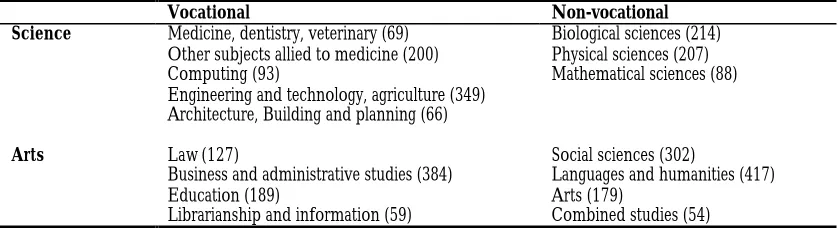
[image:10.596.106.525.430.544.2]To reflect the major differences in the relationships between subjects studied and employment, a 4-category grouping of subject fields was created. In this, we differentiated between vocational science, non-vocational science, vocational arts and non-vocational arts types of subjects (Table 1). This two-dimensional cut of fields provides a sensible grouping which is intuitively meaningful and is also responsible for a reasonable proportion of the differences in employment outcomes.
Table 1: Categorisation of subjects (case numbers in brackets)
Vocational Non-vocational
Science Medicine, dentistry, veterinary (69) Other subjects allied to medicine (200) Computing (93)
Engineering and technology, agriculture (349) Architecture, Building and planning (66)
Biological sciences (214) Physical sciences (207) Mathematical sciences (88)
Arts Law (127)
Business and administrative studies (384) Education (189)
Librarianship and information (59)
Social sciences (302)
Languages and humanities (417) Arts (179)
Combined studies (54)
Most of the employment success measures applied in this study indicate clear differences between graduates from different types of institutions and different fields of studies. (See tables in Appendix III.)
• The findings suggest the relative advantages of old university graduates compared to new university graduates on the one hand, and the relative advantages of new university graduates compared to college graduates on the other. This is in line with other research findings suggesting the leading employers’ strong preference towards graduates from more established institutions (Brown and Scase 1994; Purcell and Hogarth 1999).
Old university graduates are usually happier with their jobs than new university graduates, who are in turn more satisfied than college graduates.
• In terms of subject differences, fields with the highest labour market value in most respects are computing and medicine. In addition, engineering, law and in some areas architecture, mathematical sciences and business studies can also provide above-average employment opportunities. On the other hand the least favourable outcomes – on average – can be expected in areas such as art, humanities and languages or biology.4
• Comparing the main categories of subjects, the labour market position of vocational science graduates in general proves to be more favourable, while the position of non-vocational arts graduates is less favourable than average. The relative positions of vocational arts fields and the non-vocational science areas are less clear, but they are definitely in-between the two extremes. The cut-off point between the types of fields is placed differently and also the extent of the differences varies across the various measures of employment success.
• Graduates who studied a non-vocational subject were almost twice as likely to be unemployed within the first three and a half years after graduation than those who studied a vocational subject (12% and 7%). Three and a half years after graduation there were 62% of non-vocational arts graduates working in a graduate level position, whereas the respective rate for vocational science graduates was 81%. Vocational subject graduates are more likely than non-vocational graduates to be in jobs which they perceive as graduate level and demanding, and there is a similar (although weaker) divide between science and arts graduates. The income difference between vocational science graduates and non-vocational arts graduates is around £5,600 a year. Non-vocational science graduates and non-vocational arts graduates are between the two extremes, but somewhat closer to the lower end of the scale. In terms of job-satisfaction, however, the only group that is significantly different – in the negative direction – from the others is that of non-vocational arts graduates.
2.2.2 Inequalities in access to institutions and subjects associated with good employment
outcomes
In the last section we saw how type of institution and field of study can determine employment success. In this section we look at relationships between social background and higher education studies and examine the social differences in access to institutions and subjects leading to different labour market values. In this way we will be able to show whether the unequal distribution of graduate labour market success between graduates from different social backgrounds (as seen in section 3.1) can be due to what and where people study.
The main conclusions from the analysis presented in the tables below are the following:
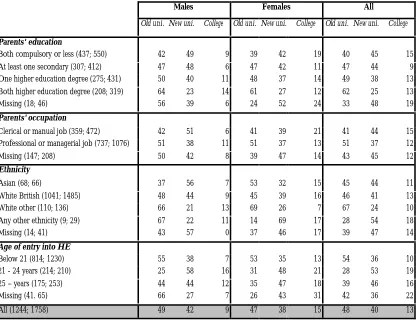
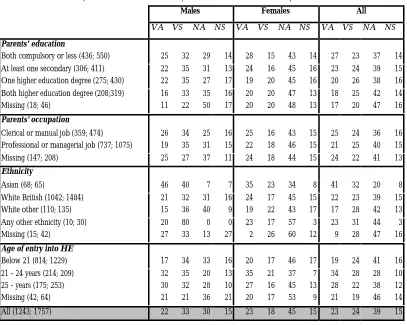
• Unequal access to different types of institutions is very likely to contribute significantly to employment inequalities among graduates from different social backgrounds. The proportion of old university graduates is around 40% among those from the least qualified families, whereas over 60% of graduates with both parents holding a degree studied in an old university. Subject choices show no clear tendencies of strengthening inequalities, though graduates from more affluent backgrounds are over-represented in some traditionally high-prestige areas such as law and medicine.5 As was shown in several earlier studies, field choices of lower social status, mature and also some ethnic minority groups tend to be more instrumental and are led by more direct employment expectations than those of other students(e.g. Connor and Dewson 2001).
• Type of institution can be a factor leading to relative labour market disadvantage for students over the traditional entry age, since younger students have much better access to pre-1992 universities. For example, more than half of the “traditional age” female graduates studied in pre-1992 universities, whereas only one third of the older ones did so. However, older students tend to choose fields with more direct employment relevance, i.e. better than average labour market prospects. The only high status field they are under-represented in is medicine.
4 Respective tables are not presented in this report but are available from CHERI. 5
Unequal access to different parts of the higher education system was discussed in the Dearing Report in 1997 and was analysed further in later studies (e.g. Forsyth and Furlong 2000; Connor et al 2001). What is important to emphasise here is that disadvantaged student backgrounds are not simply associated with “higher education of lower prestige” but through this with “degrees of lower labour market value”.
Table 2: Type of higher education institution attended by socio-biographical background (%)
Males Females All
Old uni. New uni. College Old uni. New uni. College Old uni. New uni. College
Parents' education
Both compulsory or less (437; 550) 42 49 9 39 42 19 40 45 15 At least one secondary (307; 412) 47 48 6 47 42 11 47 44 9 One higher education degree (275; 431) 50 40 11 48 37 14 49 38 13 Both higher education degree (208; 319) 64 23 14 61 27 12 62 25 13
Missing (18; 46) 56 39 6 24 52 24 33 48 19
Parents' occupation
Clerical or manual job (359; 472) 42 51 6 41 39 21 41 44 15 Professional or managerial job (737; 1076) 51 38 11 51 37 13 51 37 12
Missing (147; 208) 50 42 8 39 47 14 43 45 12
Ethnicity
Asian (68; 66) 37 56 7 53 32 15 45 44 11
White British (1041; 1485) 48 44 9 45 39 16 46 41 13
White other (110; 136) 66 21 13 69 26 7 67 24 10
Any other ethnicity (9; 29) 67 22 11 14 69 17 28 54 18
Missing (14; 41) 43 57 0 37 46 17 39 47 14
Age of entry into HE
Below 21 (814; 1230) 55 38 7 53 35 13 54 36 10
21 - 24 years (214; 210) 25 58 16 31 48 21 28 53 19
25 – years (175; 253) 44 44 12 35 47 18 39 46 16
Missing (41. 65) 66 27 7 26 43 31 42 36 22
Table 3: Subject studied by socio-biographical background (%)
VA= Vocational Arts; VS= Vocational Science; NA= Non-vocational Arts; NS= Non-vocational Science
Males Females All
VA VS NA NS VA VS NA NS VA VS NA NS
Parents' education
Both compulsory or less (436; 550) 25 32 29 14 28 15 43 14 27 23 37 14 At least one secondary (306; 411) 22 35 31 13 24 16 45 16 23 24 39 15 One higher education degree (275; 430) 22 35 27 17 19 20 45 16 20 26 38 16 Both higher education degree (208;319) 16 33 35 16 20 20 47 13 18 25 42 14 Missing (18; 46) 11 22 50 17 20 20 48 13 17 20 47 16 Parents' occupation
Clerical or manual job (359; 474) 26 34 25 16 25 16 43 15 25 24 36 16 Professional or managerial job (737; 1075) 19 35 31 15 22 18 46 15 21 25 40 15 Missing (147; 208) 25 27 37 11 24 18 44 15 24 22 41 13 Ethnicity
Asian (68; 65) 46 40 7 7 35 23 34 8 41 32 20 8
White British (1042; 1484) 21 32 31 16 24 17 45 15 22 23 39 15 White other (110; 135) 15 36 40 9 19 22 43 17 17 28 42 13 Any other ethnicity (10; 30) 20 80 0 0 23 17 57 3 23 31 44 3 Missing (15; 42) 27 33 13 27 2 26 60 12 9 28 47 16 Age of entry into HE
Below 21 (814; 1229) 17 34 33 16 20 17 46 17 19 24 41 16 21 - 24 years (214; 209) 32 35 20 13 35 21 37 7 34 28 28 10 25 - years (175; 253) 30 32 28 10 27 16 45 13 28 22 38 12 Missing (42; 64) 21 21 36 21 20 17 53 9 21 19 46 14 All (1243; 1757) 22 33 30 15 23 18 45 15 23 24 39 15
2.2.3 Class of degree
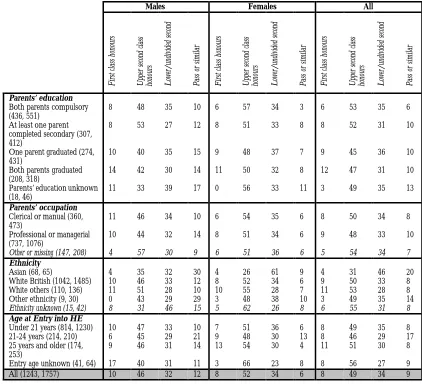
Academic achievement is also an important factor associated with employment success (as shown by CSU et al, 1999; Naylor et al 2001; Smith et al 2000 etc), and therefore it is crucial to investigate how it correlates with social background characteristics. Our data show that there is a slight tendency for graduates with better qualified parents to hold a first class honours degree more often than others. However, graduates with less educated parents are more likely to hold an upper second class degree than graduates from better qualified families. Consequently a largely similar proportion of these groups held a ‘good’ degree.
Both Asian males and females show a below-average level of academic achievement. This finding is in line with the HESA data and will be investigated further in the following section.
Table 4: Class of degree by socio-biographical background (%)
Males Females All
First class honours Upper second class honours Lower/undivided second Pass or similar First class honours Upper second class honours Lower/undivided second Pass or similar First class honours Upper second class honours Lower/undivided second Pass or similar
Parents’ education Both parents compulsory
(436, 551) 8 48 35 10 6 57 34 3 6 53 35 6
At least one parent completed secondary (307, 412)
8 53 27 12 8 51 33 8 8 52 31 10
One parent graduated (274,
431) 10 40 35 15 9 48 37 7 9 45 36 10
Both parents graduated
(208, 318) 14 42 30 14 11 50 32 8 12 47 31 10
Parents’ education unknown
(18, 46) 11 33 39 17 0 56 33 11 3 49 35 13
Parents’ occupation Clerical or manual (360,
473) 11 46 34 10 6 54 35 6 8 50 34 8
Professional or managerial
(737, 1076) 10 44 32 14 8 51 34 6 9 48 33 10
Other or missing (147, 208) 4 57 30 9 6 51 36 6 5 54 34 7
Ethnicity
Asian (68, 65) 4 35 32 30 4 26 61 9 4 31 46 20
White British (1042, 1485) 10 46 33 12 8 52 34 6 9 50 33 8 White others (110, 136) 11 51 28 10 10 55 28 7 11 53 28 8 Other ethnicity (9, 30) 0 43 29 29 3 48 38 10 3 49 35 14
Ethnicity unknown (15, 42) 8 31 46 15 5 62 26 8 6 55 31 8
Age at Entry into HE
Under 21 years (814, 1230) 10 47 33 10 7 51 36 6 8 49 35 8 21-24 years (214, 210) 6 45 29 21 9 48 30 13 8 46 29 17 25 years and older (174,
253) 9 46 31 14 13 54 30 4 11 51 30 8
Entry age unknown (41, 64) 17 40 31 11 3 66 23 8 8 56 27 9
All (1243, 1757) 10 46 32 12 8 52 34 6 8 49 34 9
2.2.4 Entry qualification
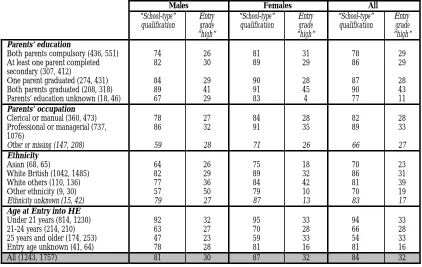
Educational achievements before higher education are also likely to have an impact on labour market opportunities (see e.g. DfEE 1999; Naylor et al mimeo; Smith et al 2000 etc). Graduates from the ‘traditional’ student groups enter higher education with a level 3 qualification significantly more often than other graduates. This holds for all the background factors examined such as parents’ social position, ethnicity and entry age. This certainly should not be a problem in itself, since many of the “access” policies aim to improve the accessibility of higher education for those without a school-type qualification (see e.g. Jary 2001). However, we will see that type of entry qualification often has a separate negative effect on labour market opportunities. From this it follows that the negative impacts of these pre-entry characteristics are often disproportionately at work among graduates from disadvantaged backgrounds.
Table 5: Type of entry qualification and entry grades by socio-biographical background (%)
Males Females All
“School-type”
qualification Entrygrade “high”
“School-type”
qualification Entrygrade “high”
“School-type”
qualification Entrygrade “high”
Parents’ education
Both parents compulsory (436, 551) 74 26 81 31 78 29 At least one parent completed
secondary (307, 412) 82 30 89 29 86 29
One parent graduated (274, 431) 84 29 90 28 87 28 Both parents graduated (208, 318) 89 41 91 45 90 43 Parents’ education unknown (18, 46) 67 29 83 4 77 11 Parents’ occupation
Clerical or manual (360, 473) 78 27 84 28 82 28
Professional or managerial (737,
1076) 86 32 91 35 89 33
Other or missing (147, 208) 59 28 71 26 66 27
Ethnicity
Asian (68, 65) 64 26 75 18 70 23
White British (1042, 1485) 82 29 89 32 86 31
White others (110, 136) 77 36 84 42 81 39
Other ethnicity (9, 30) 57 50 79 10 70 19
Ethnicity unknown (15, 42) 79 27 87 13 83 17
Age at Entry into HE
Under 21 years (814, 1230) 92 32 95 33 94 33
21-24 years (214, 210) 63 27 70 28 66 28
25 years and older (174, 253) 47 23 59 33 54 33
Entry age unknown (41, 64) 78 28 81 16 81 16
All (1243, 1757) 81 30 87 32 84 32
2.2.5 Other possible sources of disadvantage: interconnections of disadvantages in social
background
Accumulation of disadvantages in the social and demographic background can increase the labour market difficulties of certain groups of graduates. Students from lower socio-economic backgrounds studying as mature students are very likely to face difficulties due both to their age and to their social origins.
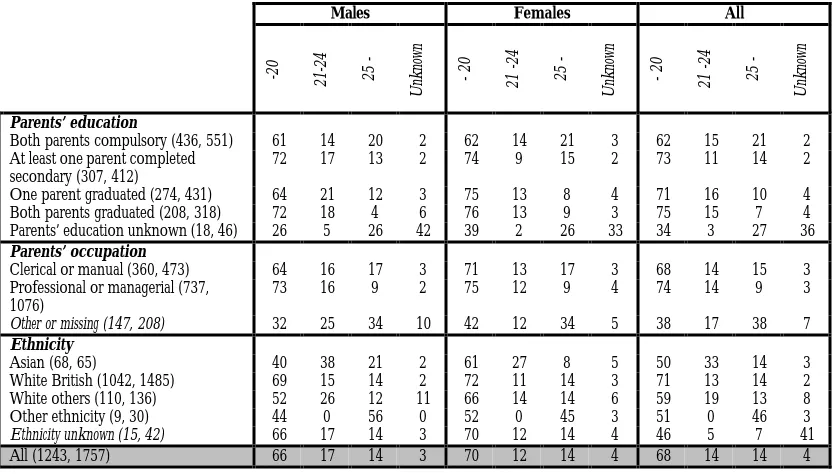
As pointed out in the Dearing Report, “individuals from those groups which have not, traditionally participated in higher education at 18 are increasingly doing so at later ages” (Dearing Report 1997, Section 7.14). Although there is some deviation from this pattern, consistently with previous findings our data suggest that graduates from lower socio-economic backgrounds are usually somewhat over-represented among those who started their studies after the traditional entry age. The differences are not notable in the 22-24 year old group, since quite a high proportion of students from middle class families start their studies at these ages. (This is in line with the findings of other studies e.g. Egerton 2001.) Nevertheless it is very unusual for them to enter higher education after the age of 24, whereas about one fifth of graduates with parents having only completed compulsory education start their studies in their late twenties or after. As we will see later on, in some respects these students are suffering from double disadvantages when entering the labour market.
Asian students tend to start their studies at later ages than their white British counterparts. However, in the case of women it usually only means a delay of a couple of years, while Asian men are strongly over-represented among the oldest age groups.6 Our data suggest that it is more common for Asian males with less qualified parents to enter higher education than it is for white males from similar origins. However, from earlier studies (Connor and Dewson 2000) we know that social class differences across ethnic groups in higher education show a fairly complicated pattern. They mirror not only the social class differences between ethnic groups in society but also the specific relationships towards education of the different ethnic groups.
Table 6: Age of entry into higher education by socio-biographical background (% )
Males Females All
-20 21-24 25
-Unknown - 20 21 -24 25 - Unknown - 20 21 -24 25 - Unknown
Parents’ education
Both parents compulsory (436, 551) 61 14 20 2 62 14 21 3 62 15 21 2 At least one parent completed
secondary (307, 412) 72 17 13 2 74 9 15 2 73 11 14 2 One parent graduated (274, 431) 64 21 12 3 75 13 8 4 71 16 10 4 Both parents graduated (208, 318) 72 18 4 6 76 13 9 3 75 15 7 4 Parents’ education unknown (18, 46) 26 5 26 42 39 2 26 33 34 3 27 36 Parents’ occupation
Clerical or manual (360, 473) 64 16 17 3 71 13 17 3 68 14 15 3 Professional or managerial (737,
1076) 73 16 9 2 75 12 9 4 74 14 9 3
Other or missing (147, 208) 32 25 34 10 42 12 34 5 38 17 38 7
Ethnicity
Asian (68, 65) 40 38 21 2 61 27 8 5 50 33 14 3
White British (1042, 1485) 69 15 14 2 72 11 14 3 71 13 14 2 White others (110, 136) 52 26 12 11 66 14 14 6 59 19 13 8 Other ethnicity (9, 30) 44 0 56 0 52 0 45 3 51 0 46 3
Ethnicity unknown (15, 42) 66 17 14 3 70 12 14 4 46 5 7 41
All (1243, 1757) 66 17 14 3 70 12 14 4 68 14 14 4
2.3
The effects of socio-biographical differences in the labour market when
educational factors are equal
In order to establish the importance of the different factors in determining graduates’ labour market success, a range of (linear and logit) regression analyses were conducted. In this way the separate impacts of the various background and educational factors introduced in the earlier sections can be identified and compared. Parameters for the models are presented in Appendix IV.
A technical note
Depending on the type of the outcome measure, two different kinds of models were estimated. For binary success measures, i.e. for those with two possible values (e.g. has been unemployed/has not been unemployed; graduate job/non-graduate job…) logit regressions were run. In these models the “odds” of being in one of the two possible categories are estimated. The odds for the baseline group is given by the “constant” of the regression. The “exponential (B)”-s in the tables can be interpreted as multipliers of the baseline odds getting into the corresponding category (e.g. being unemployed, having a graduate level job…) when compared to the baseline group.
For continuous variables linear regression models were estimated. Outcomes like the complex index (principal components) of the subjective level of job, middle-term career prospects and also salary and job-satisfaction are measured on continuous scales. It is sensible to ask the question therefore, how much change in these measures will result from one unit change of an explanatory variable. The “Unstandardised B Coefficients” presented in the tables can be interpreted as the change in the outcome measure when an explanatory factor is increased by one unit.
The key findings from these models are the following.
• The major part of the labour market inequalities across social background and entry age can be attributed to educational factors discussed in the earlier sections. In other words, when pre-entry qualification, type of institution, subject studied and class of degree are equal, background characteristics have a limited impact on employment.
• Nevertheless, the models also show that direct impacts of background do exist since the parameters that show the impacts of the various socio-biographical variables are statistically significant in more than one case. The existence of these significant direct effects suggests that selection related to socio-biographical factors does not finish at graduation, i.e. at the end of the educational career but continues in the early employment years.
In the following we first consider how the different educational characteristics influence the labour market circumstances of graduates when other factors are controlled for. We will see that most of these effects are systematically working against those from disadvantaged backgrounds, i.e. contribute to the indirect effects of the background. After this we will examine the direct impacts of socio-biographical characteristics.
Direct effects
• Graduating in itself will not fully compensate for not holding a school-type entry qualification. Graduates will still suffer from the negative consequences of their prior education after 3 to 4 years in the labour market. The only exceptions from this are male graduates who entered the university with a vocational or professional qualification. They are more likely to be in a graduate job than those who held a traditional, school-type qualification. However, the same circumstance can increase the risk of unemployment and can also be associated with a relatively low salary among females. Similarly, women with any other type of pre-HE qualification (access course, entry exam etc.) are more likely to feel overqualified for their jobs than their counterparts with A levels. A similar negative effect among males with any other type of entry qualification is that of a reduced likeliness of getting a managerial or professional job. Problems faced by men graduates who held no qualification at all when starting university were even more notable.
• Those who rated their entry grades as “medium” or “low” also experienced disadvantages irrespective of what and where they studied or their socio-biographical backgrounds. Male graduates with such school achievements are less likely to have a managerial or professional occupation; less likely to describe their job as a graduate-level one; less likely to call it demanding and challenging; and also have a lower salary than those with better entry grades. Females with low entry grades have a worse opinion about the level of their job, have poorer career prospects, earn less and are less satisfied with their employment situation than those with good entry grades.
• Class of degree earned also makes a considerable difference in the employment opportunities of graduates. The findings suggest that for females extra benefits (higher level jobs in subjective terms, higher level jobs in objective terms, higher income and job-satisfaction) are only available for those with a first class degree. At the same time there is only a very small difference evident between holders of upper second class or lower degrees. In the case of males however, there is very little extra benefit for a first class degree (only level of job – subjective measure), but a range of differences (level of job – subjective measure; most appropriate level of education, career-prospects, income, likelihood of unemployment and also satisfaction) can be found between those with an upper second class honours degree and those with lower class degrees.
• Subject studied also has a significant impact on all of the outcome measures applied here. For example, compared to law graduates, when other factors are equal, male graduates in art, languages and humanities, combined studies, social sciences and also in biology or physical sciences face a range of extra difficulties. At the same time, graduates in computing do better than law graduates in many respects. For females, field of study effects are somewhat more contradictory, showing relative advantages in one case but relative disadvantages in the other. Nevertheless, female graduates in computing, medicine and also in other subjects allied to medicine do in some respects better than law graduates, whereas those in combined fields are inevitably in a weaker position.
When all of the above educational characteristics and other background factors are equal, the differences that remain can be attributed purely to the direct effects of socio-biographical factors.
• In the case of males, parental education has a significant impact on income. Ceteris paribus, graduates who came from a family where parents completed only compulsory education or secondary school earn on average 9-10% less a year than graduates with both parents having a degree. At the same time they were also slightly less satisfied with their job (-0.173 on a 5-point scale) and they also rated themselves somewhat lower on the combined subjective measure of job level. Differences in job satisfaction suggest that it is not (purely) lower ambitions and job values that makes graduates from less educated families end up in lower level or less well paid jobs. If this was the case their aspirations could be still met and they would be equally satisfied as their counterparts from more educated backgrounds.
• Among females, the clearest disadvantage of those with less qualified parents is apparent when perceived level of job is looked at. Controlling for the other factors, first-generation graduates are only half as likely to feel that their qualification was necessary for their job than graduates with two graduate parents. When an objective measure (the Warwick occupation-categorisation) was used, only those with parents with secondary education proved less likely to have a graduate job than those with two graduate parents. This “moderately disadvantaged” group however is less likely to spend more than 5 months unemployed in their first couple of years in the labour market and also reported relatively good career prospects compared to those from more educated families.
• Our findings regarding ethnicity differences are not very systematic. Asian males are more likely to remain unemployed for a period of at least six months than those belonging to the ethnic majority but no other disadvantage is apparent when other factors are controlled for. Black males however seem to be in a relatively good position according to their own view about the level of job they are doing. Non UK white males are less likely than UK graduates to say that their job requires a degree.
• Asianfemales have clear advantages over their white British counterparts in terms of level of job, both according to the objective categorisation of occupations and to their subjective rating of it. Black female graduates are less happy with their jobs compared with members of the ethnic majority.
satisfaction with the work compared to the younger ones. On the other hand, entering higher education after the age of 24 has only negative effects, namely an increased risk of unemployment, poor career-prospects and a significantly smaller chance of being in a graduate job three and a half years after graduation compared with other graduates.
• Age of entry into higher education seems to have a similar impact among females. In their case too, entering HE between the ages of 21-24 has a positive effect, but only in terms of subjective feelings about the level of job. Starting the studies even later however has a negative impact on the likelihood of being in a graduate job, their salary-level and also on job-satisfaction. Both older age groups can expect less improvement in their employment positions in the medium term than younger graduates. The only moderate satisfaction level of the more mature group suggests that their lower salaries, levels of job etc cannot simply be attributed to more moderate ambitions but also reflect failures in fulfilling their job expectations.
2.4
How the effects of socio-biographical factors are mediated by field of study and
type of institution
In the above analysis it was implicitly assumed that social background has an identical (direct) effect on employment success wherever and whatever the graduate studied. However, there are several reasons to expect background effects to act differently in different contexts. In this section we will look at different types of subjects and institutions separately.
2.4.1 Field of study and the impact of social-biographical background
It is very likely that the characteristics of the graduates’ background have different levels of importance across the different areas of graduate employment, and that these differences are related to different types of subjects. The relationship between higher education and the labour market differs remarkably between various subject areas (Brennan and McGeevor, 1988; Silver and Brennan, 1988). In vocational fields there is a fairly strong and direct connection between higher education studies and the labour market. Field of study rather precisely determines the type of jobs the majority of the graduates will fill7. Professional knowledge or excellence (evidenced by academic achievements, earlier work experience) plays an important role in the recruitment process. At the same time they might also leave less room for soft criteria, among which discrimination and socially coded, cultural elements of “personality” can play a decisive role and strengthen the impact of socio-biographical background.
Table 13 indicates the proportion of employed graduates in our sample describing several factors as “very important” in their successful application for their current job. The main message here is that vocational graduates overall, and especially vocational science graduates, are more likely to encounter objective, more technical criteria such as field of study, class of degree or work experience than other graduates. At the same time vocational science graduates are less likely to feel that “personality” played a decisive role in their employment process. Although “personality” seems to be quite an important factor in the selection process in all types of subjects, its importance in vocational areas is also significantly ahead of other criteria. Among non-vocational arts graduates “personality” was described as the most important criteria in 45% of the cases, whereas the second most frequent criteria (“field of study”) was only 20%.
Table 7: Factors rated as “very important” in being recruited for the first job after graduation (%) (Multiple choice answers)
Field of study Class of degree
Practical work experience during
study
Personality Other8
Vocational arts (643) 40 17 24 47 6
Vocational science (671) 54 16 30 37 7
Non-vocational arts (1019) 20 10 16 45 9
Non-vocational science (375) 33 18 18 40 8
Total (2708) 35 14 22 43 8
In addition to the more loosely defined employment criteria in the non-vocational areas, we can also expect that in arts fields there is a higher emphasis on the verbal and linguistic skills of candidates than in the more instrumental science areas. Theories dealing with social class specific socialisation and cultural divisions between social groups (Bernstein 1977; Bourdieu 1973, 1986; Bourdieu and Passeron 1977) suggest that linguistic competency is a segment of personality most closely linked to one’s social and cultural origin and also the most rigid one. Verbal and written communication skills, strongly linked to cultural backgrounds are key factors in the recruitment for many high-level professional and managerial jobs (Brown and Scase 1994 and Purcell and Hogarth 1999). On the basis of these we might expect employment opportunities of graduates in arts subjects to be more strongly influenced by their social background than those of science graduates.
On the basis of the connections presented above we expect that in non-vocational (especially non-vocational arts) type fields of studies socio-biographical background has a greater impact on employment success than it has in vocational (especially in vocational science) areas.
To test this hypothesis, slightly different variations of the previous models were estimated and they were augmented by interaction effects. At first, the above main effect models were re-estimated introducing the 4-category subject measure rather than the fine one used earlier.9 Secondly, two-way interactions between parental education and type of field on the one hand and age of entry and type of field on the other were introduced. Three of the above models were revised in this way namely the models for (1) the level of job as measured by the IER study; (2) whether the graduate feels that the job requires a degree and (3) income. Again, separate models for men and women were estimated. Parameters of the models are presented in Appendix V.
By adding the described interaction effects to the baseline models, we get a statistically significant increase in the explanatory strength when income and also when the likelihood of being in a graduate job are estimated. (See tables in Appendix V) In other words, it is relevant and also sensible to separate the four different subject-areas, since graduates’ salary and the level of their jobs is affected by their parental backgrounds in different ways and to different extents depending on what they studied.
If other factors are equal, males from less qualified backgrounds who studied a vocational arts subject receive an income one third lower than those with two graduate parents in similar fields. However, there is no similar inequality observable in any other type of subject. On the contrary, in vocational science areas male graduates from lowly qualified families can even do better (in terms of likelihood of doing a graduate job) than those from more educated backgrounds. Among females, no similar systematic tendency was found.
8 “Other”= Other than: field of study; main subject / specialisation; class of degree; practical/work experience acquired during the course of study; practical/work experience acquired prior to the course of study; reputation of college/university; experience abroad; foreign language proficiency; computer skills; recommendations/references from third persons; personality.
In the case of males these results seem to support our hypotheses regarding the differences between vocational and non-vocational fields on the one hand, and arts and science fields on the other at least when income earned and level of job (in objective terms) are concerned. There is however no similar field difference observable in the probabilities of being in a job one feels overqualified for.
For a deeper understanding of these findings, a re-testing on a separate dataset with a greater sample-size would be desirable. Ideally, a finer categorisation of fields of study should be used. This would enable us to link income and other inequalities very precisely to certain subjects of studies, very likely to some (or maybe all) of the fields grouped into the vocational arts types (in the case of males). However, to get a real insight into the mechanisms operating here and to test the validity of the possible explanations for these subject-specific differences presented earlier, qualitative investigations among graduates and their employers will be needed.
A better specification of age effects within the various subject types could be achieved in relation to the likelihood of getting a graduate level job (rather than a graduate-track or a non-graduate one). Findings by gender are remarkably different. For males who start higher education between the age of 21 and 24, studying an arts field rather than a science one seems to be a more beneficial option than it is for any other age group. Regardless of whether it is a vocational or a non-vocational field, they are more likely to get a graduate level job in arts areas than others. They clearly do not have any similar advantage if they choose a vocational science subject, and are not likely to do so if they go into a non-vocational science field (although the respective parameter is not statistically significant here).
In case of women, however, those who start their studies after the traditional age and choose a non-vocational arts field seem to get a lower than average chance to find a graduate level job than their younger counterparts. No similar disadvantage attributable to their age is apparent in any other subject area.
2.4.2 Type of institution and the impact of socio-biographical background
The social, ethnic and age profiles of students differ substantially between institutions. Where certain sub-groups exist in sizeable numbers within a particular institution, their needs and expectations will tend to become ‘normalised’ within institutional cultures, policies and procedures. Students with disadvantaged background characteristics exist in greater numbers in new universities and colleges and it is these institutions which are generally more used, and probably more concerned, to meet their particular needs. We thus suggest a tentative hypothesis that the pre-1992 universities have less capacity (and perhaps less intention) to tackle the problems of socially disadvantaged members among their student body. Also we expect that the fact that they are not “exceptional” helps “non-traditional” students to fit into the new university environment more easily and so to benefit from the opportunities the institution provides (personal contacts, social skills etc.) more fully.
In consequence, we expect graduates from disadvantaged socio-biographical backgrounds who went to old universities to be more likely than graduates who went to other institutions to continue to carry their disadvantages after graduation.
graduates’ from old universities more intensively than it does graduates from other types of institutions.
Male graduates who started their studies after the age of 21 and studied in an old university have a notably lower chance to work in a graduate job – both according to the objective and the subjective criteria – three and a half years after graduation than the traditional age graduates. This is not at all the case however among new university graduates. In fact, in new universities as well as in colleges the 21-24 year old starting group seem to do even better than their younger counterparts concerning their level of job. In colleges however, the oldest group seems to be disadvantaged in terms of the objective job level measure as well as in income level. The findings are contradictory here though, since on the basis of their subjective judgements regarding the level of the job, older graduates from colleges appear to be in a better position than the younger ones. After having studied in an old university, female graduates who had entered university between the age of 21 and 24 have a worse chance of getting a graduate job than their traditional age counterparts. Older graduates from old universities face similar disadvantages in terms of the subjective level of job. Again, among those who had studied in a new university or a college no similar negative age effect is present. Older (25+) students in such institutions are certainly not in a worse position in the labour market than youngsters are. Those who studied in a college can even be ahead of the under 21 entry age group. Younger mature (21-24) graduates from the post-1992 universities and colleges also seem to have at least as good opportunities in the labour market as school leavers (under 21).
For traditional age group students, studying in a pre-1992 university will usually ensure some sort of additional employment advantage. But do mature students obtain any extra benefits in the labour market at all from studying in an old university rather than in a new university or a college? The findings here suggest that they do not.
The employment situation of male graduates who started their studies after the age of 24 will be very similar irrespective of the type of institution they attended. Those entering higher education between the age of 20 and 24 can even experience advantages from not going into an old university but studying in an ex-polytechnic instead. Women who studied as mature students experienced lower benefits from studying in an old university than younger graduates, though still experienced some benefits, especially in terms of getting a graduate job.
Parental background differences were more limited but still interesting here. First generation male graduates from colleges seem to have a lower chance of getting a graduate job and also earn less than their counterparts from more qualified families in the same type of institutions. This is however the only inequality of this type detected among males.
The case of females is remarkably different. First generation female graduates from both kinds of university have ceteris paribus a 60% lower chance of working in a job they consider as a graduate one than graduates with two graduate parents. In terms of the more objective level of job measures, only those from the least educated parental backgrounds have a relatively low chance of being in a graduate job and only if they studied in an old university.
2.5
Summary of this section
In this section we differentiated between two possible sources of the inequalities that graduates from disadvantaged backgrounds face in the labour market. Indirect effects of background occurred when graduates from disadvantaged backgrounds had worse than average experiences in the labour market because of features of their educational experiences and achievements. Our analysis shows that a large proportion of the additional employment difficulties faced by first generation graduates and those who entered higher education after the age of 2410 can be related back to factors such as
- Their under-representation in the pre-1992 universities;
- Their greater likelihood of holding a vocational or other type of entry qualification; - Their tendency to have poorer entry qualifications than others.
All these factors are associated with worse than average employment opportunities in themselves, irrespective of any other characteristics of the graduate. Selection of students from disadvantaged socio-biographical backgrounds into these kinds of “disadvantaged” educational tracks is taking place throughout the educational process.
The second way in which graduates from disadvantaged back