DIAGNOSTIC DELAY IN
PULMONARY TUBERCULOSIS -
A CROSS SECTIONAL STUDY
Dissertation submitted to
The Tamil Nadu Dr.M.G.R. Medical University
in partial fulfilment of the regulations
for the award of the degree of
M.D. (Community Medicine) - Branch XV
GOVERNMENT KILPAUK MEDICAL COLLEGE
THE TAMIL NADU DR. M.G.R. MEDICAL UNIVERSITY
CHENNAI, TAMILNADU
BONAFIDE CERTIFICATE
This is to certify that the dissertation titled ‘
DIAGNOSTIC
DELAY IN PULMONARY TUBERCULOSIS - A CROSS
SECTIONAL STUDY’
is the bonafide work of Dr. Jebamalar J, post
graduate student, Department of Community Medicine, Govt. Kilpauk
Medical College, Chennai for partial fulfillment of the requirement for
award of M.D. Degree (Branch XV) in Community Medicine by the
Tamil Nadu Dr. M.G.R. Medical University is a bonafide work done
by him at GOVT. KILPAUK MEDICAL COLLEGE, CHENNAI
during the academic year 2014-2017.
Prof. Dr. R. Narayana Babu, M.D., D.C.H, Dr. K. Mary Ramola,M.D
Dean, Professor & HOD,
Govt. Kilpauk Medical College & Hospital, Dept. of Community Medicine, Chennai-600 010 Govt. Kilpauk Medical College,
DECLARATION
I, Dr. JEBAMALAR J solemnly declare that the dissertation titled ‘DIAGNOSTIC DELAY IN PULMONARY TUBERCULOSIS- A CROSS SECTIONAL STUDY’ is a bonafide work done by me from July
2015 to July 2016 under the expert guidance and supervision of my guide Dr. Priya Senthil Kumar, Associate Professor, Dept. of Community Medicine, Govt. Kilpauk Medical College, Chennai-600010. This dissertation is submitted to Tamil Nadu Dr. M.G.R Medical University, towards partial fulfilment of requirement for the award of M.D. Degree (Branch – XV) in Community Medicine, April 2017.
The study was conducted in Zone VIII of Chennai Corporation. I have not submitted this dissertation previously to any university for the award of any degree or diploma.
Place: Chennai Dr. JEBAMALAR J,
Date: Post Graduate,
M.D Community Medicine,
DECLARATION
I, Dr. Priya Senthil Kumar, D.G.O., M.D, Associate Professor, Department of Community Medicine, Govt. Kilpauk Medical College and Hospital declare that this dissertation titled ‘DIAGNOSTIC DELAY IN PULMONARY TUBERCULOSIS – A CROSS SECTIONAL STUDY’, has been prepared under my expert guidance and supervision by Dr. JEBAMALAR J, for her partial fulfilment of the regulations for the award of the degree M.D Community Medicine by the Tamil Nadu Dr. M.G.R Medical University and the examination to be held in April 2017.
Place: Dr. Priya Senthil Kumar, D.G.O., M.D,
Date: Associate Professor,
Department of Community Medicine, Govt. Kilpauk Medical College
ACKNOWLEDGEMENT
I gratefully acknowledge and sincerely thank Prof. Dr. R.
Narayana Babu, M.D., D.C.H, Dean, Govt. Kilpauk Medical College,
Chennai for granting me permission to utilize the facilities in this
institution for my study.
I would like to express my sincere and profound gratitude to
Prof. Dr. K. Mary Ramola, M.D., Head of the Department, Department
of Community Medicine for her motivation and valuable suggestions
and for providing all the necessary arrangements for conducting this
study.
I am indebted to Dr. Priya Senthil Kumar D.G.O., M.D,
Associate Professor, for her help in meticulous guidance, expert advice
and constant encouragement in every step of my study.
I am grateful to Dr. R. Senthil Kumar D.C.H., M.D, Associate
Professor for his inspiration and constant help in preparing this
dissertation.
I wish to thank my Assistant Professors, Dr. J. Anaiappan, Dr. S.
Varakumari, the tutors and all my colleagues for their support and
valid suggestions.
I thank our Institutional Ethics Committee for their guidance and
approval for this study.
I thank profusely the City health officer, Chennai Corporation
and Dr. Lavanya, Programme Manager, RNTCP, for her support,
encouragement and expert guidance in this study. I owe my sincere
acknowledgement to all the Senior Treatment supervisors, Senior
Treatment Laboratory Supervisors for all their support during the
study.
I thank God Almighty and my mother for their blessings in
successfully completing my study.
My sincere appreciation and thanks to all participants and their
family in this study and to all the well-wishers who have contributed in
CONTENTS
SL.NO
TITLE
PAGE NO.
1
INTRODUCTION
1
2
JUSTIFICATION
6
3
OBJECTIVES
13
4
REVIEW OF LITERATURE
14
5
MATERIALS & METHODS
46
6
RESULTS
56
7
DISCUSSION
80
8
CONCLUSION
84
9
RECOMMENDATIONS
85
10
LIMITATIONS
86
ANNEXURES
SL.NO
TITLE
I
INSTITUTIONAL ETHICAL COMMITTEE APPROVAL
CERTIFICATE
II
PERMISSION FROM CORPORATION OF CHENNAI
III
QUESTIONNAIRE – ENGLISH
IV
QUESTIONNAIRE- TAMIL
V
INFORMATION TO PATIENTS AND CONSENT FORM
VI
TAMIL CONSENT FORM
VII
LIST OF ABBREVIATIONS
VIII
LIST OF TABLES
IX
LIST OF FIGURES
X
KEY TO MASTER CHART
1
DIAGNOSTIC DELAY IN PULMONARY TUBERCULOSIS: A CROSS SECTIONAL STUDY
1.
INTRODUCTION:
"Chopin coughs with infinite grace." - George Sand in a letter to Madame d’Agoult1
1.1History:
From great writers like Anton Chekov, George Orwell, musicians like Chopin, mathematicians like Srinivasa Ramanujam, leaders like Muhammad Ali Jinnah to the common man, consumption, or more accurately tuberculosis spared none.
‘The White plague’ - thus named in the nineteenth century, has its evidences
stretching even back to 3000 - 2400 BC in ancient Egypt1. Such an ancient disease still has its roots in this world, even with the advances in modern medicine and scientific technology.
1.2 Disease:
2
leads to infection of the individual. Tubercle bacilli affecting the lungs is pulmonary tuberculosis2.
Infection of organs other than lungs i.e lymph nodes, bones, pleura, abdominal organs, nervous system, genito-urinary tract, is termed as extra-pulmonary tuberculosis. Infection of an individual does not necessarily lead to the disease. Progression from infection to disease is determined by a number of additional factors including HIV co-infection, diabetes mellitus, substance abuse, and malnutrition. When a person progresses from infection to disease, they may not experience obvious symptoms for a long time, (e.g cough, fever, hemoptysis, weight loss etc). This might lead to delays in diagnosis and treatment seeking. Without proper treatment, around 45% of the HIV negative individuals with TB and almost all of the HIV/TB co-infected will die3.
1.3 Control of TB:
For the control of tuberculosis, early case finding, diagnosis and management are the three key components. They are discussed subsequently.
3
1.3.1 Screening & diagnosis:
The WHO manual on systematic screening for active tuberculosis, provides the following recommendations.
Systematic screening for TB in high risk groups such as HIV infected individuals, contacts of TB cases and workers who are exposed to silica.
Screening to be considered in prisoners, those who seek health care in high prevalence areas, populations with poor access to health care e.g Urban slums, marginalized groups, homeless, refugees and migrants4.
1.3.2 Approaches to screening:
The recommended screening approaches for high risk groups are screening using symptoms and chest radiography.
a. Symptom screening:
– Cough >2 weeks – Haemoptysis – Weight loss – Fever
4
b. Screening with Chest radiography 1.3.3 Diagnostic testing:
The diagnostic algorithm for Tuberculosis is as follows5
The current diagnostic tests which are recommended for usage are: Sputum LED microscopy: (Using Auramine O’stain)
Liquid culture and drug sensitivity testing system. Rapid molecular tests e.g Xpert MTBB/RIF test
Standardized tuberculin skin testing can be used in the pediatric age group in addition to other tests.
5
1.4 Management:
Tuberculosis is curable, provided diagnosis and treatment are made early. Drug susceptible, active disease is treated with a treatment regimen lasting for 6 months with four anti tuberculous drugs. The patients are provided with information, support and supervised treatment by the health workers or trained volunteers. This is the basis for DOTS (Directly Observed Treatment Short course). Such support is essential to maintain treatment adherence and also aids in reducing the spread of infection to others. From 2000 to 2014, it is estimated that 43 million lives have been saved through timely diagnosis and treatment of tuberculosis6.
6
2.
JUSTIFICATION
2.1 History of TB control: 2.1.1 World level:
History of Tuberculosis in modern medicine had its origins with the work of Theophile Laennec during the early 19th century. Robert Koch identified the microbe in 1882. Von Pirquet developed the Tuberculin skin test, and used it for the demonstration of latent tuberculosis infection in asymptomatic paediatric population. Sanatorium treatment for tuberculosis was started first before the introduction of chemotherapy. In addition, procedures were developed to address the collapsed cavities, and to rest the infected area of lungs1.
BCG vaccine was introduced during post World War I. India introduced BCG mass immunization in 1948. Currently it is a part of the universal immunization program7.
In 1991, WHO established the 70% case diagnosis and the 85% cure rates to be achieved by 2000. TB was declared to be a global emergency by 1993. DOTS was launched as the WHO strategy in 1995. Stop TB partnership was launched in 1998 and it aimed for a dramatic reduction of the global TB burden by 2015 in line with Millennium Development goals8.
7
TB and their communities’ was included. This component affirmed the ongoing need for promotion of communication, advocacy and social mobilization to influence policy changes and sustenance of commitment. ‘Patients’ charter for Tuberculosis care’- a set of good practice rules to apply
to health care delivery was promoted. This was done in order to facilitate community participation in the care of TB patients9.
In the year 2014, the World Health Assembly was attended by the Ministry of Health in 194 countries. The post-2015 ‘End TB strategy’ was adopted and the member countries took a pledge to implement it. Ending the TB epidemic is the ‘Sustainable Development goal’ target for 2050. End TB strategy has been targeted to end the global epidemic of TB, by reducing the deaths due to TB by 95% compared to 2015, reduction in the number of new cases by 90% between 2015 to 2035, and to make sure that no family is burdened by catastrophic expenditure due to TB. The slogan adopted was ‘Unite to end TB’. The vision is to have a world free of TB and zero disease,
death and suffering due to the disease10.
2.1.2TB control in India
8
strategy. It included additional components such as empowering patients and their communities, addressing MDR-TB and HIV/TB. NACP & RNTCP developed the National Framework of joint TB/HIV collaborative activities. Later, National Strategic Plan was included in the 12th Five year plan, with a vision of TB free India. The goal of this National Strategic Plan is to have universal access to high quality TB diagnosis and care to all individuals of the community. Its objectives are
90% notification rate for all TB cases
90% success rate for all newly treated cases and 85% success rate in case of re-treatment cases
Significantly improving the treatment outcomes for drug resistant TB cases
Decreasing the mortality and morbidity in HIV-TB co-infected individuals
Improving the outcomes of TB care in private sectors5.
9
the National Strategic plan. It extends the provision of care to those in the private sector as well.
Ending the global epidemic of TB and eliminating its social and economic burden is a feasible goal. Failure to do so, is expected to carry serious consequences both individually and globally10.
In order to improve the case detection rates from the previous 70% to the recommended 90% some of the issues that need be addressed are delay in the diagnosis of TB and associated factors.
2.2 Global burden
Around a third of the world’s population is infected by the tubercle bacillus. This means that they have been infected by Mycobacterium tuberculosis but have not yet developed the disease11. According to the WHO global report of 2015, worldwide, around 9.6 million cases have been diagnosed out of which, 1 million are children, 3.2 million are women and 5.4 million are men6. Out of all those cases, 58% of the cases were from Western Pacific & South-Eastern Asian regions.
10
In addition, tuberculosis is one of the top five causes of death among women in the reproductive age group. In 2014, around one million children developed tuberculosis and one lakh and forty thousand people died due to the disease6.
People with latent TB infection have a 10% risk of developing the disease in their life time. But, people with compromised immunity, e.g HIV/AIDS, diabetes, malnutrition, tobacco use have a still higher risk of developing the disease. More than 20% of the tuberculosis cases all over the world are attributable to smoking3. HIV infected individuals have 20-30 times more risk of developing the active TB. In 2015, one out of three HIV deaths are due to tuberculosis3.
2.3Indian burden:
At present, roughly one-fourth (23%) of the global burden of TB is accounted for by India. Out of 9.6 million cases occurring every year, 2.2 million cases occur in our country. This roughly translates to an incidence of 167 lakh cases/year. The prevalence of tuberculosis infection in India is 40%, i.e 2.5 million cases of all forms of tuberculosis. This amounts to 195 lakhs cases/year. The number of deaths due to the disease is 2.2 lakhs which comes to 17 lakh deaths/year5.
11
conditions. Their risk of acquiring the disease is enhanced by factors such as overcrowding, poor ventilation, malnutrition etc2.
In addition, India has the highest burden of both tuberculosis and multidrug resistant tuberculosis and ranks as the second highest in HIV associated tuberculosis, according to the global report of tuberculosis published in 20156. Among the notified cases of pulmonary tuberculosis occurring every year, 71,000 cases are MDR-TB. HIV-TB co-infected cases numbered 1.1 million in 2014, and among them, 31,000 died.
By the time a smear positive tuberculosis is diagnosed, almost 30 to 40% of their contacts are found to be infected. If such a case is left undiagnosed, and thus untreated, a still larger proportion of individuals who are exposed to them will be at an increased risk of getting the infection and acquiring the disease6.
Some key factors, which determine an individual’s exposure risk to Mycobacterium tuberculosis are
1. The prevalence of active TB cases in the community. (The disease burden)
2. The duration of infectivity of the untreated cases
12
Among the above three factors, the duration of infectivity of the untreated cases is important, since it determines the duration and extent of risk to which the general population is exposed to.
In order to address this issue, early case detection along with prompt management with Anti tuberculous treatment will reduce the duration of infectivity of the cases, and thus reduce the risk of exposure in the community12.
Hence, since the advent of world level and national level programs for tuberculosis, some of the key components which have been emerging are addressing the delay in diagnosis and seeking care. Addressing the social determinants on the patients’ side, which lead to delays in diagnosis, addressing the delay in provision of health care, using rapid diagnostics and universal access to services are needed for disease control.
13
3. OBJECTIVES
1. To estimate the patient delay in the diagnosis & treatment of pulmonary tuberculosis.
14
4. REVIEW OF LITERATURE
The review of literature for this dissertation was carried out using PubMed and Google scholar. The key words for literature search were ‘diagnosis’, ‘delay’ and ‘tuberculosis’. The individual study articles were
critically appraised one by one and presented.
4.1 Organization of the literature:
The studies included in the literature review have been categorized under the following sections
Measures to control tuberculosis- fixing the targets for case detection and cure rates.
The trend of case detection & cure rates over time Strategies for improving case detection
Health seeking behaviour among chest symptomatics Diagnostic delay in tuberculosis
Shift from Stop TB to End TB Current situation
4.2 Literature review
4.2.1 Fixing targets for Case detection and Cure:
15
tuberculosis. Its strategy was to render the cases non-infectious as soon as possible, that the chances of them spreading the infection to others got reduced. The global targets were 70% case detection and 85% cure rates.
Case detection rate according to WHO is the notification rate of new smear positive cases divided by estimated incidence rate. Cure rate is defined as the proportion of the new smear positive TB cases that were declared cured through treatment13.
In 1998, Dye et al, had developed a mathematical model to explore tuberculosis control and forecast effects of intensified case finding in the six WHO regions. The case detection rates and cure rates at the time of study i.e1998 were 63% and 57%. According to this study, in the absence of HIV co-infection, ensuring the target of 70% case detection and 85% cure was projected to reduce the incidence rates by 11% per year and the mortality rate by 12% per year. DOTS strategy has a greater impact on the prevention of mortality rather than cases. This difference is accentuated in HIV-TB coinfection. If the targets for both case detection as well as cure rates are achieved by 2010, 18 million cases and 7.3 million deaths could be averted in South East Asian region including India14.
4.2.2 Case detection and cure rates over the years:
16
rates for smear positives was 51%. They had concluded that excepting Tanzania, Peru and Vietnam, none of the 22 countries with high incidence had achieved TB control targets. Such slow progress was of great concern in 16 countries in particular. i.e India, Nigeria, Indonesia, Pakistan etc15.
According to a study by Dye et al, (2000) 148 out of 212 countries had adopted the DOTS strategy. Although only 27% of the smear positive patients had been notified under DOTS, there still remained a huge gap between the expected 70% case detection and that current status of 27%. The authors then focused on the 22 high burden countries. Although there had been a significant expansion of DOTS coverage in terms of geography, the case detection had been constant at around 40-50 %. Even with full coverage under DOTS, roughly three- fourths of undetected sputum smear positive cases will still be living in India, Indonesia, China, Pakistan, Nigeria & Bangladesh. The study emphasized the need of developing case finding methods to manage the gaps between the current and target case detection rates16.
17
In a study by Dye et al (2003), it was found that, the incidence of TB had been on the rise globally, yet, prevalence, incidence and mortality rates were almost stable or had decreased in 7 regions. The exception was the HIV-co infected regions of Africa. The case detection rate globally under the DOTS programme had risen from 11% in 1995 to 45% in 2003. It was projected to reach 60% by 2005. The treatment success rate was more than 80%, with greater than 17 million cases undergoing treatment in the DOTS programme. Hence in order to reduce the prevalence by 50% it was recommended to reach the global targets and to decrease the incidence rate at 2% per year. For reducing the death by 50%, a much steeper decrease in incidence was required at 5-6% decline in incidence/year18.
18
4.2.3 Strategies for improving case detection: 1. Active case finding:
In a study by Becerra et al, in 2003, it was found that household screening & contact tracing improved case detection rates for tuberculosis. They compared active & passive case finding approaches in a high incidence town in Lima, Peru. The results of the study showed that prevalence of TB detected through active vs. passive case finding among household contacts were 0.91% and 0.18% respectively. Among the neighbours of TB patients, the prevalence was 0.22% and 0.08% respectively. Hence the case detection rates among symptomatic contacts and neighbors were significantly higher. Thus the authors suggested that, a combined approach of active & passive case finding may improve case detection rates than passive case finding alone20.
19
symptoms of TB, so that more people seek health care. Focusing case finding strategies on symptomatic surveys and further screening of symptomatics would be a cost effective method21.
In a study by Heller et al (2006), the two population intervention measures viz. case finding and DOTS strategy were compared. The study was conducted in India, utilizing national data and published literature. Data on the incidence/prevalence of smear positive TB cases was included. Relative risk reduction resulting from an increased case finding and use of DOTS were computed. From the results, it was observed that, while the DOTS strategy might prevent 0.188 deaths from Tuberculosis, increasing the case finding would prevent 1.79 deaths in comparison. The costs of DOTS were 5960 International dollars while in contrast, the costs for increasing the case finding were 4839 Int. dollars. Hence it was recommended to prioritize interventions to the populations22.
20
and significant transmission of the disease. Expanding the diagnostic facilities, actively involving the health extension workers was recommended for early case detection and management of tuberculosis23.
2. Referral of Chest symptomatics:
Another approach that was being studied was intensified referral of chest symptomatics. Bai et al (2007) in Hunan, China, used a public-private mix (PPM) model. They included the village doctors and private sector for intensified identification of TB suspects and prompt referral. They traced the referred TB suspects, if they fail to report to the TB clinics. Through this strategy, the referral of TB suspects increased five-fold during the project year. The latter strategy of patient tracing did not yield significant results24.
3. Training of health care personnel:
Wahyuni et al (2007) in Indonesia, assessed the obstacles for case detection of TB in primary health care. They found that there was a need for improvement in knowledge of health care staff on tuberculosis. Among the laboratory technicians only 55% had been able to identify all the positive sputum smear slides. Training of health care staff tuberculosis control was recommended in order to improve case detection & diagnosis of TB25.
4. Involving community level health workers:
21
detection and treatment success rates. After the intervention, the mean case detection rate in the intervention group was 122.2% compared to 69.4% in the control group. The treatment success rates were higher as well, estimated at 89.3% vs 83.1% in the intervention and control groups respectively26.
The authors concluded that involvement of health extension workers improves the case detection and treatment success rates in smear positive cases. The authors recommended implementing this approach especially in low health service coverage settings and where there is shortage of health workers.
Calvin et al, (2009) evaluated community level health interventions to improve case detection of TB in Tanzania. Training of traditional healers/pharmacists on referring TB suspects, training TB patients on raising community awareness, sensitizing community leaders on TB control were some of the interventions that were implemented.
Two years after the implementation of this approach, the notification rates for smear positives had increased by 68%. The referral network with traditional healers, pharmacists etc. contributed to 38-70% of the new TB cases notified.
22
recommended further research to include cost-effectiveness analysis, for determining the best combination of such community based activities27.
5. Early health care seeking for cough symptoms:
Sekandi et al (2009), studied active case finding in undetected tuberculosis in a peri urban slum of Uganda. They found that 20% of the study population were chronic coughers, and among them, 18% had TB. They concluded that while active case finding approaches can supplement the routine DOTS, its feasibility and cost effectiveness need additional evaluation. In addition, there needs to be an increased emphasis on early health care seeking for cough symptoms28.
Determinants of case detection for TB:
Daniel Okuonghae in Nigeria(2009) carried out a survey to study the determinants of case detection for TB. The authors mentioned that the case detection had remained consistently low and was 21% in 2003, while the treatment success rate was 59%. Some key recommendations from the study were- raising awareness on TB through media, active case finding of chest symptomatic patients with cough >2 weeks, free diagnostics and treatment facilities for TB and routine testing in high density areas such as schools, markets etc29.
Risk factors for inadequate case detection:
23
HIV negative, the median duration of cough was 6.9 months. The authors recommended increasing suspicion of TB among women and older age groups for improving the case detection30.
The trend through the years:
In the study conducted by Lukudu et al in 2009 in Sudan, the trend of case detection was assessed over time from 2002-2009. It was found that the case detection rates remained consistently low over time, well below 50% of the expected for those years. The treatment success rates on the other hand remained high and stable at 80% on average. The consistently low case detection rates necessitated the study of health seeking behaviour among chest symptomatics31.
4.2.4 Health seeking behaviour among chest symptomatics:
24
Kasse et al (2006), in Gambia33 assessed the health seeking behaviour, health system experience and case finding in TB among individuals with cough. Among the individuals with cough, 81% had sought health care and the median time to seek health care was 2 weeks32.
Zhang et al, (2007) explored the perceptions regarding TB and health care seeking behaviour among rural patients. The study concluded that 60% of respondents were able to identify cough for prolonged duration as one of the main symptoms of TB and 40% perceived that tuberculosis was transmitted by close interaction with a TB patient. Socio-economic status had an association with the respondents’ perception of the disease. Lower levels of education, income and increasing age were identified as being less likely to seek health care, or seek care at a cheaper place. In conclusion, the authors have mentioned that social stigma and perceptions regarding TB influence the health care seeking behaviour. And hence, accessibility and affordability issues have to be addressed in addition to expanding the DOTS approach34.
25
A study was conducted by Rumman et al (2008), on the prevalence of TB suspects and their health care seeking behaviour. Among those surveyed, they identified 2.51% as TB suspects. Their first action after the onset of symptoms was to seek health care by visiting health centres. The accessibility of health care facilities and confidence in obtaining cure were the reasons mentioned for timely seeking of health care. Economic constraints and belief that the symptoms would be self-resolving were the obstacles to seeking timely health care. The authors recommended upgrading the centres and training the health workers on suspect management in TB36.
26
community levels on TB, especially among urban and the older age groups. The increase in knowledge levels coupled with the behaviour change was emphasized in chest symptomatics, older age groups and the previously treated TB patients37.
Yimer et al (2009) studied health care seeking behaviour among PTB patients and suspects in rural Ethiopia. As per the findings of the study, a majority of TB cases (82.5%) and TB suspects (78%) took health care actions for their symptoms. There was median delay of 30 days before the first action was taken. Those having a prior history of TB or with prolonged duration of cough were more likely to visit a medical health care provider. The authors recommended involving all health providers in case finding, and making rapid TB diagnostic testing available at even the lowest health care levels for improving the case detection38.
27
health care facility, and instead obtained treatment from informal sources. Involvement of informal sources for early referral of TB suspects, creating awareness among the public on TB was recommended to help reduce the delays in commencing treatment39.
Biya O et al in 2010 conducted a study on knowledge, care seeking behaviour and factors associated with patient delay among PTB patients in Nigeria. In this study, multiple care seeking and unsatisfactory knowledge of TB were associated with patient delay. The authors recommended strategies to promote early health care seeking in DOTS centres and sustained awareness on TB40.
Ghosh S et al (2010) studied the care seeking behaviour of chest symptomatics in a slum in West Bengal. The prevalence of chest symptomatics was found to be 5.5%. Among them, three- fourths sought relief from a health care provider, 70.8% did within 2 weeks, with a median duration of 7 days. Work pressure (25%), less severe symptoms (56.3%) and health care costs (18.7%) were the reasons identified for delay in seeking care through this study41.
Sathyanarayana et al (2011) conducted a study in India on the health care seeking among patients having cough for ≥ 2 weeks. Among the 4562 people interviewed, 437 (9.5%) reported having a cough of ≥ 2 weeks in the
28
areas, as well as northern and eastern zones of the country. The authors inferred that relying on passive case finding alone was insufficient, and hence it was necessary to review the current approaches in India. The need of further studies was emphasized to understand why the chest symptomatics did not seek health care42.
Hoa et al (2011) studied the health seeking behaviour among adults with chronic cough in Vietnam. They conducted a cross sectional survey and used history of cough/ATT/Chest X ray as screening tools. Prolonged productive cough was reported by 4.6% of the study participants. Among them 44% sought health care in places such as pharmacies, public hospitals, commune health posts and private health care physicians as their first point of contact. Only 7% had undergone a sputum smear examination. Of the symptomatics, 2.9% were diagnosed with TB. The mean patient delay was 4.1 weeks among cough suspects and 4 weeks in TB cases. The authors concluded that the study finding highlighted the need to improve diagnostic practices by retraining staff on sputum smears examinations for TB suspects43.
29
facilities visited after the onset of symptoms. There was a median total delay of 11 weeks and a median health system delay of 3 weeks. Some of the factors associated with patient delay were older age, long walking distance to a public health care facility and urban residence. The factors associated with prolonged health system delay were male gender and initial visit to a non-TB care provider. The authors recommended improving the access to care, educating patients, engaging the informal health care providers and strengthening public-private models for TB control in order to have a positive impact on treatment delay44.
In a study by Engeda EH et al (2015) in Ethiopia, it was found that 39.1% of the TB suspects had not visited a modern health care facility during the study period. Factors that were associated with not seeking a modern health facility included older age, educational level and unemployment. The authors recommended that interventions targeted at reducing unemployment, improving literacy rate, improving socio-economic status would be needed for reducing delays45.
4.2.5 Diagnostic delay in Tuberculosis:
30
patients’ side. The significant factor associated with doctor delay was failure
to perform Sputum AFB. Low diagnosis rates were seen in particular among rural government institutions and private practitioners. The authors recommended decentralizing the diagnosis and management of TB program in Ghana, making sputum microscopy widely available along with providing rigorous training to health personnel46.
In a systematic review carried out by Sreeramareddy CT et alusing research articles published between 1990-2008, the health seeking behaviour of chest symptomatics as well as suspicion of TB among them were found to be inadequate. Hence if there is a significant delay in diagnosis, active case finding, rather than passive case finding was recommended as one of the strategies to address this issue.
According to these studies, total delay ranged from 25 – 185 days, patient delay: 4.9 – 162 days and health system delay: 2 – 87 days. The delays were similar on the patients’ as well as health system sides averaging 28.7 days and 25 days respectively47.
31
other studies, there was no relationship between delay and knowledge about TB, socio-economic status, education and gender. Stigmatising attitudes especially linking HIV and TB were not associated with longer delays. Investment in improving the health system, ensuring accessibility for groups such as older patients and the more disabled were recommended to reduce the delays in diagnosis and thus help in control of TB48.
Rajeswari et al (2002) in India, studied the factors associated with patient and health systems delays in the diagnosis of TB. The median patient delay, health system delay and total delays were 20 days, 23 days & 60 days respectively. Among the patients, 29% delayed care seeking for more than a month. Among them, 40% attributed the delay to the lack of awareness on TB. Residing at a distance of >2 km from a health care facility and alcoholism were also associated with a greater patient delay. In 69% of the patients the health system delay was >7 days. Shorter duration of cough, first visit with a private health provider were some of the factors associated with health system delay. Total delay resulted mostly from a long patient delay when government health care providers were consulted first, and when private providers were consulted first, it was associated with a long health system delay
32
possibility of TB during the examination of out-patients was also suggested49.
Selvam JM et al(2003), studied the health care seeking behaviour of new smear positive TB patients. Among the study participants, 65% contacted a health care provider within 28 days, 47% of these contacted a government health care provider and 53% contacted a non-governmental provider. Median total delay, patient delay and provider delay were 62 days, 28 days and 28 days respectively. Health care provider delay was 9 days in the government sector and 50 days with the private providers. Smoking and mode of travel were significantly associated with patient delay. First consultation with a private health care provider and residing at a distance of >5 km from the health care facility were associated with provider delay. Among the participants, 25% took >2 actions before being diagnosed. The study authors recommended that the community awareness on TB needed to be increased. Greater involvement of the private sector in the RNTCP was mentioned to be essential for reducing the provider delays50.
33
1 week and median total delay was 10 weeks. The prevalence of doctor delay was 18%. Similar to other studies, patient delay was the most frequent delay observed and also contributed to majority of the total delay. Unlike some other studies, there was no significant association of patient delay with factors such as socio-demographic characters such as age, gender, education etc. Only 74% of the patients went to some type of health care facility as the first point of contact. 26% of the patients sought chemists, prayer houses as their first point of contact. The authors recommended patient education on TB to help reduce delay in the initiation of treatment51.
Kiwuwa et al (2005) studied the patient and health services delay in PTB. They also analysed the factors contributing to such delays. The median total delay till the initiation of treatment was 12 weeks. The patients often sought treatment in pharmacies or private clinics more than government health care facilities as initial contacts. Hospitalization, alcohol consumption, perceiving smoking to be a cause for TB were some important predictors of patient delay. On the health care side, >2 health seeking encounters/month was an independent predictor. Educational status and perceived stigma on TB were not associated with both delays.
34
Tobgay et al in 2006 conducted a study on the predictors of treatment delay for TB in Sikkim. The study reported median patient and health system delays of 21 days & 7 days respectively. Among the participants 17% reported a patient delay of >30 days and 49% reported a health system delay of >7 days. Factors associated with patient delay were self-medication and use of traditional healers as the first point of contact. Independent predictors of health systems delay were first point of contact with private doctors and treatment cost. The recommendations made by the authors included efforts to increase awareness on avoiding self-medication, availability of free treatment, training of traditional healers, private doctors in treatment of TB53.
35
WHO Eastern Office for the Eastern Mediterranean conducted a multi country study in 2006, on the diagnostic and treatment delay in TB. The entire duration from the time of symptom onset till treatment was categorized and factors causing treatment delay were identified. The results of the study showed that mean duration of delay from symptom onset till ATT initiation ranged from 1.5 to 4 months in different countries. Patient delay ranged from 9.9 days to 69 days. System delay ranged from 5 to 75 days. Some of the main determinants of delay included,
Socio-demographic: Illiteracy, residing in suburban areas Economic factors
Stigma
Time taken to reach the health facility
Seeking health care from non-specialized individuals Visiting >1 health provider before being diagnosed.
The conclusion from that study was that there was an unacceptable delay among all countries in the treatment of TB. In a few countries, it was mostly attributed to delayed diagnosis, while in others, it was also due to inadequate health seeking behaviour12.
36
Availability of medical insurance was found to be associated with a shorter patient delay55.
Leung et al (2007) studied the delayed presentation and treatment of newly diagnosed PTB patients in Hong Kong. Among the study participants, 42.6% presented to the private doctors first, while 57.4% to the public health care sector. Among those presenting to the private sector, 13.7% were diagnosed with TB while in contrast, 86.3% of the patients presenting to the public health care facilities were diagnosed. The median patient delay as well as health care provider delay were 20 days56.
Factors which were associated with a longer patient delay included smear & culture positivity and unemployment. The predictors for longer provider and total delays were age >60 years, no initial sputum smear examination and chest X ray diagnostics. In conclusion, non-specific presentations and adverse social factors are associated with prolonged patient delay, while older age groups, unavailability of bacteriological/radiological evidence were associated with diagnosis and treatment delays.
37
accessibility, rural residence, visit to a lower level government health care facility/private practitioner or a traditional healer, poverty, old age, female gender, substance abuse e.g alcoholism, low educational status, low levels of awareness on TB, stigma and self-treatment. Thus it was inferred that the core issue in diagnosing and treating TB was repeated visits to the same health care. This resulted in non-specific treatment with antibiotics along with failure to access TB services. But once TB was diagnosed, treatment had been initiated within a reasonable time period57.
Basnet et al (2009) conducted a similar study in Nepal for identifying the reasons for delay in diagnosis and treatment of TB. In 2006, the case detection rate of smear positive TB was 64% and the treatment success rate in 2005 was 88%58. The other results of the study were as follows: There was a median patient delay of 50 days, median health system delay of 18 days and median total delay of 60 days. Smoking >5 cigarettes/day had a higher risk for patient delay and health system delay. The authors recommended increasing the public awareness regarding TB and expanding health facilities with quality assurance to help in reducing the diagnostic delay.
38
Lock WA et al (2011), studied the determinants for patient delay in TB suspects. The authors studied the TB suspects registered at the lung clinics. Among them, the median patient delay was 14 days, ranging from 0 to 145 days. Patients with multiple symptoms reported to the health care earlier. Factors such as marital status, education, occupation, self-medication, using traditional medicines and visiting traditional healers were significantly associated with the patient delay.
As to health care seeking, accessibility in terms of distance and travel time were significant factors in choosing the type of health care sought, rather than the quality of services rendered there. The conclusion arrived at this study was, accessibility of health care providers was the main determinant for patient delay, although the roles of psycho-social factors could not be excluded entirely. Suburban and urban areas have relatively better access to health care and hence the delay is lesser60.
A systematic review was performed by Ngangro et al (2012) on the determinants of TB diagnostic delay in countries with limited resources. According to this study, some of the factors associated with delay were
Low income Rural life Ageing
39
Initial visit to a non-skilled professional or a traditional healer
The authors recommended active case finding strategy for helping diminish the diagnostic delays in high endemic, low income countries. Marital status, occupation, residence (urban ⁄ rural), highest education,
socio-economic status, usage of self-medication/traditional medicine, visiting a traditional healer or the serious symptom of haemoptysis were significantly associated with patient delay61.
40
41
The authors have mentioned that, the study data did not show an increased mortality among patients with delay in diagnosis. The limitations of the study which were acknowledged are:
1. The study evaluated only the health system delay and not the patient delay.
2. The study was conducted in a single centre and hence may not be generalizable to other settings
3. Data collection was retrospective and might not be as accurate and complete.
Despite such limitations, the study concludes that studying factors associated with delayed diagnosis has an impact in the transmission dynamics of TB. Hence identifying the sources of delay is a critical issue for effective TB control63.
42
barriers for access to health care and integrating informal sectors for the control of TB64.
Hamza et al (2015) performed a study on the delay in diagnosis among PTB patients in Oromia, Ethiopia. Among the patients enrolled, 36.7% experienced patient delay, 49.7% health system delay and 48.9% total delay. The median patient delay, health system delay and total delays were 30 days, 9 days and 40 days respectively. Poor knowledge regarding TB, self-treatment, alcoholism and lack of money for health related expenditure were independent predictors for patient delay. Predictors for health system delay were visiting multiple health care providers & HIV negative status. Thus the authors concluded that patient delay contributed to 4.4% of the total delay in diagnosis of PTB. Community based interventions were needed to address the issues of self-treatment and lack of knowledge regarding TB65.
43
the healthcare system towards decentralizing the diagnosis and management of TB, training health care providers, collaboration with the non-formal health care providers and raising the public awareness about TB66.
Cai J et al conducted a systematic review and meta-analysis on the factors associated with patient & provider delays for diagnosis and treatment of TB in Asia. Some factors identified for patient delay were low income, unemployment and smear positivity. Consultation at a public hospital was one of the factors associated with the provider delay. Male gender and long distance to a health care facility correlated with both patient and provider delays. The authors suggested that availability, in particular, timeliness of public health providers should be the primary concern for policy makers. However, they acknowledged that the studies included were not comparable because of their weak study designs and various cut off points were used for the duration of delays, particularly the provider delay. They mention the need for further studies with stronger study designs for establishing causality. In addition, the need for a standard definition of delay has also been emphasized to facilitate more appropriate comparison across the various studies67.
4.2.6 The shift from Stop TB to End TB strategy:
44
Development Goals. It also marks the watershed from the Stop TB strategy to the End TB strategy6.
The vision of Stop TB strategy was a TB free world. Its goal was to dramatically reduce the global burden of TB in accordance with the Millennium Development Goals. The targets were 1) To halt and reverse the incidence of tuberculosis by 2015. 2) By 2015, to reduce the prevalence and deaths due to TB by 50% compared to a baseline of 1990 and 3) By 2050, to eliminate Tuberculosis as a public health problem9.
The End TB strategy in contrast had a vision to end the Global TB Epidemic. The year 2015 was taken as the baseline. The targets were 1) 90% reduction in the number of deaths by 2030, and 95% reduction by 2035. 2) 80% reduction in TB incidence rate by 2030 and 90% by 203510.
4.2.7 Current Situation:
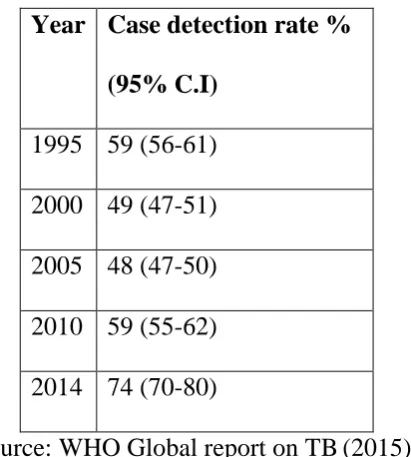
As per the statistics in the 2015 Global TB report, 6 million TB cases were reported to the WHO in the year 2016. Which means, that among the 9.6 million cases world-wide, only 2/3rds or less cases have been reported. In other words, 37% of the cases were left undiagnosed or left out from being reported. India has achieved the 2015 MDG goals of 50% reduction in prevalence and 50% reduction in mortality rate compared to 19906.
45
Table 1: Case detection rates over the years
Year Case detection rate % (95% C.I)
1995 59 (56-61) 2000 49 (47-51) 2005 48 (47-50) 2010 59 (55-62) 2014 74 (70-80)
Source: WHO Global report on TB(2015)6
46
5. MATERIALS & METHODS
5.1 Study Design: Cross sectional study
5.2 Study duration:
July 2015 to July 2016
5.3 Target population:
Patients with pulmonary tuberculosis.
5.4 Study population:
Newly diagnosed pulmonary tuberculosis patients on intensive phase of Category 1 ATT in Zone VIII of Chennai Corporation.
5.5 Sample population:
Pulmonary tuberculosis patients who are registered in Zone VIII during the study period on intensive phase of Category 1 ATT.
5.6 Inclusion criteria:
Age ≥18 years
Resident of Chennai Corporation Zone VIII Undergoing Category I ATT- intensive phase
5.7 Exclusion criteria
HIV/TB co-infected patients (since they are being screened for chest symptoms during their visits to the ART clinics)
5.8 Sample size:
47
Hence taking P as 69.4% with 5% alpha error and relative precision (E) of 10%, using the formula
N=(Zα/2)2(PQ) E2
the sample size is calculated to be 177. Including 10% of non-responders, the corrected sample size is 197.
5.9 Sampling Method:
Around 20 patients are being registered every month at the three Tuberculosis units of Zone VIII. Thus it was estimated that it will take approximately 10 months to reach the required sample size. After obtaining approval from the Institutional Ethics Committee, all patients satisfying the inclusion criteria who are registered at the three Tuberculosis units of Zone VIII were taken up for the study till the desired sample size was reached.
5.10 Data collection procedure:
The protocol was submitted to the Institutional Ethical Committee for approval.
After obtaining IEC approval, permission to conduct the study was obtained from the Corporation of Chennai after getting the requisition forwarded from the RNTCP Programme manager.
• Zone VIII of Chennai Corporation has Three Tuberculosis Units,
48
• Each Tuberculosis Unit has DOTS centres in its treatment area.
DOTS services are provided on alternate days. Viz Monday, Wednesday, Friday or Tuesday, Thursday and Saturday.
• The Tuberculosis Units were visited by the investigator and
permission was obtained from the Medical Officer- TB Control.
Zone VIII
Villivakkam TU
Ayanavaram
Villivakkam
ICF
Railway hospital
Aminjikarai TU
V.S Puram
Aminjikarai
ITM
Kilpauk Medical
College
Azad nagar
MMDA TU
MMDA
Anna Poorani
nagar
49
• With the help of Medical Officer- TB control & Senior Treatment
Supervisor, the patients satisfying the inclusion criteria were identified and enrolled in the study.
• Patients were interviewed when they came for DOTS to their
respective DOTS centres.
• The procedure was continued till the desired sample size was reached.
5.11 Questionnaire:
A standardized WHO questionnaire on diagnostic delay (ANNEXURE III) adopted from a study on Eastern Mediterranean regions12 was used for this study. It was translated into the local language Tamil (ANNEXURE IV) using a TB expert and a Tamil Professor, then back translated & compared. The questionnaire was pilot tested to check for discrepancies and modified. After explaining the study details to the participants and obtaining informed consent, it was administered by the investigator using the interview method. The questionnaire had sections pertaining to the following:
Socio demographic characteristics
Co-morbidities: Diabetes, Hypertension, COPD
Onset of symptoms: Cough, fever, loss of weight, haemoptysis
Health care seeking behaviour for symptoms – health care provider or others
50
Satisfaction with care offered at health facilities Stigma & knowledge on TB
Delays in the diagnosis and treatment of TB – patient delay, health system delay, diagnosis delay, treatment delay and total delay.
5.12 Study variables
5.12.1 Independent variables:
1. Patient related: Age, gender, educational status, occupation, income, place of residence, marital status, smoking status, health seeking behaviour, knowledge & stigma regarding tuberculosis
2. Health system related: Satisfaction with care offered at health facilities, time taken to reach health facilities
5.12.2 Dependent variable:
Total delay in the diagnosis & treatment of tuberculosis.
5.13 Operational definitions:
5.13.1Occupation: Classified according to the Minimum wages act68
Unskilled: Performing simple duties which require experience of no or little independent judgement or prior experience, though familiarity with occupational environment is necessary. In addition to physical exertion, their work may require familiarity with a variety of articles/goods.
51
the judgment, skill, for proper discharging of duties assigned to them, or a relatively narrow job and where others make important decisions. The work is thus limited to performance of routine operations of limited scope.
Skilled: One is capable of working efficiently, exercises independent judgment, discharges duties with responsibility. They must possess a comprehensive knowledge of the trade/industry in which they are employed.
Highly skilled: One who supervises the work of skilled employees.
5.13.4Residence: Urban residence:
‘Towns (places with municipal corporation/municipal area committee, town committee, notified area committee or cantonment board), places having 5000 or more inhabitants, density not less than 1000 persons per square mile or 390 per square kilometres and at least three-fourth of adult male employed other than agriculture’2.
Urban slum residence:
52
facilities or any combination of such factors which are detrimental to the safety and health69. Residences which are enlisted as slums in Census data were categorized as ‘Urban Slum’
5.13.5Health care facility:
All Government & Private health facilities manned by a qualified health care provider12.
5.13.6Pulmonary tuberculosis:
Refers to any bacteriologically confirmed or clinically diagnosed case of tuberculosis involving the lung parenchyma/trachea bronchial tree2.
5.13.7Total delay:
The time interval between the onset of illness to the initiation of Anti-tuberculous drugs. It is the sum of diagnostic delay and the treatment delay. The delays are measured in days.
5.13.8Diagnostic delay:
The time interval from the symptom onset till the diagnosis of tuberculosis
5.13.9Treatment delay:
53
5.13.10 Patient delay:
The time interval between symptom onset and the presentation to a health care provider.
5.13.11 Health care system delay:
The time interval between the date at which the patient seeks a health care provider and the initiation of anti-tuberculous treatment.
5.14 Timeline: January- February 2015 •Protocol writing
March 2015 •Departmental review
April- June 2015 •Institutional Ethics Committee submission
July 2015 •IEC approval
54
5.15 Data management & statistical analysis:
The data thus collected is entered in Microsoft Excel and analysed using the trial version of Statistical Package for Social Sciences version 22.
5.15.1 Descriptive statistics:
The numerical variables are expressed in means and categorical variables as percentages. Since means are sensitive to outliers, medians with interquartile ranges are presented in addition to means.
The scores for stigma, knowledge and satisfaction with care are reversed before addition to their respective domains. Hence high scores for knowledge and satisfaction with care indicate high levels of knowledge & satisfaction respectively while high score for stigma indicates high levels of stigma relating to tuberculosis.
The delays in the diagnosis and treatment of tuberculosis are presented as mean duration days with 95% confidence intervals as well as median with interquartile ranges.
5.15.2 Inferential Statistics:
55
<0.05 is taken as statistically significant. Patients’ satisfaction with care offered at the health facilities are compared across gender and delay using Mann Whitney U test, since the responses are not normally distributed and hence non-parametric tests are to be applied.
56
6. RESULTS
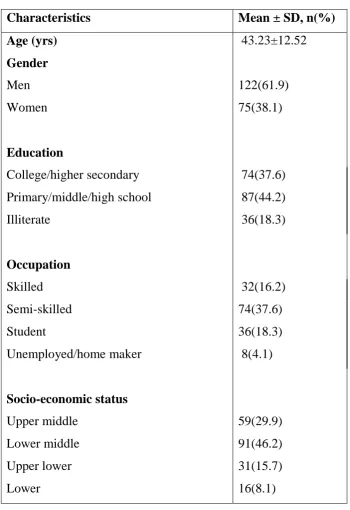
[image:67.595.134.485.202.712.2]6.1 The socio demographic profile of the study participants is mentioned in table 2.
Table 2. Socio demographics
Characteristics Mean ± SD, n(%) Age (yrs) 43.23±12.52
Gender
Men 122(61.9)
Women 75(38.1)
Education
College/higher secondary 74(37.6) Primary/middle/high school 87(44.2)
Illiterate 36(18.3)
Occupation
Skilled 32(16.2)
Semi-skilled 74(37.6)
Student 36(18.3)
Unemployed/home maker 8(4.1)
Socio-economic status
Upper middle 59(29.9)
Lower middle 91(46.2)
Upper lower 31(15.7)
57
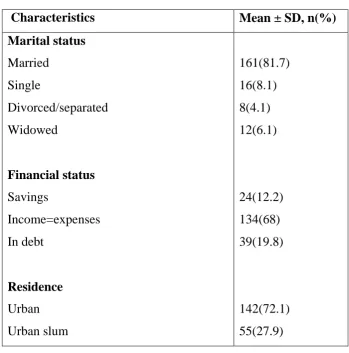
Table 2. Socio demographics (continued)
Characteristics Mean ± SD, n(%)
Marital status
Married 161(81.7)
Single 16(8.1)
Divorced/separated 8(4.1)
Widowed 12(6.1)
Financial status
Savings 24(12.2)
Income=expenses 134(68)
In debt 39(19.8)
Residence
Urban 142(72.1)
Urban slum 55(27.9)
From table 2, it is shown that the mean age of the study participants was 43.52 years, ranging from 18 to 70 years. Roughly two-thirds of them were men (61.9%).
58
With regard to occupational status, 37.6% of the study participants were semi-skilled employees, 16.2% were skilled employees, 18.3% were students, while only 4.1% were unemployed or home makers in case of women. While in the WHO study of 200612, majority (43%) of the study participants were unemployed or home makers.
Most of the study participants were married, (81.7%) while a very less proportion of them were single, divorced/separated or widowed. The proportion of married individuals is greater than the WHO 2006 study12, where the proportion of married and single individuals were almost equal in the participant countries.
A majority of the study participants reported that their income was just adequate to meet the general expenditure. One-fifth (19.8%) reported being in debt and the rest had savings. Thus in a majority, the cost incurred due to illness would be an additional financial burden on their family.
Around one-fourth (27.9%) of the participants were from urban slums and the rest from urban areas.
Substance abuse & contact history:
59
years. The median daily consumption of cigarettes was 5, ranging from 2 to 20.
Alcohol consumption was reported by 23.9% of the study participants. Around one-fifth (22.3%) reported having been exposed to a known case of tuberculosis.
Table 3. Substance abuse and Contact history
Variables n(%)
Smoking
Never 112(56.9)
Current 66(33.5)
Ex-smoking 19(9.6)
Daily consumption of cigarettes
Median(IQR) 5(3- 5)
Range 2- 20
Smoking duration in years
Median(IQR) 15.5(10- 20.75)
Range 2 - 40
Alcohol 47(23.9)
60
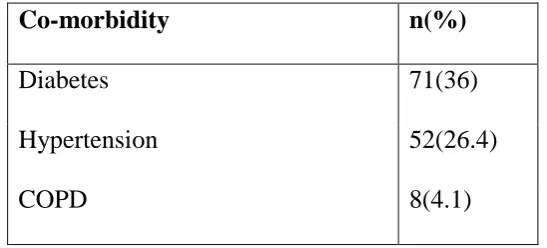
Co-morbidities:
[image:71.595.172.446.265.389.2]Around 66.5% of the study participants had various co-morbidities. The common co-morbid illnesses are listed in table 4. Hence in addition to anti-tuberculous treatment, factors such as management of co-morbid illnesses and drug interactions also play a role.
Table 4. Comorbidities in tuberculosis patients (N=131) Co-morbidity n(%)
Diabetes 71(36)
Hypertension 52(26.4)
COPD 8(4.1)
6.2Patient related factors:
6.2.1 Symptoms & their duration
61
Table 5. Symptoms and duration
Symptoms n(%)
Mean ± SD (days)
Median(IQR)
Cough 142(72.1) 38.25±21.38 30(21-45) Fever 19(9.6) 10.8±3.66 10(7-14) Loss of weight 11(5.6) 1.77±1.09 2(1-2) Haemoptysis 62(31.5) 8.36± 3.74 7(5-10) Chest pain 44(22.3) 5.16±2.55 5(3-7)
Reasons for delay in seeking health care
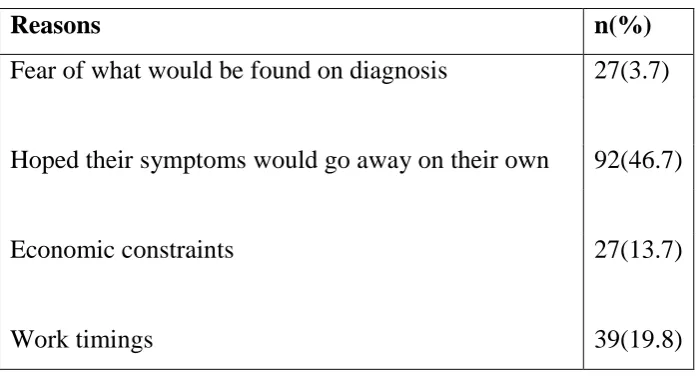
Patients were asked regarding their reasons for delay in seeking care for their symptoms. The perceived reasons for delay in seeking care are mentioned in table 6. Some of the reasons stated were, being afraid of what would be found on diagnosis (3.7%), hoping the symptoms would go away on their own (46.7%), economic constraints (13.7%) & inconvenient timings(19.8%).
Table 6. Perceived reasons for delay
Reasons n(%)
Fear of what would be found on diagnosis 27(3.7)
Hoped their symptoms would go away on their own 92(46.7)
Economic constraints 27(13.7)
[image:72.595.135.485.579.769.2]
62
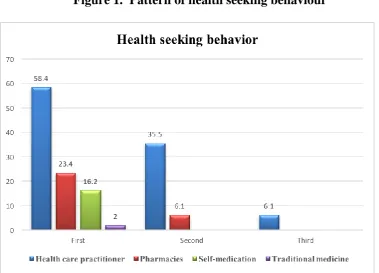
6.2.2 Health seeking patterns for symptoms:
The health seeking behaviour of the study participants is mentioned in table 7. Almost two-thirds of the patients sought health care providers for their symptoms. Next to health care providers, 23.4% of the patients sought pharmacies for treatment. Participants reported using over the counter medications due to reasons such as easy accessibility and availability. Other patients reported self-medication (16.2%) using drugs that were already present at home, due to prescription for some previous illness etc. If their symptoms were not relieved by measures such as over the counter medication & self-medication, the patients reported seeking a health care provider as the next point of contact for their symptom relief.
Table 7. Health seeking behaviour with the onset of illness Health seeking behaviour n(%)
First action
[image:73.595.149.469.444.637.2]63
Figure 1. Pattern of health seeking behaviour
6.2.3 Knowledge and Stigma regarding tuberculosis:
Knowledge on tuberculosis was measured using questions such as ‘is TB hereditary, contagious, curable, duration of treatment’ etc. The proportion of individuals who provide the correct answers are compared across genders using Chi square test.
64
Table 8. Patients’ knowledge about tuberculosis
Questions Men Women
Chi square statistic
df p value
What kind of a dise