Effects of blasting on the stability of paste fill stopes at Cannington Mine
39
0
0
Full text
(2) Chapter 8 - Numerical Model Results and Discussion. 8. Numerical Model Results and Discussion The results of the numerical models are presented in the following chapter. A description of each model is given in Chapter 7. As discussed in section 7.3, the numerical modelling was conducted in a three stage process, with a set of models created for each stage. The stages were as follows: •. Stage 1: A single column of explosive in paste fill;. •. Stage 2: A single column of explosive in rock; and. •. Stage 3: Columns of explosive in rock adjacent to paste fill.. 8.1. Stage 1 Model: Single Column ofExplosive in Paste Fill 8.1.1.. Stage 1 Model Scenarios. As discussed in section 7.3.2, the stage 1 model was based on the field instrumentation tests discussed in chapter 4. In these tests, blast holes within the paste fill were detonated and monitored in order to obtain a representative equation for predicting peak particle velocity within paste fill. The purpose of the stage 1 model was to validate the numerical model against data obtained in the field instrumentation tests, and to model the effects ofthe cement and solids content of paste fill on the transmission of blast waves within the material.. The field. instrumentation test data was used for validation ofthe model as it ensured that the transmission of blast waves within paste fill was being modelled correctly. Although blasting within the paste fill would not normally occur, it was considered necessary to conduct the field instrumentation tests and model this scenario to ensure that the transmission of the blast wave through the paste fill could be correctly modelled. The transmission of blast waves through rock and across the rock/paste fill interface were modelled in stages 2 and 3. The scenario modelled in this case can be defined as follows: •. The blast is through one 3 m long, 44 mm diameter borehole containing one cartridge of emulsion explosive;. •. The borehole is located in a uniform mass of paste fill;. •. The paste fill/rock interface is located at a sufficient distance from the blast hole that effects ofthe reflection ofthe blast wave from the interface are negligible; and. •. The borehole is drilled perpendicular to the floor of the tunnel.. 149.
(3) Chapter 8 - Numerical Model Results and Discussion The stage 1 model was run for the mixes of paste fill shown in Table 7.1. An input file for a stage 1 model with a solids content of 76 % and a cement content of 4 % is given in Appendix F.. 8.1.2.. Stage 1 Model Results and Discussion. 8.1.2.1.. Comparison ofModel Results and Field Data. The results from the run of model 1 for a paste fill mix of 76 % solids and 4 % cement content was compared against the data obtained during the field instrumentation tests as shown in Figure 8.1. The model results are also compared against the peak particle velocity predicted by the ppv equation and the constants obtained for paste fill from the field instrumentation tests. The form of the ppv equation is given in Equation 4.5.. The charge weight for the field. instrumentation tests was 170 g.. -. 0.9 0.8 ~. •. 0.7. \. .§. ~ 0.6 u o. Cii. ~ 0.5. \. \. U. 1:: ~. 0.4. rf.. 0.3. ...... \. "\. 0.2 0.1. Numerical Model (76% Solids, 4% Cement). ". Field Data (76% Solids, 3.5% Cement). •. ~. --.--~. ". o o. ppv Equation based on Field Data. •. 2. 4. 6. D _ --.. -----.- - . 8. 10. 12. 14. Distance from Blast (m). Figure 8.1 - Stage 1 Model Results and Field Instrumentation Test Data As can be seen, for distances greater than or equal to 2 m from the explosive in paste fill the model matches the field data and the predicted peak particle velocity quite closely.. For. distances less than 2 m from the explosive source the model overestimates the peak particle velocity. The model overestimates the peak particle velocities close to the explosive source as the crushing and cracking mechanisms that occur in the vicinity surrounding the borehole are not considered in the numerical model.. 150.
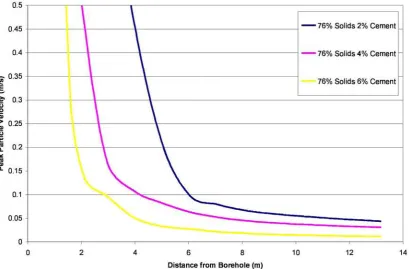
(4) Chapter 8 - Numerical Model Results and Discussion As discussed in section 6.6, the blast pressure was applied to the walls of a cylindrical "equivalent cavity" in order to model only the seismic zone around the borehole, in which elastic wave propagation is expected to occur. This method avoids modelling the region where new cracks in the material are initiated from the shock wave during an explosion as the blast is applied at a point where the strength ofthe material is greater than the stresses experienced from the shock wave.. This allows the propagation of the blast wave within the material to be. modelled without the need to use complex material models and cracking models. For large scale models such as those used in this work, the use of an "equivalent cavity" dramatically reduces the time required to solve the model. In production blasts, the blast holes are located within the rock and the rock/paste fill interface is generally located beyond the region where cracks are initiated. Since the purpose of this project is to predict the behaviour of the paste fill adjacent to blasting, the ability to model the cracking mechanism in paste fill was not considered necessary. The velocity waveforms produced by the numerical model were also compared against field data. The shape of the velocity profile predicted by the numerical model is similar to the field data.. 8.1.2.2.. Damage to Paste Fill. Figure 8.2 shows the deformed mesh and the stress experienced in the model in the area the blast was applied. As can be seen, the numerical model predicts localized deformation only, which agrees with observations during the field tests.. 8.1.2.3.. Effect of Cement Content on Peak Particle Velocity. The stage 1 model was run for mixes of paste fill with different cement contents and solid contents to observe the effect these changes have on peak particle velocity. A comparison offill mixes with 76 % solids and 2 %, 4 % and 6 % cement content is shown in Figure 8.3. Figures 8.4 and 8.5 show similar comparisons for mixtures with 78 % and 80 % solids respectively. The results show that the peak particle velocity in the paste fill decreases as the strength of the paste fill is increased by increasing the cement content. This in tum means that the damage caused to the paste fill by blasting decreases as the cement content is increased.. 151.
(5) Chapter 8 - Numerical Model Results and Discussion. S.,. Hi~~e~~. Cr it.: 7,=1~) - +6. 586e+05 +6.0 38e+05 +5. 48ge+05 +4.940e+05 +4.392e+05 +3.843e+05. (A";l~.. . •. + 3 .29 =,e+O'=,. I.. +2.746e+05 +2.197e+05 +1.64ge+05 +1. lOOe+05 1 +5. 51 3e+04 - +2. 608e+02. Blast hole Damage due to blast. Figure 8.2 - Stress in the Region ofthe Blast Load. 0.5. \. 0.45 0.4 ~ 0.35. g ~. 0.3. Ll. o. Cii. >m 0.25 "i3. 1:: ~ -"= l'll. 0.2. D.. 0.15. \ \ \ \ \ \ \ \ \. ~. Cll. 0.1. 0.05. -. 76% Solids 2% Cement. -. 76% Solids 4% Cement. 76% Solids 6% Cement. \. ~ '------. o o. 2. 4. 6. 8. 10. 12. 14. Distance from Borehole (m). Figure 8.3 - Stage 1 Model Results for Paste Fill with 76% Solids Content. 152.
(6) Chapter 8 - Numerical Model Results and Discussion. ,. 0.5. \. i. 0.45 0.4. -. 78% Solids 2% Cement. -. 78% Solids 4% Cement. Ul 0.35. 78% Solids 6% Cement. §. ~ u o. ~Gl. 0.3. :e. ...~. 0.2. II... 0.15. \ \ \. \. 0.25. \ \. ;:;. lIS Gl. 0.1. ". \. ~'---. 0.05. o. o. 2. 4. 6. 8. 10. 12. 14. Distance from Borehole (m). Figure 8.4 - Stage 1 Model Results for Paste Fill with 78% Solids Content. ,. 0.5 0.45. -. t f. 0.4. rr. 80% Solids 6% Cement. Ul 0.35. §. ~ u o. ~Gl. 80% Solids 4% Cement. \ 0.3 0.25. ;:;. :e. ...~. 0.2. II... 0.15. \. lIS Gl. 0.1. "'--.. 0.05. o o. 2. 4. 6. 8. 10. 12. 14. Distance from Borehole (m). Figure 8.5 -Stage 1 Model Resultsfor Paste Fill with 80% Solids Content. 153.
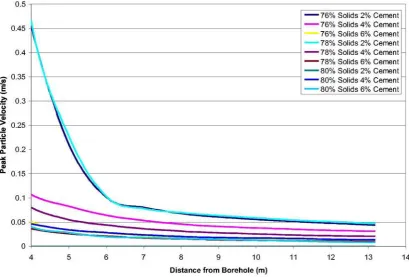
(7) Chapter 8 - Numerical Model Results and Discussion. 8.1.2.4.. Effect ofSolids Content on Peak Particle Velocity. The stage 1 model was run for mixes of paste fill with different cement contents and solid contents to observe the effect these changes have on peak particle velocity. A comparison offill mixes with 6 % cement and 76 %, 78 % and 80 % solids content is shown in Figure 8.6. Figures 8.7 and 8.8 show similar comparisons for mixtures with 4 % and 2 % cement respectively. The results show that the peak particle velocity in the paste fill decreases as the strength of the paste fill is increased by increasing the solids content, when the cement content is low. For a cement content of6 %, the results were similar for all solids contents. This in tum means that the damage caused to the paste fill by blasting decreases as the solids content is increased when the cement content is low.. 8.1.2.5.. Comparison between Effect of Cement and Solids Content. Figure 8.9 shows a comparison between the results from all paste fill mixes that were run in the stage 1 model. This graph shows that an increase in cement content produces a larger reduction in peak particle velocity in the paste fill than a corresponding increase in solids content does. These results indicate that a small decrease in cement content can be offset by an increase in solids content without increasing the volume of paste fill that fails, as reported in van Gool et al. (2006). For example, a 76 % solids and 6 % cement mixture of paste fill results in peak particle velocities in the fill of the same magnitude as an 80 % solids and 4 % cement paste fill. 0.5. ,j. ii. 0045. jJ ij. 004. ! u. 0.3. Qi ::; 0.25. 1:: 0.2. f---. '\. (II. D.. 80% Solids 6% Cement. f---. h. u. ~. 78% Solids 6% Cement. I I. o. ....III. 76% Solids 6% Cement. -. IIIi H i. Ul 0.35 ~. -. 0.15. "'". 0.1. \ ~~. 0.05. ----. ................ o o. 2. 4. -.. ~. 6. 8. 10. 12. 14. Distance from Borehole (m). Figure 8.6 - Stage 1 Model Resultsfor Paste Fill with 6% Cement Content. 154.
(8) Chapter 8 - Numerical Model Results and Discussion. ,\. 0.5. i. 0.45. -. 76% Solids 4% Cement. -. 78% Solids 4% Cement. f-. 80% Solids 4% Cement. 0.4. Ul 0.35. §. ~ u o. ~Gl. \. 0.3. \. 0.25. ;:;. :e. ...~. 0.2. II... 0.15. \ \. \\. lIS Gl. "". 0.1. ~. 0.05. o o. 2. 4. 6. 8. 10. 12. 14. Distance from Borehole (m). Figure 8.7- Stage 1 Model Resultsfor Paste Fill with 4% Cement Content. ,. 0.5. -. 76% Solids 2% Cement. -. 78% Solids 2% Cement. 0.45. f-. 0.4. Ul 0.35. ~. :s ~ u o. 0.3. l\. a; ~ 0.25 ;:;. :e. ...~. 0.2. II... 0.15. \\. lIS Gl. "'~ <;. 0.1 0.05. o o. 2. 4. 6. 8. 10. 12. 14. Distance from Borehole (m). Figure 8.8 - Stage 1 Model Resultsfor Paste Fill with 2% Cement Content. 155.
(9) Chapter 8 - Numerical Model Results and Discussion. 0.5. 0.45. 0.4. i ~ u o. ~Gl. 0.35 0.3. 0.25. -. \ \ \ \. :e 0.2. II... 0.15. lIS Gl. 0.1. Solids Solids Solids Solids Solids Solids Solids Solids Solids. 2% 4% 6% 2% 4% 6% 2% 4% 6%. Cement Cement Cement Cement Cement Cement Cement Cement Cement. \. U. ...~. -. 76% 76% 76% 78% 78% 78% 80% 80% 80%. ~. ~. 0.05 :---. o 4. 5. 6. 7. 8. 9. 10. 11. 12. 13. 14. Distance from Borehole (m). Figure 8.9 -Stage 1 Model Results for Different Paste Fill Mixes. 8.2. Stage 2 Model: Single Column ofExplosive in Rock 8.2.1.. Scenarios Modelled. As discussed in section 7.3.3, the stage 2 model was based on the scenario of a single column of emulsion explosive in a rock mass. The scenario modelled in this case can be defined as follows: •. 89 mm diameter borehole, as used in the production blasts at Cannington Mine;. •. One 3 m long borehole containing a 2 m length of emulsion explosive and 1 m of stemming;. •. The borehole is located in a uniform mass of rock;. •. The rock/paste fill interface is located at a sufficient distance from the blast hole that effects of the reflection of the blast wave from the interface are negligible i.e. the entire blast and the effects are confined within the rock; and. •. The borehole is drilled perpendicular to the floor of the tunnel.. 156.
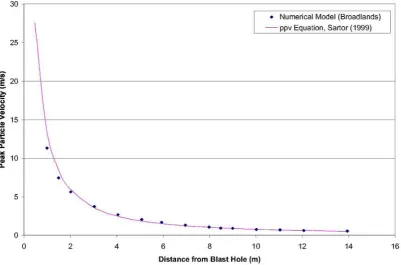
(10) Chapter 8 - Numerical Model Results and Discussion The stage 2 model was run for the following rock types found at Cannington Mine in order to assess the effect of rock type on wave prop agation: •. Broadlands (BL). •. Burnham (BM). •. Glenholme (GH). •. Magnetite bearing hedenbergite rock (HDMT). •. Pyrobole Rock (PXAM). •. Garnetiferous quartzite/arkose and meta Meta quartzite/arkose (QZGAlLT). •. Hedenbergite quartzite rock (QZHD). An input file for a stage 2 model of an explosive column in Broadlands rock type is given in Appendix F.. 8.2.2.. Results and Discussion. 8.2.2.1. Comparison ofResults against Peak Particle Velocity Prediction Equation A site specific peak particle velocity equation for Cannington Mine rock developed by Sartor (1999) was used to validate the stage 2 model. As discussed in section 2.3.2, Sartor used equation 2.5 to model the vibration induced damage from blasting in rock at Cannington Mine. Data such as the timing and amplitude of the peak particle velocity were measured, using a set of geophones, to develop a site-specific vibration equation for Cannington Mine rock. The constants in the equation were found to be: K = 2938, a = liz ~ = 0.66. The model results when Broadlands rock type was used were compared against the prediction of the peak particle velocity using the parameters obtained from the Sartor's work in order to validate the model. The results of the explosive column in rock are shown in Figure 8.1O. As can be seen, for distances greater than or equal to 1.0 m from the explosive in rock the model matches the predicted ppv quite closely, although the ppv are overestimated at distances less than 1.0 m from the source. The model overestimates the peak particle velocities close to the explosive source as the crushing and cracking mechanisms that occur in the vicinity surrounding the borehole are not considered in the numerical model. Since the purpose of this project is to predict the behaviour of the paste fill adjacent to blasting, and the closest borehole modelled. 157.
(11) Chapter 8 - Numerical Model Results and Discussion was located 2.5 m from the rock/paste fill boundary, the ability to model the cracking mechanism in rock was not considered necessary.. 8.2.2.2.. Effect ofRock Parameters on Peak Particle Velocity. Figure 8.11 shows a comparison between the results from the different rock types that were run in the stage 2 model. As can be seen, the majority of rock types yield similar results in the model.. The exception is the Glenholme (GH), which is the weakest rock type that was. modelled. Peak particle velocity predictions for the other 6 rock types will yield similar results. The Broadlands (BL) rock type was used for the stage 3 model. The peak particle velocities predicted for the Glenholme are much higher than those predicted for the other rock types, as expected for the weaker rock. Peak particle velocity predictions for this rock type are likely to be overestimated in the steep region of the curve. Therefore, peak particle velocity predictions for Glenholme are likely to only be accurate for distances greater than 4 m from the rock.. 30. • I. -. Numerical Model (Broadlands) ppv Equation, Sartor (1999). I. 25. \ \. \. \. \ \ \. .\ • •. 5. -A. o o. 2. 4. 6. 8. 10. 12. 14. 16. Distance from Blast Hole (m). Figure 8.10 - Stage 2 Model Results Versus Peak Particle Velocity Predictions. 158.
(12) Chapter 8 - Numerical Model Results and Discussion. 40 -. SL SM. -. GH HDMT PXA M. -. QZGA QZ HD. 35. 30. .!!!. .§.. a- 25. \. 'u o. a; :: 20. u. 1::. 1lI. II... 15. l\\~. .00: 1lI. CI). II... 10. ~ ~. 5. o o. 2. 4. 6. 8. 10. 12. 14. Distance from Borehole (m). Figure 8.11- Stage 2 Model Peak Particle Velocitiesfor Different Rock Types. 8.3. Stage 3 Model: Column ofExplosive in Rock Adjacent to Paste Fill 8.3.1.. General. As discussed in section 7.3.4, the stage 3 model was based on the scenario of columns of emulsion explosive in a rock mass adjacent to a paste fill stope. The system was modelled in plan view using plane strain elements. The Broadlands rock type and a paste fill mix of 76 % solids and 4 % cement were used for this analysis. The paste fill stope in this model was 25 m by 25 m in plan view, representative of the average dimensions of a stope. Several scenarios were modelled, with the difference between the scenarios being the number and location of the boreholes.. 8.3.2. Scenario 1: Single Borehole Detonated Adj acent to the Centreline of a Paste Fill Stope The stage 3 model scenario 1 consisted of modelling a single column of explosive adjacent to a paste fill stope. The column of explosive was located adjacent at the centreline of the paste fill stope as shown in Figure 7.6. The following variations were included in scenario 1:. 159.
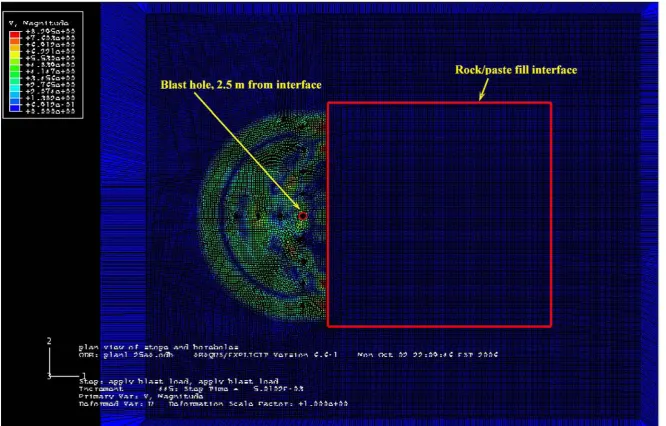
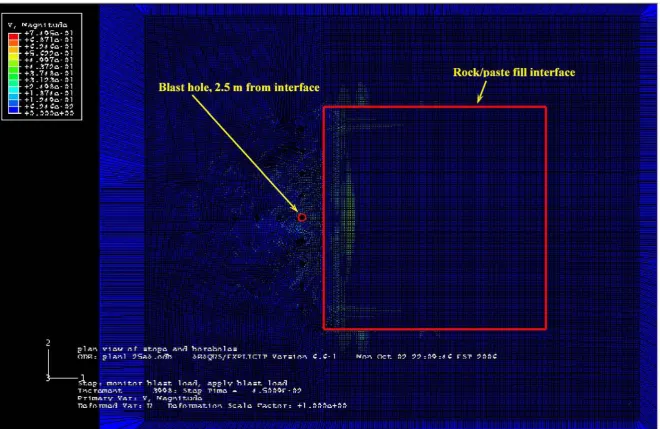
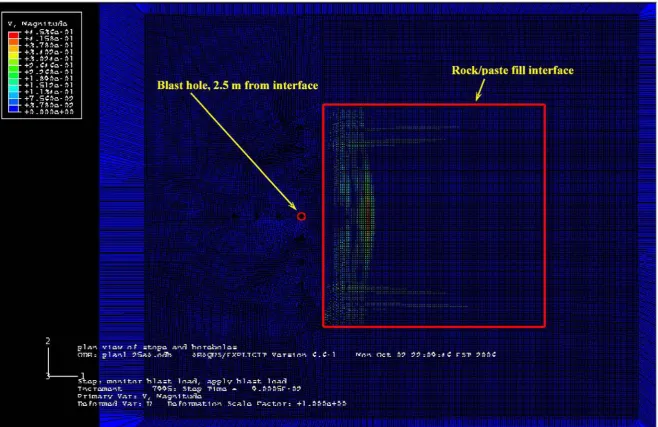
(13) Chapter 8 - Numerical Model Results and Discussion •. Two different borehole diameters were used, 89 mm and 76 mm. The majority of the boreholes in the production blasts monitored and discussed in Chapter 3 were 89 mm diameter boreholes, however, some boreholes adjacent to the paste fill had a diameter of 76mm.. •. The model was solved for the detonation of a single blast hole. Four different models were solved with the blast hole located at a distance of2.5, 5, 7.5 and 10 m between the rock/paste fill interface and the blast hole.. An input file for a stage 3 scenario 1 model of an explosive column located 2.5 m from the paste fill stope is given in Appendix F.. 8.3.2.1.. Effect ofRock/Paste Fill Interface. Figures 8.12 to 8.15 show the particle velocity in the rock and the paste fill at 5, 20, 45 and 90 ms respectively after the detonation of an 89 mm diameter blast hole located 2.5 m from the rock/paste fill interface. Together, these figures show the transmission of the wave across the rock/paste fill interface. The boundary between the rock and the paste fill is shown with a red line and the location of the blast hole is shown with a red circle. The following observations were made from the models: •. A portion of the wave was reflected back into the rock at the rock/paste fill interface. This resulted in some high velocities being observed at the boundary wall in Figure 8.12.. •. The refracted wave travelled through the paste fill much slower than the reflected wave travelled through the rock. The reflected wave can be seen leaving the system in Figure 8.13 prior to the refracted wave in the paste fill has moved a significant distance from the rock/paste fill boundary. In Figures 8.14 and 8.15, it can be seen that as the refracted wave begins to cross the paste fill, the reflected waves has left modelled region of the rock.. The much slower velocity of the wave in the paste fill in comparison to the rock is due to the different p-wave velocities in the different materials. As shown in Table 3.10, the p-wave velocity in the rock is 2330 mls while the p-wave velocity in paste fill is 176 m/s. These model observations agree with observations made from the field monitoring program discussed in Chapter 3.. 160.
(14) Chapter 8 - Numerical Model Results and Discussion. Figure 8.12 - Particle Velocity 0.005 s After Detonation 161.
(15) Chapter 8 - Numerical Model Results and Discussion. Figure 8.13 - Particle Velocity 0.020 s After Detonation 162.
(16) Chapter 8 - Numerical Model Results and Discussion. Figure 8.14 - Particle Velocity 0.045 s After Detonation 163.
(17) Chapter 8 - Numerical Model Results and Discussion. Figure 8.15 - Particle Velocity 0.090 s After Detonation 164.
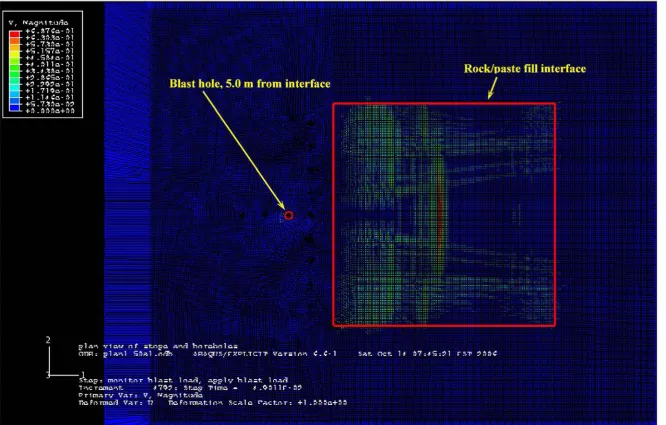
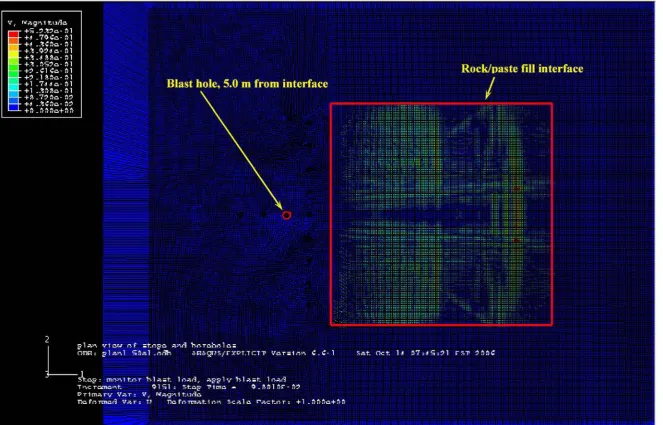
(18) Chapter 8 - Numerical Model Results and Discussion. 8.3.2.2.. Internal Reflections Within Paste Fill. Figures 8.16 to 8.21 show the particle velocity in the rock and the paste fill at 49,98, 147, 196, 245 and 294 ms respectively after the detonation of an 89 mm diameter blast hole located 5.0 m from the rock/paste fill interface. Together, these figures show the transmission of the wave across the paste fill stope. These figures show the internal reflections of the blast wave within the paste fill after the wave has crossed the rock/paste fill interface (shown in Figures 8.12 to 8.15 for an explosive column located 2.5 m from the rock/paste fill interface). The boundary between the rock and the paste fill is shown with a red line and the location of the blast hole is shown with a red circle. The following observations were made from the models: •. The wave is observed to travel across the stope (Figures 8.16 and 8.17), reflect back into the stope at the paste fill/rock boundary on the right hand side (Figure 8.18), travel back across the stope (Figures 8.19 and 8.20) and reflect back into the paste fill at the paste fill/rock boundary on the left hand side (Figure 8.21).. •. Some refraction of the wave is seen at the paste fill/rock boundary opposite the side of the stope that the blasting occurred on (Figure 8.18).. •. Reflection ofthe wave is also observed at the paste fill/rock boundary to the top and bottom ofthe figure.. The velocity profiles within the stope show the presence of a second wave arrival. The velocity profiles at a point on the centreline of the stope and 3.5 m from the rock/paste fill boundary are shown in Figures 8.22 and 8.23 and the location of the point is shown in Figure 8.24. The second wave arrival in the velocity profile is the arrival of the reflected wave at that point. The reflection of the wave back and forward within the paste fill was observed in the monitoring of the production blasts discussed in Chapter 3 and in the field instrumentation tests discussed in Chapter 4. Both the field data and the numerical model indicate that once a wave enters a paste fill stope, it stays within that stope and attenuates within the paste fill.. 165.
(19) Chapter 8 - Numerical Model Results and Discussion. Figure 8.16 - Particle Velocity 0.049 s After Detonation 166.
(20) Chapter 8 - Numerical Model Results and Discussion. Figure 8.17 - Particle Velocity 0.098 s After Detonation 167.
(21) Chapter 8 - Numerical Model Results and Discussion. Figure 8.18 - Particle Velocity 0.147 s After Detonation 168.
(22) Chapter 8 - Numerical Model Results and Discussion. Figure 8.19 - Particle Velocity 0.196 s After Detonation 169.
(23) Chapter 8 - Numerical Model Results and Discussion. Figure 8.20 - Particle Velocity 0.245 s After Detonation 170.
(24) Chapter 8 - Numerical Model Results and Discussion. Figure 8.21 - Particle Velocity 0.294 s After Detonation 171.
(25) Chapter 8 - Numerical Model Results and Discussion. 1.5 n. Blast hole location: 5 m from paste fill. f1. I. ~. f. §.0.5. ~ (J .Q 0. J \. r\~ ftf\. /\. ~. >. r-c;. --JV. I V\/"V. Q). A. r-:. v"'V. ~. '"' '" '". 1. -0.5. If. -1. o. 0.05. 0.1 Time (s). 0.15. 0.2. Figure 8.22 - Particle Velocity in the x-Direction 0.03 ,..--0.02. -. -. -. -. -. -. -. -. -. -. -. -. -. -. -. -. -. -. -. -. -. -. -. -----,. Blast hole location: 5 m from paste f(jJ. + - - - - - - - - - - - - - - - - - - - - - - - ---+t-+t-----1. ~0.01. E. ~. 0. -+---~rd_'r-f\rf-t__I-+-J-+-+++-'I_++Ht_H+I_t+\+hH+_l_+tlI++__+_1'___+_+_+_++_f__+_cf_h1-+-+l. (J. o. ~-0.01 -0.02 -0.03. - t - - - - - - - - - r - - - - - - - - - - - , - - - - - - - , - - - - - - -------j. o. 0.05. 0.1 Time (s). 0.15. 0.2. Figure 8.23 - Velocity in the y-Direction. 8.3.2.3.. Effect ofDistance ofBorehole from Paste Fill on Peak Particle Velocity. In order to analyse the model, the peak particle velocities along the centreline of the paste fill stope were compared.. The peak particle velocity was plotted against distance from the. rock/paste fill boundary so that the boundary closest to the borehole was at 0 m and the opposite boundary was at 25 m as shown in Figure 8.24.. 172.
(26) Chapter 8 - Numerical Model Results and Discussion. Infinite elements. .. •../ ../ ../ ./. , /. I"""""". 25m. 2.5m. 1<. -.. >1. blast hole rn. 1:J Q). S. -..... Q) Q). Q) ....... Paste fill rn. p. ~. ~. ~. >-<. Point at which / particle velocities are shown in Figures 8.22 and 8.23. 25. 3.5. 0. -. 1. V. 1:J. Line along which results were analysed. Q). 25m. S. -..... Q) Q). Q) ....... ~. ~. ~. >-<. Rock x. 1.//··/···/····/. Infinite elements. ............,..•.,..•.•..•.•... Figure 8.24 - Centreline ofPaste Fill Along Which the Results Have Been Analysed The peak particle velocities predicted for the detonation of boreholes located at 2.5, 5.0, 7.5 and 10.0 m from the rock/paste fill boundary are shown in Figure 8.25. From this figure it can be seen that as the distance between the borehole and the paste fill is increased, the peak particle velocities generated in the paste fill decreased and therefore the damage to the paste fill is reduced. The distance into the paste fill of the expected failure plane is given in Table 8.1. These distances are based on failure to paste fill occurring when peak particle velocities of 2.5. mls or greater is experienced in the paste fill for a mix of 76 % solids and 4 % cement as discussed in Chapter 3.. 173.
(27) Chapter 8 - Numerical Model Results and Discussion. 4i - - - - - - - - - - - - - - - - ;: :=====================;l 3.5 +--1,------. -. -. -. -. -. -. -. -. -. -. -. -. -. -. -. -----1. -. Blast 2.5 m from paste fill. -. Blast 5.0 m from paste fill Blast 7.5 m from paste fill. 3+-+ - - - - - - - - - - - - - - - - - - - - - - 1 2.5 +--1.--\--. 1.5. -. -. -. -. -. -. -. -. -. -. -. -. -. -. -. -. -. -. -. Blast 10.0 m from paste fill -. -. -. -. -. -. -. -. -. -----1. +---\--~-----'""o,__=__----------------------------1. 0.5. 0+---------,-------,.--------,----------;----------1. o. 5. 10. 15. 20. 25. Distance from rock/paste fill interface. Figure 8.25 - Comparison of resultsfrom a Single Borehole at Various Locations Relative to the Paste Fill 8.3.2.4.. Effect ofBorehole Diameter on Peak Particle Velocity. The production blasts monitored for this project consisted of mainly 89 mm diameter boreholes with 76 mm diameter boreholes in the set of blast holes located adjacent to one of the paste fill faces. The location of the 76 mm diameter blast holes is shown in Figure 8.26. The smaller diameter boreholes have a smaller linear charge density and therefore apply a smaller load to the surrounding material. The load for the 76 mm diameter boreholes was determined using the method presented in section 6.8.1. The peak particle velocities predicted for 76 mm diameter boreholes was compared against those predicted for 89 mm diameter boreholes as shown in Figure 8.27. From this figure it can be seen that the smaller diameter boreholes result in lower peak particle velocities generated in the paste fill and therefore the damage to the paste fill is reduced. The distance into the paste fill of the expected failure plane is given in Table 8.1. These distances are based on failure to paste fill occurring when peak particle velocities of 2.5 mls or greater at experienced in the paste fill as discussed in Chapter 3. The results show that 89 mm boreholes located 7.5 m or more from the paste fill are likely to cause damage to less than 0.5 m into the paste fill stope, while 76 mm diameter boreholes located 5 m or more from the paste fill are likely to cause damage to less than 0.5 m into the paste fill stope. Therefore, smaller diameter boreholes should be used for boreholes 5 m or closer to paste fill.. 174.
(28) Chapter 8 - Numerical Model Results and Discussion. Legend Geophones 76 mm diameter blast holes. &. Stope 4261 (paste fill). Stope 4261 (paste fill). Stope 4762 (paste fill). Stope 4760 (rock). ... G5. G5G4 G3. G6 &. &. &. ~ Ring4. G7. • G3 G4. G7 G6. .<E- Ring3 ~ Ring2 ~ Ring 1. &. . .. .. . . . . . . . . ~ COS3 ". ".". . :9:. co. III. A. ~COS2L-----------~. A\. '''- COS 1. Stope 4760 (rock). (a) Plan View at the 425 m Level. COS3--:;~<iA. Ring4 Ring3 Ring2 Ring 1. Winze COS2 COS 1. (b) Elevation Figure 8.26 - Location of 76 mm Diameter Blast Holes, Blast 904064. 4 ,-----. ~. oS ~ c.. - . - - - - - - - - - - - - - - -----,Blast 2.5 m from paste fill, 89 mm diameter - - Blast 5.0 m from paste fill, 89 mm diameter 3.5 Blast 7.5 m from paste fill, 89 mm diameter - - Blast 10 m from paste fill, 89 mm diameter 3 +-+ - - - - - - - - - - - - - - - - - - - 1 - - - Blast 2.5 m from paste fill, 76 mm diameter - - - Blast 5.0 m from paste fill, 76 mm diameter Blast 7.5 m from paste fill, 76 mm diameter 2.5 +-1""'- - - - - - - - - - - - - - - - --1 - - - Blast 10 m from aste fill 76 mm diameter 2. -. -. -. -. -. -. -. -. -. -. -. -. -. -. -. -. +-.-.--'<~_.._-----------------------------. 1.5 +-- '\-...--.........----'-.~----'"' ~--------------------------. o +-------~-----~------~------~------~. o. 5. 10. 15. 25. 20. Distance from rock/paste fill interface. Figure 8.27 -Comparison ofResultsfrom a 89 mm and 76 mm Diameter Blast Holes. 175.
(29) Chapter 8 - Numerical Model Results and Discussion Table 8.1 Expected Failure of Paste Fill from Single Column of Explosive in Nearby Rock Distance Between. Location of Failure Plane: Distance into the Paste Fill from. Borehole and Paste Fill. Rock/Paste Fill Interface (m). (m) 89 mm Diameter Borehole. 76 mm Diameter Borehole. 2.5. 1.25. 0.90. 5.0. 0.5. < 0.5. 7.5. < 0.5. < 0.5. 10.0. < 0.5. < 0.5. 8.3.3.. Scenario 2: Singe Borehole Offset from the Centreline of the Paste Fill Stope. The stage 3 model, scenario 2 consisted of a plane strain model of a single column of explosive adjacent to a paste fill stope. The column of explosive was offset from the centreline of the paste fill stope as shown in Figure 8.28. Offset distances of2.5, 5.0, 7.5 and 10.0 m were used. An input file for a stage 3 scenario 2 model of an explosive column located 2.5 m from the paste fill stope with an offset of 2.5 m is given in Appendix F.. 8.3.3.1.. Effect ofLocation ofBorehole Relative to Paste Fill. In order to analyse the model, the peak particle velocities along the face of the paste fill stope. were compared. The peak particle velocity was plotted against offset of the point from the centreline of the paste fill stope as shown in Figure 8.29. The peak particle velocities predicted for the detonation of boreholes located at offsets of 0, 2.5, 5.0, 7.5 and 10.0 m from the centreline of the paste fill stope are shown in Figure 8.30. From this figure it can be seen that a single column of explosive produces a high peak particle velocity in the area near the borehole site, and produces reasonably constant peak particle velocities across the rest of the paste fill face. Typically, the peak particle velocities would be expected to reduce with distance from the explosive source, however the constant peak particle velocity predicted across the entire paste fill face can be explained by the reflections ofthe wave which have been observed to occur within the paste fill.. 176.
(30) Chapter 8 - Numerical Model Results and Discussion. Legend -------------------------------------------~. Offset 2.5, 5.0, 7.5 or 10.0m. DRock. 1»1 Paste Fill. La. t-· _.-._. ______ Boundary of modelled region a Blast Hole. -r ,....,....•. ....,..•.•.....,....•.....,....•.....,....• ....,....•.....,..........,.... 25~ I. U. <. >1<. 2.5 m. I~. >1:. 25 m. :. --------------------------------------~. Figure 8.28 - Stage 3 Model, Scenario 2. Infinite elements. I·········.... ..../. ... /. ../ ..././. 25m. 2.5m. 1<. >1 12.5 Offset. -.. blast hole rn. 1:J Q). S. -.......... Q) Q). Q). rn. I--. 0. ~. ~. ... _. ... _. Pf. ~. >-<. 0-_. WhiC(. 1:J. Paste fill ... _. ... _. Q). ... 25m. S. -.......... Q) Q) Q). ~. ~. ~. Line along results were analysed. >-<. -12.5. ----?-I. ~ck. 1.0 m 1..//··/···/····/. Infinite elements. ............................... Figure 8.29 - Line Along which Results were Analysed/or Stage 3 Model, Scenario 2. 177.
(31) Chapter 8 - Numerical Model Results and Discussion. 3 -r- - - - - - - - - - - - - - - - - - - - - ---;== = = ===;l 0 m offset 2.5 m offset 5.0 m offset 2.5 + - - - - - - - - - - - - - - - - - - - - - - - - - - - - - - j -7.5 m offset -. -. :i §.. 10 .0 m offset. 2. ~. 'u o. ~. CI). 1.5. U. 1::1lI II.. .00: 1lI. CI). II... 0.5 + - - - - - - - - - - - - - - - - - - - - - - - - - - - - - - ---1. O + - - - - - r - - - - - r - - - - - - , - - - - - - - , - - - - - - - r - - - - - - , - - - r - - - - . . . , . . . - - - - - r - - ---l. -12.5. -10. -7.5. -5. -2.5. 0. 2.5. 5. 7.5. 10. 12.5. Offset (m). Figure 8.30 - Peak Particle Velocities Along Paste Fill Face Due to a Single Column ofExplosive. 8.3.4.. Scenario 3: Detonation of a Row of Boreholes Parallel to a Face of the Paste Fill Stope. The above model analyses were all based on the detonation of a single borehole. However, in practice, production blasts consist of the detonation of multiple boreholes with small delays between each detonation. Therefore, a cumulative effect from the multiple boreholes will be observed, and the damage to paste fill will be much greater than that caused by a single borehole. The stage 3 model, scenario 3 consisted of a plane strain model of a row of explosive boreholes 2.5 m from a paste fill stope. The boreholes were spaced 2.5 m apart. The boreholes were numbered as shown in Figure 8.31. The analysis was run for detonation delays of 100 ms, 200 ms and 400 ms, where the delay is the time between two blasts. The following blast patterns were modelled: •. Blast Pattern 1. Simultaneous detonation of all 9 boreholes. •. Blast Pattern 2. Detonation ofthe boreholes in the following order: 1,2,3,4,5,6, 7, 8, 9.. •. Blast Pattern 3: Detonation of the boreholes in the following order: 5,4 and 6,3 and 7, 2 and 8, 1 and 9.. Input files for stage 3 models ofthe blast patterns described above are given in Appendix F.. 178.
(32) Chapter 8 - Numerical Model Results and Discussion. Legend 2.5 m spacing between boreholes. I. .. 10. .. 20. D. Rock. r---l Ld. Paste Fill. o. Blast Hole. 3 0 4 0 5 6. 0. 8. 0. 25m. 0 7 0 9 0. [Y/ \. 25m I. ~ __. --------------------------------------. x ..... Figure 8.31- Borehole Numbering/or Stage 3 Model, Scenario 3. 8.3.4.1.. Comparison ofSingle Borehole Versus Multiple Boreholes. The peak particle velocities in paste fill predicted for multiple boreholes were compared against the peak particle velocities predicted for a single borehole. A comparison of the peak particle velocities along the centreline of the paste fill stope is shown in Figure 8.32 while the comparison along the face of the paste fill stope is shown in Figure 8.33. As expected, multiple boreholes result in higher peak particle velocities that are approximately constant across the face of the paste fill stope, except for the ends. The detonation of all boreholes simultaneously results in much higher peak particle velocities along the face of the paste fill face. The use of delays between boreholes results in the wave from earlier boreholes being allowed to propagate for a short distance before the next detonation.. This produces a more uniformly crushed. product in the crushed zone while reducing the peak particle velocities and damage to material in the far field. The velocities along the centreline of the stope are higher for multiple boreholes throughout the length of the stope. The curve for a single borehole is much smoother than the curves for multiple boreholes with delays between the boreholes. This is due to the interaction of the reflected waves from the earlier blasts with the waves from later blasts. The predicted failure plane in the paste fill is given in Table 8.2 for multiple boreholes located 2.5 m from a paste fill stope. These distances are based on failure to paste fill occurring when peak particle velocities of 2.5 m/s or greater is experienced in the paste fill for a mix of 76 % solids and 4 % cement as discussed in Chapter 3.. 179.
(33) Chapter 8 - Numerical Model Results and Discussion. Table 8.2 Expected Failure of Paste Fill from Multiple Boreholes in 2.5 m from Paste Fill Blast Pattern. Delay (ms). Location of Failure Plane: Distance from Rock/Paste Fill Boundary (m). i. o. 4.5. 2. 100. 2.0. 2. 200. 2.0. 2. 400. 2.0. 3. 100. 2.5. 3. 200. 2.5. 3. 400. 2.5. 12 I--------------~==::::;=======;:=;:;===========;""] Blast pattern 2, 100 ms delay Blast pattern 2, 200 ms delay Blast pattern 2, 400 ms delay Blast pattern 1, simultaneous detonation 10 +-\ - - - - - - - - - - - - - - - - - - - - - - 1 Blast pattern 3, 100 ms delay Blast pattern 3, 200 ms delay Blast pattern 3, 400 ms delay Sin Ie borehole. 8. ~. 'u o CI). :>. CI). 6 +-l~_\_------------------------------. ___j. U. 1:: 1lI II. .00:. III. 4 +--\ --.. --- + - - - - - - - - - - - - - - - - - - - - - - - - - - - - - -___j. II.. 2. O + - - - - - - - - - - r - - - - - - - - - , - - - - - - - . . . , . . - - - - - - - - - - , - - - - - -___j o 5 10 15 20 25 Distance from Rock/Paste Fill Interface (m). Figure 8.32 - ppv Predicted along the Centreline ofa Paste Fill Stope. 180.
(34) Chapter 8 - Numerical Model Results and Discussion. -12.5. -7.5. -2.5. 2.5. 7.5. 12.5. Offset (m) -. Blast pattern 2, 100 ms delay Blast pattern 2, 400 ms delay. -. Blast pattern 2, 200 ms delay Blast pattern 1, simultaneous detonation. -. Blast pattern 3, 100 ms delay Blast pattern 3, 400 ms delay. -. Blast pattern 3, 200 ms delay Single borehole. Figure 8.33 - ppv Predicted Along the Face ofa Paste Fill Stope. 8.3.4.2.. Comparison ofDetonation Patterns. A comparison of peak particle velocities predicted along the centreline of the stope is shown in Figure 8.34 for the three detonation patterns modelled, with a delay time of 200 ms. The graph shows that blast pattern 1 where, the detonation of all boreholes occurs simultaneously, produces higher peak particle velocities throughout the full length of the stope. The peak particle velocities near the rock/paste fill boundary are much larger than those predicted for the other two blast patterns, and the failure zone of paste fill is predicted to be approximately twice as wide as those for blast patterns 2 and 3. The failure zone is predicted to be 4.5 m wide failure zone for blast pattern 1,2.0 and 2.5 m wide failure zone for blast patterns 2 and 3 respectively. Blast pattern 3, the detonation of the boreholes starting in the middle and working out to the ends ofthe stope is shown to produce slightly higher peak particle velocities across the paste fill stope when compared to blast pattern 2. However, a comparison of the peak particle velocities predicted across the face ofthe stope (Figure 8.35) shows that these higher velocities only occur along the centreline of the stope and that similar peak particle velocities are predicted across the rest of the paste fill. Similar results were observed for delays of 100 ms and 400 ms. These results show that from the point of view of reducing damage to nearby paste fill, a delay between the detonation of multiple boreholes is necessary, however the actual order of. 181.
(35) Chapter 8 - Numerical Model Results and Discussion detonation has little effect on the damage to the paste fill. The detonation order does play a large role in the resulting material in the crushed zone and should be designed accordingly. 12. r - - - - - - - - - - - - - - - ---;:========================;l. 10. -. Blast pattern 2, 200 ms delay. -. Blast pattern 1, simultaneous detonation. -. Blast pattern 3, 200 ms delay. ~8+___\_------------------------------___j .§. ~. 'u o CI). :>. CI). 6 ~c___\_------------------------------. ___j. u. 1::1lI II.. .00:. III. II... 4. O + _ - - - - - - - - - r - - - - - - - - - , - - - - - - - . . . , . . - - - - - - - - - - , - - - - - -___j. o. 5. 10. 20. 15. 25. Distance from Rock/Paste Fill Interface (m). Figure 8.34 - ppv Predicted Along the Centreline ofa Paste Fill Stope for Different Detonation Patterns -. Blast pattern 2, 200 ms delay. -. Blast pattern 1, simultaneous detonation. -. Blast pattern 3, 200 ms delay. 5. .!I.!. .§. ~. 'u o CI). s. CI). u. 1::1lI II.. .00: 1lI. CI). II... -12.5. -7.5. -2.5. 2.5. 7.5. 12.5. Offset (m). Figure 8.35 - ppv Predicted Along the Face ofa Paste Fill Stope for Different Detonation Patterns. 182.
(36) Chapter 8 - Numerical Model Results and Discussion. 8.3.4.3.. Effect ofDelay Time on Peak Particle Velocity. A comparison of peak particle velocities predicted along the centreline of the stope for different detonation times is shown in Figure 8.36 for blast pattern 2. The graph shows that there is no significant difference between the magnitude of the peak particle velocities experienced in the paste fill due to the different detonation times. The peak particle velocities in the region near the rock/paste fill boundary are due to the initial wave travelling in the paste fill. These peak particle velocities do not vary with the different detonation times. The peak particle velocities throughout the rest of the paste fill are the result of the waves from each blast being transmitted through the paste fill and the reflections of these waves on the paste fill/rock boundary. Due to the different delay times, the times when these waves interact with each other varies, resulting in the slight variation of peak particle velocity at a given point throughout the majority of the paste fill. A comparison of the peak particle velocities across the face of the paste fill stope (Figure 8.37) shows no significant difference between the peak particle velocities predicted from different delay times.. 6i - - - - - - - - - - - - - - -;: : ====================:: :;l -. Blast pattern 2, 100 rns delay. -. Blast pattern 2, 200 rns delay Blast pattern 2, 400 rns delay. 5. ~ 4 +---1,. ---j. .§.. ~. 'u o CI). >3+-----\\ - - - - - - - - - - - - - - - - - - - - - - - - - - - - - - ----j CI). u. 1:: 1lI. II... .00:. III. II... 2. -. -. O + - - - - - - - - - - , . . - - - - - - . . . , - - - - - - - - - - , . . - - - - - - . . . , - - - - - ----j. o. 5. 10. 15. 25. 20. Distance from Rock/Paste Fill Interface (m). Figure 8.36 - ppv Predicted Along the Centreline ofa Paste Fill Stope for Different Delay Times. 183.
(37) Chapter 8 - Numerical Model Results and Discussion. -. Blast pattern 2, 100 ms delay. -. Blast pattern 2, 200 ms delay Blast pattern 2, 400 ms delay. -7.5. -12.5. -2.5. 2.5. 7.5. 12.5. Offset (m). Figure 8.37 - ppv Predicted Along the Face ofa Paste Fill Stope for Different Delay Times These results show that from the point of view of reducing damage to nearby paste fill, the actual delay between the detonation of boreholes has little effect on the damage to nearby paste fill, although results presented above show that a delay between the detonation of multiple boreholes is necessary. Like the detonation order, the delay time between boreholes plays a large role in the resulting material in the crushed zone and should be designed accordingly.. 8.4. Summary 8.4.1.. Stage 1 Model. The stage 1 model was run for a paste fill mix of 76 % solids and 4 % cement, which corresponded to the mixture of paste fill the field instrumentation tests were conducted in. Comparison between the model results and the field data showed that the model correctly predicts the peak particle velocity in the paste fill at distances equal or greater than 2 m from the explosive source. Comparison between velocity waveforms between the model and the field data showed similar patterns. The stage 1 model was run for a number of different mixes of paste fill to study the effect of solids content and cement content on the peak particle velocities experienced in paste fill during nearby blasting. The model results showed the following:. 184.
(38) Chapter 8 - Numerical Model Results and Discussion •. A decrease in cement content ofthe paste fill results in a higher peak particle velocity in the paste fill, and in tum a larger volume of paste fill that is likely to be damaged during nearby blasting.. •. For low cement contents, a decrease in solids content of the paste fill results in a higher peak particle velocity in the paste fill, and in tum a larger volume of paste fill that is likely to be damaged during nearby blasting. For a cement content of6 %, the results were similar for all solids contents.. •. A small decrease in cement content can be partially compensated for by an increase in solid content of the paste fill. For example, a 76 % solids and 6 % cement content mixture of paste fill results in peak particle velocities in the fill of the same magnitude as an 80 % solids and 4 % cement content of paste fill.. 8.4.2.. Stage 2 Model. The stage 2 model was created to validate the model against the peak particle velocities predicted by the peak particle velocity prediction equation. Once the model was validated, it was run for a number of different rock types to study the effect of rock type on the peak particle velocities experienced in rock mass during nearby blasting. The model results showed that the majority of rock types at Cannington Mine yield similar results in the model. The exception is the Glenholme which is the weakest rock time and for which much high peak particle velocities were predicted.. 8.4.3.. Stage 3 Model. Model 3, scenario 1 modelled the detonation of a single borehole located adjacent to the centreline of a paste fill stope. The model was run for a paste fill mix of 76 % solids and 4 % cement and the broadlands rock type. The model results showed the following: •. A portion of the wave was reflected back into the rock at the rock/paste fill interface. This resulted in some high velocities being observed in the rock at the rock/paste interface as shown in Figures 8.12 to 8.15.. •. The wave refracted from the rock/paste fill interface travelled through the paste fill much slower than the reflected wave travelled through the rock.. •. Once the wave entered the paste fill it was observed to reflect back into the paste fill at the boundaries of the paste fill.. This reflection was observed to continue until the wave. attenuated within the paste fill.. 185.
(39) Chapter 8 - Numerical Model Results and Discussion •. The damage to paste fill is reduced as the distance between the borehole and the paste fill is increased.. For boreholes located at distances greater than 5 m from the paste fill, the. thickness ofthe failure zone from a single borehole is predicted to be less than 0.5 m. •. The damage to paste fill is reduced as the diameter of the borehole is reduced.. For. boreholes located at distances greater than 2.5 m from the paste fill, the thickness of failure from a single borehole is predicted to be less than 0.5 m. •. In order to reduce the damage to paste fill, smaller diameter boreholes should be used for. boreholes located within 5 m of paste fill. Model 3, scenario 2 modelled the detonation of a single borehole located adjacent a paste fill stope and offset from the centreline. The model was run for a paste fill mix of 76 % solids and 4 % cement and the Broadlands rock type. The model results showed that a single column of explosive produces a high peak particle velocity in the area near the borehole site, and produces reasonably constant peak particle velocities across the rest of the paste fill face. The constant peak particle velocity predicted across the entire paste fill face is due to the reflections which have been observed to occur within the paste fill. The detonation of a row of boreholes was modelled with model 3, scenario 3. The results showed the following: •. The detonation of all boreholes simultaneously results in much higher peak particle velocities and damage than the detonation of multiple boreholes with small delays (100 ms to 400 ms delays were modelled). Therefore, delays are necessary to reduce damage to the nearby paste fill during blasting.. Delays are typically used in mining applications to. produce a more uniformly crushed product in the crushed zone. •. A comparison between results from the different blast patterns modelled showed that the order of detonation has little effect on the damage to the paste fill. The detonation order does playa large role in the resulting material in the crushed zone and should be designed accordingly.. •. A comparison between the results from the same blast patterns with different delay times showed that the delay time between the detonation of boreholes has little effect on the damage to nearby paste fill. However, a delay between the detonation of multiple boreholes is necessary. Like the detonation order, the delay time between boreholes plays a large role in the resulting material in the crushed zone and should be designed accordingly.. 186.
(40)
Figure

+7

Related documents