Wildfire plume electrical conductivity
By K G A K G A M AT S O M P H A L E1∗ and M A L C O M H E RO N2, 1Physics Department, University of
Botswana, P/Bag 0022. Gaborone, Botswana;2Marine Geophysical Laboratory, James Cook University, Townsville
Q4811, Australia
(Manuscript received 10 August 2006; in final form 26 January 2007)
A B S T R A C T
Wildfires are weakly ionized gas. The ionization is mainly due to plant’s inorganic ash content species (more especially potassium), that are emitted from thermally decomposing plant structure into the flame during combustion. The amount of ionization in flames with potassium impurities is influenced by both the temperature and the amount potassium impurities in the flame. A numerical experiment was conducted using a local thermal equilibrium-based model to study the influence of inorganic wildfire contents on wildfire electrical conductivity. Simulated very high intensity wildfires (21–90 MWm−1) were used to quantify steady-state electrical conductivity. Its variation with wildfire plume height is important for high voltage power flashover research. In the simulation, vegetation potassium content was varied from 0.50% to 3.0% on dry weight basis, a reflection of its content in natural vegetation. The model predicted a maximum conductivity of 0.053 mhom−1in 90 MWm−1crown fire in vegetation with 3.0% potassium content. A 90 MWm−1
crown fire in vegetation with potassium content of 0.5% was predicted to produce a maximum conductivity of 0.022 mhom−1. Electrical conductivities were lower for a shrub fire with an intensity of 21 MWm−1. The model
predicted conductivities of 0.0021 and 0.0009 mhom−1 for potassium content of 3.0 and 0.5% in vegetation,
respectively.
1.
Introduction
The organic structure of plants is mainly composed of three in-terconnected biopolymers: cellulose; hemicellullose and lignin. The composition of the polymers in a plant is in the approxi-mate ratio of 2:1:1 (Krishna et al., 1985). These polymeric com-pounds account for over 90% of the plant’s dry weight. The rest of the constituents are fillers. Fillers are a mixture of several low molecular weight organic compounds (extractives), water and inorganic elements, for example, alkali and alkaline earth metal species.
Alkali and alkaline earth metal species form a large fraction of inorganic ash in plants, e.g. vegetation contain up to 3.4% potassium on dry weight basis (Radojevic, 2003). The species can exist; ionically or organically attached to oxygen-containing functional groups (i.e. O-C-) of the organic structure of plants, as discrete particles in voids of the organic matrix and in solu-tion form such as in xylem vessels. During a wildfire, the metal species are released from a thermally crumbling plant structure and convectively drawn into the combustion zone of the fire. Potassium species are a large fraction of inorganic emissions during vegetation combustion (Westberg et al., 2003).
∗Corresponding author. e-mail: [email protected] DOI: 10.1111/j.1600-0889.2007.00281.x
Wildfire combustion zone is characterized by high enough temperatures to cause thermal dissociation of potassium species. Potassium species have low dissociation energies (e.g. 3.79eV for K2CO3). From studies of nutrient cycling, up to 28% of in-herent potassium in plants is volatilized at combustion efficient of 98% (Raison et al., 1985). Vodacek et al. (2002) also estimate that 10–20% of potassium in vegetation is ionized in wildfires. This makes wildfires a weakly ionized environment.
Occurrence of wildfires under transmission lines has caused a great number of power outages in many countries (Fonseca et al., 1990). In South African high voltage network, wildfires are responsible for almost 15% annual power outages (Bekker and Hoch, 2002). The faults associated with wildfires are mainly conductor-to-ground short-circuiting where conductive wildfires provide a current path to the ground. The objective of the nu-merical experiment is to estimate electrical conductivity of very high intensity wildfire plumes when potassium is assumed to the main source of thermal ions in the flames.
2.
Ionization in wildfires
2.1. Thermal ionization
flame particles, and the particles are consequently thermally ion-ized to produce electrons and ions on selective basis determined by temperature and ionization potential. Thermal ionization of flame species [S(g)] occurs by the following process:
S(g)⇔S+(g)+e− (1)
Species that could appreciably undergo thermal ionization in a wildfire environment are alkali and alkaline earth metals (e.g. K, Na and Ca) and graphitic carbon (Cn). In essence a wild-fire could be considered an impure hydrocarbon diffusion flame seeded with alkalis and alkaline earth metals. Since the element potassium and graphitic carbon exist in significant amount in wildfire flame and have low ionization potential and work func-tion of 4.34 and 4.35 eV, respectively, the numerical simulafunc-tion assumes that thermal ionization in the fires is predominately due to the species. Assuming local thermal equilibrium conditions, the ionization equilibrium constant (KI) is given by the relation:
KI =2
2πmekT
h2 3/2
exp
−(Ei)
kT
, (2)
wherek,T,Eiandmeare Boltzmann’s constant, absolute tem-perature, ionization potential and mass of electron, respectively. Electron density (Ne) due to thermal ionization of K atoms is related the ionization equilibrium constant and the total number of ionized K particles (Np) in the flames as (Frost, 1961):
Ne=(K1Np)1/2
1+ K1 4Np
1/2
−
K1 4Np
1/2
. (3)
The total number of ionized K particles (Np) is related to the potassium atoms in the flame by the equation (Frost, 1961);
Np=
7.335.1021η
T cm
−3, (4)
whereηis the number density of K atoms in a wildfire. Sturgeon et al. (1980) give the electron density (nec) due to thermionic emission from graphitic carbon as:
nec=2
2πmekT
h2 3/2
exp
−(φc)
kT
(5)
whereϕc is the graphite work function which is taken to be 4.35 eV
2.2. Chemi-ionization
Chemi-ionization is another possible mechanism by which sig-nificant ionization may occur in wildfire (Latham, 1999). In the process, dissociation reactions provide part of the energy re-quired for ionization since there are exothermic and the rest is from the flame. Alkaline earth metal oxide and carbonates dur-ing combustion could react with one of the main by-products; carbon monoxide (CO), to produce electrons and carbon dioxide
(CO2) (see Alkemade, 1979). An example of the dissociation re-action could be when calcium oxide (CaO) reacts with CO. The reaction proceeds as:
CaO+CO⇔Ca++e−+CO2 (6)
During the plant matter combustion, freed potassium species thermally dissociate to atoms. However not all thermally ionize; some dissociated potassium atoms may also react in the follow-ing manner to give electrons to the hot gaseous medium:
K+CO+O⇔K++e−+CO2 (7)
Vegetation can contain up 1.1% chlorine on dry weight basis (Judd et al., 1996). In plant matter, chlorine exists in soluble form mostly attached to alkali atoms, for example, as KCl (Jensen et al., 2000). After thermal decomposition of the alkali chloride, chlorine ions in the flame may also contribute to the ionization by reacting with hydrogen atoms, also present in the flame, to give electrons according to the following equation:
Cl−+H⇔e−+HCl (8)
Exited methyl radical CH∗is a known contributor to ionization in the hydrocarbon flames, for example, in Sorokin et al. (2002). CH radical reacts with oxygen atoms in the flame to produce CHO+, a primary ion in hydrocarbon flames (Butler and Hayhurst, 1998) and electrons according to the following reaction equation:
CH∗+O⇔CHO++e− (9)
Most of the carbon atoms that exit in flames are in a coagulated form called soot. Soot is submicroscopic in size and has graphite structure (infinite large aggregate of carbon atoms) although smaller than the latter. The electrochemical characteristics of soot are different from both carbon and graphite. Ionization po-tential (φip) increases from graphite (φw =4.35eV) to carbon (φip=11.26eV), thusφipdecreases from a small to large car-bon structure. Structurally, soot lies between carcar-bon and graphite polymer, therefore it is reasonable to suggest that itsφwshould be between 4.35 and 11.26 eV.φwfor soot has been experimen-tally determined to be 8.5 eV (Shuler and Weber, 1954). With
φwalmost twice that of potassium, the presence of potassium in flames is then the most effective source of thermal ionization in wildfires.
For chemi-ionization reactions mentioned above, temperature and concentration of species hinder their contribution to ioniza-tion. For example, in eq. (8), the concentration Cl−in the flames may be decreased by the availability alkali metal cations such as Ca2+and K+that form metal chlorides with chloride ions.
3.
Wildfire plume electrical conductivity
Conductivity of an unmagnitized ionized gas subjected to alter-nating electric field is given by Schneider and Hofmann (1959) as:
σ = −4πe2
3me ∞ 0 1 (ϕeff+iω)
u3∂fo ∂u du (10)
whereme,u, andeare electron mass, velocity and charge andfo, ϕeffandωare electron distribution function, effective collision frequency and propagation cyclic frequency, respectively.
Effective collision frequency is a function of energy of the electrons (ε) and is expressed by Sakao and Sato (1969) as:
ϕeff(ε)=υ¯
i
niQi(ε) (11)
whereniandQi(ε) are number density and electron-neutral mo-mentum transfer collision cross section of component flame gases. Flame components used in the calculation of effective collision frequency of the alkali seeded fire are those given by Frost (1961). ¯υ =(8kT/meπ)1/2is the mean electron velocity. K is Boltzmann constant. The electron – neutral collision cross-section in flames is inversely proportional to mean electron ve-locity, consequently collision frequency is constant (Schneider and Hofmann, 1959). This simplifies the expression for elec-tronic conductivity to;
σ = − 4πe2
3me(ϕeff+iω) ∞ 0
u3∂fo
∂udu
(12)
Temperatures of forest fires seldom exceed 1500◦C, therefore free electrons in the flames can be assumed to be in thermal equilibrium with neutral gases therefore the electron velocity dis-tribution is Maxwellian (e.g. in Schneider and Hofmann, 1959). Maxwellian velocity distribution for electrons is given as:
fo=N
me 2πkT
1/2 exp
−meu2 2kT
(13)
and if one letsαbe (me
2kT)
1/2uthen eq. (14) becomes;
σ = 8N e2
3π1/2m
e(ϕeff+iω) ∞ 0 α4
e−α2dα
(14) but ∞ 0 α4e−α2
dα=3 8(π)
1/2
, therefore (14) becomes;
σ =
N e2
me(ϕeff+iω)
(15)
which could be rewritten as:
σ =
N e2
me
ω2+ϕ2 eff
(ϕeff−iω). (16)
An example for typical wildfire conductivity would be when one considers x-band microwaves (freq=5 GHz,ω=3.142×
1010 rads−1) illuminating a wildfire with an average electron density (N)=1×10¹⁶m−3. Momentum transfer electron-neutral particle collision frequency (ϕeff) of the flame gases is around 1×10¹¹s−1. Electrical conductivity as calculated from eq. (16) is complex and its value is 0.0026+0.0008i.
At low electromagnetic wave propagation frequencies (ω), eq. (16) reduces to:
σ =
N e2
meϕeff
. (17)
If frequencies as low as 50 Hz are considered, eq. (16) gives 0.0028+ 0.000i as electric conductivity of the fire, which is the same value given by eq. (17). Thus, conductivity has no imaginary part.
4.
Wildfire plume model
4.1. Structure of a forest fire plume
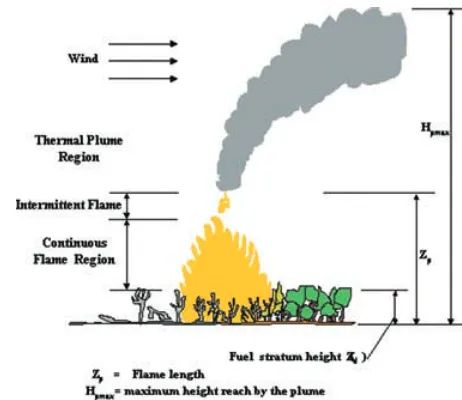
[image:3.595.290.521.493.693.2]Three regions in a wildfire plume are dynamically and physically distinct. The distinction lies in how temperature, plume velocity and implicitly electronic conductivity vary in space within these regions. The regions are the: continuous and intermittent flames and thermal plume and are as shown in Figure 1. The continu-ous flame is the lower part of the plume close to the vegetation zone where maximum plume temperature occurs. Intermittent flame region lies just above the continuous flame region. Balls of flame can be observed to come away from the source in the region. Rapid cooling of the plume occurs in the thermal plume region or smoke column. The cooling is attributed to the mix-ing of emission with entrained ambient air. There is an immense literature on the behaviour of these regions more especially the continuous flame and the smoke column regions (e.g. in Porterie
Table 1. Fire behaviour in a jack pine crown fire
Maximum fire intensity Rate of spread Flame height Average canopy height Maximum temperature
(MWm−1) (m min−1) (m) (m) (◦C)
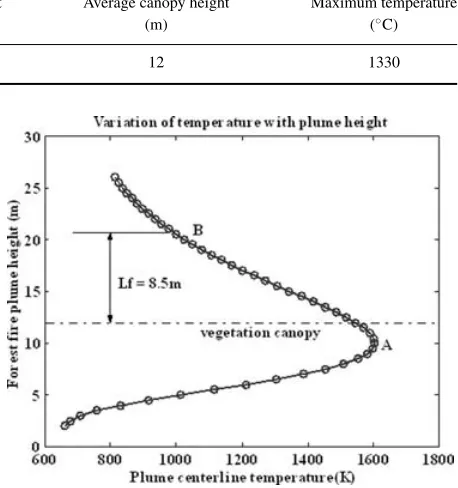
89.7 69.8 20–30 12 1330
et al., 1999; Weber et al., 1995). Most of the literature on the continuous flame region concerns its intensity(I), rate of spread (RoS) under various conditions, velocity and thermal proper-ties.
4.1.1. Vertical centreline temperature variation in the
plume. Vertical temperature variation in the continuous flame above fuel layer decreases exponential with height. The decrease in temperature with height in the fire plume is given by Weber et al. (1995) as:
Tf l=T∞+Kexp−αf(z−zd)2
, (18)
whereK,Zd,Zpare empirical constant, constant related to fuel height, constant related to flame height, respectively andαf = 1/(2zp(zp−zd)).
Maximum temperature in both the vertical and horizontal sense occurs at about the seat of the wildfire. Visible flaming edges are at lower temperature of about 600 K (Cruz et al., 2006) than at the combustion zone, which can be up to 1330◦C (Butler et al., 2004). This produces temperature gradients between the edges and fire centre. The temperature gradient causes a flow of ambient air into the flame, a process that lowers the adia-batic flame temperature (1900◦C) by turbulent mixing to about a 1300◦C.
5.
Numerical experiment
5.1. Very high intensity forest fires
The numerical experiment focuses on very intensity forest fires which are a common occurrence in Canada’s boreal forests, Mediterranean regions of Spain and Australian deciduous forests during winter. The intensity of the forest fires could reach a peak intensity of 100 MWm−1(Williams et al., 2003). Potassium and other omnipresent nutrient such as phosphorus and nitrogen are volatized from the combusting vegetation into the fire plumes. The numerical experiment simulate two very high intensity for-est fires in olive tree (Olea europaes) shrub and jack pine crown fires (Pinus banksiana, Lamb). The behaviour of jack pine crown fires is given in Table 1 and Figure 2 (de Groot et al., 2004).
Temperature above the jack pine canopy is considered to de-creases exponentially to about a 1000 K at about 21 m above ground, that is, at B (Fig. 2). This is at the intermittent flame zone of the plume. It then decreases gradually to the ambient at high attitude.
The maximum temperature of 1330◦C for the simulated crown fire is at A. The height of the flame (Lf) above the crown canopy
Fig. 2. Vertical temperature variation with plume height for 90 MWm−1crown fire.
is calculated from the relation given by Butler et al. (2004) as:
Lf=0.0175I0.67 (19)
Table 2 and Figure 3 show the behaviour of a shrub fire in olive tree forest (Santoni et al., 2006). Temperature above the shrub canopy also decreases exponentially to an intermittent flaming zone which is about 7.5 m above the ground level. The maximum temperature of 1060◦C occurs at about a meter below the shrub canopy (A)
Flame length from the ground level has been determined from the equation for fire line intensity which is given by Santoni et al. (2006) as:
I=259.83L2.174 (20)
6.
Results and discussions
[image:4.595.315.544.101.345.2]Table 2. Fire behaviour in olive shrub fire
Maximum fire intensity Rate of spread Flame height Average canopy height Maximum temperature
(MWm−1) (m min−1) (m) (m) (◦C)
[image:5.595.50.287.95.348.2]20 500 0.4 7.5 3 1060
Fig. 3. Vertical temperature variation with plume height for 21 MWm−1shrub fire.
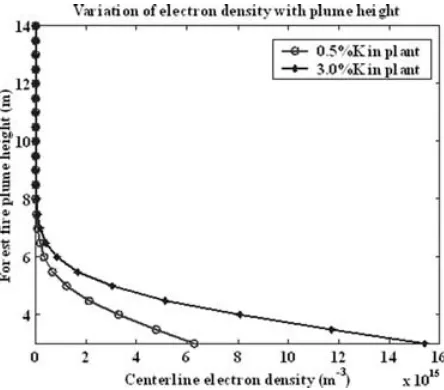
Fig. 4. Electron density variation with plume height for 90 MWm−1
crown fire.
simulated to be 5.7×10¹³m−3(Fig. 4). The density decreased gradually to negligible quantities when compared to those of the canopy in the thermal plume at high altitudes.
Centreline electron density of jack pine vegetation which con-tained 0.5% potassium decreased from 1.41×10¹⁷to 2.33× 10¹³m−3at the flame (Fig. 4). The electron density continued to decrease steadily to a value 4.33×10¹²at 22 m above ground.
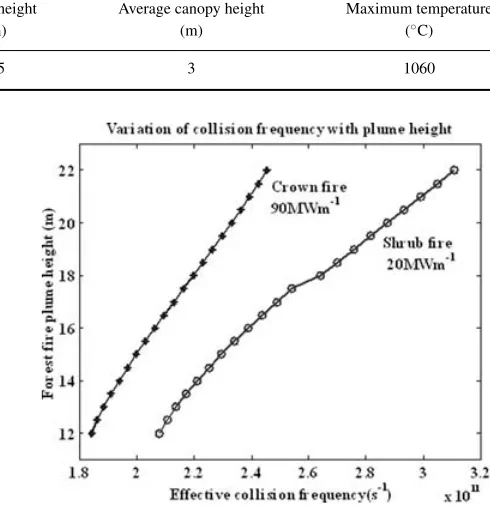
Fig. 5. Effective collision frequency variation with plume height for the fires.
Momentum transfer effective collision frequency for the very high intensity crown and shrub fires were calculated from eq. (11) with the collision cross section obtained from Itakawa (1973). The observed collision frequencies for both the crown and shrub fires ranged from 1.8 to 2.6×10¹¹s−1(see Fig. 5).
Conductivity as calculated from eq. (17) followed a simi-lar trend to that of variation of electron density with plume height. For vegetation which contained 3.0% potassium, cen-treline steady-state conductivity decreased from 0.053 mhom−1 at the canopy to 9.0×10⁻⁶ mhom−1 at the flame tip. It also decreased gradually thereafter. Conductivity for the flame from vegetation which contained 0.5% potassium decreased slower than for the flame from vegetation which contained 3.0% potas-sium. It decreased from 0.022 mhom−1at the canopy to 4.0× 10⁻⁶mhom−1at the flame tip (Fig. 6).
[image:5.595.277.522.98.353.2] [image:5.595.52.276.383.575.2]Fig. 6. Steady-state conductivity variation with plume height for the crown fire.
Fig. 7. Electron density variation with plume height for 21 MWm−1
shrub fire.
Centreline electron density of jack pine vegetation which con-tained 0.5% potassium decreased from 6.30×10¹⁵to 5.64× 10¹²m−3at the flame (Fig. 7). The electron density continued to decrease steadily to a value 4.76×10⁷at 14 m above ground.
Conductivity in the shrub fire decreased rapidly with the in-crease in plume height. The model predicted a dein-crease in centre-line steady-state conductivity from 0.0021 mhom−1at the shrub canopy to 3.0×10⁻⁶ mhom−1at the flame tip for vegetation which contained 3.0% potassium (Fig. 8). Electrical conduc-tivity of a flame olive shrub which contained 0.5% potassium decreased from 0.0009 mhom−1 at the canopy to 7.0 × 10⁻⁷mhom−1at the flame tip (Fig. 8).
Sukhnandan and Hoch (2002) have investigated the effect of wildfire flame tip conductivity on the electric field strength
be-Fig. 8. Variation of plume steady-state conductivity in shrubs with potassium concentration of 0.5%–3.0%.
tween 400 and 275 kV transmission line conductors and the ground using finite element software tool, FEMLAB®v2.2 in plane non-linear standing mode. Their findings are that: for 400 kV line with a flame tip which 30 cm away from a conductor, flame tip conductivity required for flashover to occur is roughly 2×10⁶ mhom−1; for 275kV line with a flame 30 cm away, a conductivity of 5×10⁶ mhom−1 is required for flashover to occur. The flame conductivities obtained from Sukhnandan and Hoch’ simulations are very high compared to those calculated from our simulations (only conduction electrons are considered) which might suggest a remote possibility of flashover. However, wildfire flames can be more than 12 m tall. Being this high and conductive, a wildfire plume can bridge gap between ground and a transmission line creating high voltage power flashover.
7.
Conclusions
Very high intensity wildfires (21—90 MWm−1) with tempera-tures in the range of 1300–1600 K produced equilibrium centre-line electron density in the range of 1.5×10¹⁶–3.5×10¹⁷m−3, respectively for vegetation which contained potassium content of 3.0%. The electron density values were lower for vegetation which contained 0.5% potassium. The model predicted electron densities in the range of 6.3×10¹⁵–1.4×10¹⁷m−3.
[image:6.595.315.542.81.271.2] [image:6.595.74.296.302.497.2]The ability of wildfire plumes to conduct electricity makes it potentially dangerous to fire-fighters when they occur under high voltage power lines. This could lead electrocution. Wildfire plumes provide a leakage path for current from the high volt-age conductors to ground causing power outvolt-age. This work may find applications in fire management safety and power failure management for national high voltage transmission grids.
8. Acknowledgments
We would like gratefully to acknowledge Staff Development Office of the University of Botswana for the financial support for this work. The work was partly supported by Emergency Management Australia under project no. 60/2001.
References
Alkemade, M. A. 1979. Fundamentals of Analytical Flame Spec-troscopy. Hilger, Bristol.
Bekker, H. J. J. and Hoch, D. A. 2002. Analysis of factors contributing to unexplained transmission line faults on a high voltage transmission network.IEEE Africon .6th, 655–660.
Butler, C. J. and Hayhurst, A. N. 1998. Kinetics of gas-phase ionization of an alkali metal, A, by the electron and proton transfer reactions: A+H3O+A+.H20+H; AOH+AOH2+ +H20 in fuel-rich flames
at 1800-2250K.J. Chem. Soc. Faraday Trans.98, 2729–2734. Butler, B. W., Cohen, J., Latham, D. J., Schuette, R. D., Sopko, P. and
co-author. 2004. Measurements of radiant emission power and tem-perature in crown fires.Can. J. For. Res.34, 1577–1587.
Cruz, G., Butler, B. W., Alexander, M. E., Forthofer, J. M. and R. H. Wakimoto 2006. Predicting the ignition of crown fire above a spread-ing surface fire. Part I: model idealization.Int. J. Wildl. Fire15, 47–60. de Groot, W. J., Bothwell, P. M., Taylor, S. W., Wotton, B. M., Stocks, B. J. and co-authors. 2004. Jack pine regeneration and crownfire.Can. J. For. Res.34, 1634–1641.
Fonseca, J. R., Tan, A. L., Silva, R. P., Monassi, V., Assuncao, L. A. R. and co-authors. 1990. Effects of agricultural fires on the performance of overhead transmission lines.IEEE Trans. Power Deliv.5, 687–694. Frost, L. S. 1961. Conductivity of seeded atmospheric pressure plasmas.
J. Appl. Phys.32, 2029–2037.
Itikawa, Y. 1973. Effective collision frequency of electrons in gases.
Phys. Fluids16, 831–835.
Jensen, A. P., Frandsen, F. J., Dam-Johansen, K. and Sander, B. 2000. Experimental Investigation of the Transformation and Release to Gas Phase of Potassium and Chlorine during Straw Pyrolysis conditions.
Energy Fuels11, 1026–1032
Judd, T. S., Attiwill, P. M. and Adams, M. A.1996. Nutrient
Concentra-tions in Eucalyptus: A synthesis in relation to difference between taxa, sites and components. In:Nutrition of Eucalypts(eds. P. M. Attiwill, and M. A. Adams). CSIRO Publishing, Melbourne, 123–153. Krishna, P. K., Sangen, E. and Visser, P. 1985. Wood burning stove.Adv.
Heat Transfer17, 215–223.
Latham, D. 1999. Space charge generated by wind tunnel fires.Atmos. Res.51, 267–278.
Porterie, B., Loraud, J. C., Morvan, D. and Larini, M. 1999. A numerical study of buoyant plumes in cross-flow conditions.Int. J. Wildl. Fire 10, 137–143.
Radojevic, M. 2003. Chemistry of forest fires and regional haze with emphasis on Southeast Asia.Pure Appl. Geophys.12, 157–187. Raison, R. J., Khaina, P. K. and Woods, P. 1985. Mechanisms of element
transfer to the atmosphere during vegetation burning.Can. J. Forest Res.15, 132–140.
Sakao, F. and Sato, H. 1969. Nonequilibrium electrical conductivity of potassium – seed argon plasma.Phys. Fluids12, 2063–2071. Santoni, P. A., Simeoni, A., Rossi, J. L., Bosseur, F., Morandini, F. and
co-authors. 2006. Instrumentation of wildland fire: characterization of a fire spreading through a Mediterranean shrub.Fire Safety J.41, 171–184.
Schneider, J. and Hofmann, F. W. 1959. Absorption and dispersion of microwaves in flames.Phys. Rev.116, 244–249.
Shuler, K. E. and Weber, J. 1954. A microwave investigation of the ionisation of hydrogen-oxygen and acetylene-oxygen flames.J. Chem. Phys.22, 491–502.
Sorokin, A., Vancassel, X. and Mirabel, P. 2002. Emission of ions and charged soot particle by aircraft engines.Atmos. Chem. Phys. Discuss.
2, 2045–2074.
Sturgeon, R. E., Berman, S. S. and Kashyaps, S. 1980. Microwave attenu-ation determinattenu-ation of electron concentrattenu-ation in graphite and tantalum tube electrothermal atomizers.Anal. Chem.52, 1049–1053. Sukhnandan, A. and Hoch, D. A. 2002. Fire Induced flashovers of
trans-mission line: theoretical.IEEE Africon .6th, 617–622.
Weber, R. O., Gill, A. M., Lyons, P. R. A. and Mercer, G. N. 1995. Time dependence of temperature above wildland fires.CALM Sci.4, 17–22. Westberg, H. M., Bystrom, M. and Lecker, B. 2003. Distribution of potassium, chlorine and sulphur between solid and vapour phases during combustion of wood and coal.Energy Fuels17, 18–28. Williams, R. P., Congdon, R. A., Grice, A. C. and Clarke, P. J. 2003.
Effect of fire regime on plant abundance in tropical eucalypt savanna of north-eastern.Aust. Austral Ecol.28, 327–338.
Viegas, D. X. 1998. Forest fire propagation.Phil. Trans. R. Soc. Lond. A356, 2907–2928.