by the Comptroller
and Auditor General
Department for Business, Energy & Industrial Strategy
Department for Education
Delivering STEM (science,
technology, engineering
and mathematics) skills
for the economy
Our vision is to help the nation spend wisely.
Our public audit perspective helps Parliament hold
government to account and improve public services.
Report by the Comptroller and Auditor General
Ordered by the House of Commons to be printed on 15 January 2018
This report has been prepared under Section 6 of the National Audit Act 1983 for presentation to the House of Commons in accordance with Section 9 of the Act
Sir Amyas Morse KCB
Comptroller and Auditor General National Audit Office
11 January 2018
HC 716 | £10.00
This study examines whether the departments’ approach
to boosting participation in the science, technology,
engineering and mathematics (STEM) education pipeline
at all levels is likely to address the STEM skills challenge
in a way that achieves value for money.
© National Audit Office 2018
The material featured in this document is subject to National Audit Office (NAO) copyright. The material may be copied or reproduced for non-commercial purposes only, namely reproduction for research, private study or for limited internal circulation within an organisation for the purpose of review.
Copying for non-commercial purposes is subject to the material being accompanied by a sufficient acknowledgement, reproduced accurately, and not being used in a misleading context. To reproduce NAO copyright material for any other use, you must contact [email protected]. Please tell us who you are, the organisation you represent (if any) and how and why you wish to use our material. Please include your full contact details: name, address, telephone number and email.
Please note that the material featured in this document may not be reproduced for commercial gain without the NAO’s express and direct permission and that the NAO reserves its right to pursue copyright infringement proceedings against individuals or companies who reproduce material for commercial gain without our permission.
The National Audit Office study team consisted of:
Abdalla Abdalla, Nick Forbes, Julian Hall, Sarah Hipkiss, Phil Hyde, Marianne O’Neill and Emma Wilding, under the direction of Siân Jones. This report can be found on the National Audit Office website at www.nao.org.uk
For further information about the National Audit Office please contact: National Audit Office
Press Office
157–197 Buckingham Palace Road Victoria
London SW1W 9SP
Tel: 020 7798 7400
Enquiries: www.nao.org.uk/contact-us
Website: www.nao.org.uk Twitter: @NAOorguk
Part Two
Government’s understanding of the need for enhanced STEM skills in the workforce 16
Part Three
The performance of the education pipeline in delivering STEM skills 23
Part Four
The latest initiatives to enhance the development of STEM skills 35
Appendix One
Our audit approach 41
Appendix Two
Our evidence base 43
Appendix Three
Key school-focused STEM initiatives 48
4 Key facts Delivering STEM (science, technology, engineering and mathematics) skills for the economy
Key facts
£990m
spent on, or committed to, key STEM-specifi c interventions between 2007 and autumn 2017
442,000
undergraduate enrolments in STEM subjects in 2015/16
24%
of graduates in STEM subjects known to be working in a STEM occupation six months later
700,000 additional STEM technicians the Gatsby Charitable Foundation estimates will be needed to meet employer demand in the decade to 2024
112,000 STEM apprenticeship starts in 2016/17
8% of STEM apprenticeships started by women in 2016/17, despite
women accounting for over 50% of all apprenticeship starts
£80 million government investment in national colleges, including in high-speed rail; nuclear; onshore oil and gas; and digital
2.6% rise in the number of STEM A level examination entries in 2016/17
compared with the previous year
30.9% fall in the number of enrolments in part-time undergraduate STEM degrees between 2011/12 and 2015/16
Summary
Background
1 STEM stands for science, technology, engineering and mathematics.
In education, it means the study of these subjects, either exclusively or in combination. In employment, STEM refers to a job requiring the application of science, technology, engineering and mathematics skills or a qualification in a relevant subject, or located in a particular industry or sector. There is no universally accepted definition in either setting.
2 Since the early 2000s there has been growing concern, including from government, about how to achieve higher productivity and economic growth in an era of rapid technological change. Over time, this has generated the widely held belief that one of the UK’s key economic problems is a shortage of STEM skills in the workforce. Most recently, the November 2017 policy paper, Industrial Strategy: Building a Britain fit for the future, stated that “…we need to tackle particular shortages of STEM skills. These skills are important for a range of industries from manufacturing to the arts”. Some employers in STEM sectors have also suggested that exit from the European Union (EU) may affect the availability of people with the requisite STEM skills, but the precise impact is hard to predict.
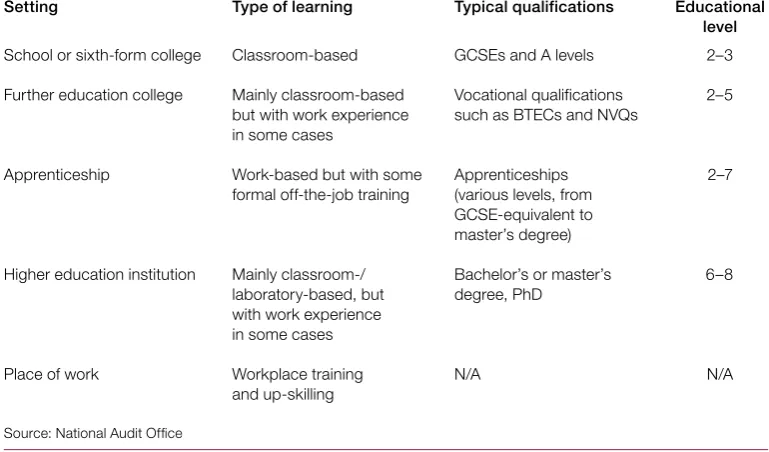
3 People can develop formal STEM skills and knowledge in different ways, either in an educational setting or in the workplace. This can be seen as a ‘pipeline’, through which learners move in order to acquire more advanced abilities. The key routes for developing STEM knowledge and skills are: schools and sixth-form colleges; further education colleges; apprenticeships, which mix work with formal off-the-job training; and higher education institutions.
Government intervention
6 Summary Delivering STEM (science, technology, engineering and mathematics) skills for the economy
5 Aside from the core teaching of STEM subjects, some of the most significant initiatives in terms of spending are:
•
providing higher education institutions with additional money to support their teaching of very high-cost STEM subjects;•
allocating capital funds to enhance higher education STEM teaching facilities; and•
running university technical colleges, which were set up to offer 14- to 19-year-olds a combination of technical, practical and academic learning.Scope and approach
6 This report focuses on government’s overall approach to enhancing STEM skills, and how each section of the STEM skills pipeline is performing, looking in particular at the development of STEM skills in those aged over 16. It covers the situation in England, in keeping with the responsibilities of the key government departments involved. Its main focus is on DfE and BEIS, but it also references a number of other departments that have responsibility. The report examines three main areas:
•
government’s understanding of the need for enhanced STEM skills in the workforce (Part 2);•
what the performance of the education pipeline shows about the effectiveness of past initiatives in delivering STEM skills (Part 3); and•
the opportunities and risks associated with the latest initiatives to enhance the development of STEM skills (Part 4).Key findings
Government’s understanding of the need for enhanced STEM skills in
the workforce
8 Current estimates of the STEM skills problem vary widely, and typically focus only on individual sections of the workforce. Estimates of skills needs generated by sectoral and employer groups tend to be narrow in focus or too generalised to provide a sufficiently detailed understanding of overall STEM skills needs. We have produced our own analysis, which indicates that current and predicted shortages vary by skill level and also demonstrates the difficulty of producing reliable estimates using available data and methodologies. Modelling future needs is especially problematic due to the difficulty of predicting the effects of technological changes and future events (paragraphs 2.13, 2.14, 2.16, and Figure 3).
9 Government does not have a stable and consistent set of definitions for STEM, in either an educational or a work context. STEM is a complex and overlapping group of subject areas that can be defined in a number of different ways, depending on the criteria used. In a work context, Standard Industrial Classification (SIC) or Standard Occupational Classification (SOC) codes can be used to arrive at very different results when analysing ‘STEM jobs’ and identifying the nature and extent of any STEM skills shortage. Without a more stable, consistent set of definitions, government will be less able to understand the problem in a meaningful way, target initiatives effectively, or measure their overall success (paragraphs 2.10 to 2.12).
10 Existing evidence indicates that there is a STEM skills mismatch rather than a simple shortage. A mismatch can include many types of misalignment between the skills needed and those available in the labour pool. Our research indicates that there are particular shortages of STEM skills at technician level, but an oversupply in other areas, such as biological science graduates, who are then often underemployed in an economy in which they are not in high demand. There is also evidence to suggest that, at graduate level and above, the problem is sometimes one of quality rather than quantity, with people not having all of the employability or practical skills they need to enter the workforce (paragraphs 2.14, 2.15 and 2.17 to 2.21).
11 Government is starting to improve coordination on STEM and address past incoherence. Departments have begun taking steps to set out clearly what they are seeking to achieve and what success will look like. A single lead for STEM has been appointed within DfE and, at the end of our fieldwork in September 2017, DfE was developing more specific objectives. Relevant departments were also in the process of establishing new STEM governance boards to foster a joined-up approach. These measures should help to address historical issues of incoherence, but until they are fully implemented, there is a risk that the overall approach remains incohesive, that various strategies that support STEM will not be aligned, and that emerging issues will not be dealt with in a timely way (paragraphs 2.6 to 2.9).
8 Summary Delivering STEM (science, technology, engineering and mathematics) skills for the economy
The performance of the education pipeline in delivering STEM skills
13 Some STEM initiatives have been effective but overall coordination has been lacking. Some initiatives have had a positive impact, and those targeted at A levels saw entries grow by 3% between 2011/12 and 2016/17. However, overall these initiatives are not sufficiently coordinated at programme level to take full advantage of synergies, or to mitigate the risk of duplication. This is exacerbated by the absence of a dedicated evidence-gathering function, and the fact that robust evaluations have not been carried out on all initiatives so far to identify what works (paragraphs 2.2, 2.6, 2.8, 3.3 to 3.5, 4.8 to 4.10 and 4.12, and Figures 4, 5 and 10).
14 Females are underrepresented in most STEM subject areas at every stage of the STEM skills pipeline. In 2016/17, female students accounted for only 42% of all STEM A level exam entries, making up just 9.4% of examination entries in computing, 21.2% in physics, and 39% in mathematics. Females made up only around 8% of STEM apprenticeship starts in 2016/17, despite representing more than 50% of all apprenticeship starts overall, and around 38% of enrolments on undergraduate STEM courses, again despite accounting for more than 50% of all enrolments. There is also evidence of gaps on the basis of other characteristics, such as ethnicity and socio-economic background, but the information and analysis currently available on these characteristics is less comprehensive (paragraphs 3.6, 3.8, 3.19 and 3.23, and Figure 6).
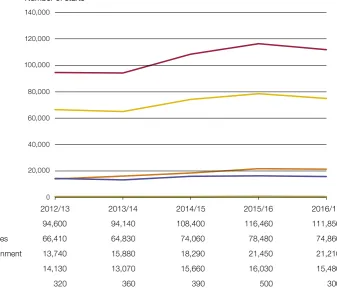
15 The number of people participating in STEM‑related vocational courses has risen in some areas but not others. Starts in STEM apprenticeships grew from 95,000 in 2012/13 to 112,000 in 2016/17. This was mainly driven by growth in apprenticeships covering: engineering and manufacturing technologies; and construction, planning and the built environment. The number of non-apprenticeship STEM further education learning aims being studied, however, remained at around 110,000 between 2011/12 and 2015/16 (paragraphs 3.8, 3.9 and 3.12, and Figure 7).
17 According to longitudinal research, of the 75,000 people who graduated with a STEM degree in 2016, only 24% were known to be working in a STEM occupation within six months. Some of the remainder, including the 15,000 (19.9%) whose destinations are unknown and the 13,000 (17.6%) going on to further study, may end up in STEM occupations. Improvements are currently being made to the quality of the graduate outcomes data, including delaying the data collection point to between 12 and 18 months after graduation. This should help DfE do more to understand why the proportion of STEM graduates entering STEM occupations is so low, and what can be done to improve the situation (paragraph 3.20).
The latest initiatives designed to enhance the development of STEM skills
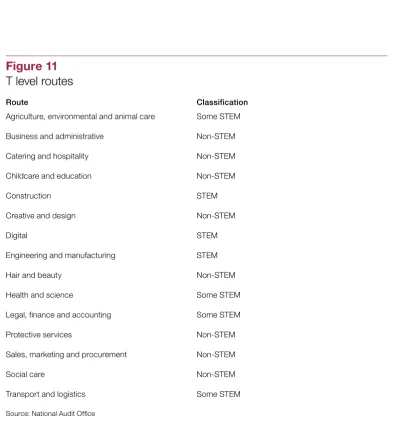
18 There are several new initiatives in further education, which will need to establish their position in an already complex landscape. Technical levels (T levels) are designed to improve vocational education by standardising qualifications, aligning syllabuses with employer demand, and establishing 15 clear ‘routes’ into careers. The national colleges programme aims to develop high-level technical skills in sectors important to the UK economy, four of which focus on STEM skills: high-speed rail; nuclear; onshore oil and gas; and digital. The business case for each college is supported by detailed projections of supply and demand for skills, so they are well-targeted at areas of need within their specific sectors (paragraphs 2.15, 4.3 and 4.4, and Figures 10 and 11).
19 The November 2017 industrial strategy policy paper re‑stated a proposal for institutes of technology, which will target skills gaps at levels 4 and upwards, particularly in STEM areas. As new institutions being introduced into an already crowded provider marketplace, there is a risk that they may face challenges in establishing their position (paragraph 4.5).
20 In the schools sector, better training and attempts to attract former teachers back to the workforce show some positive results. Early stage research indicates that the £67 million maths and physics teacher supply package, aimed at recruiting an additional 2,500 teachers and improving the skills of 15,000 non-specialist teachers in these subjects, is having a positive impact. However, a recent National Audit Office report also found that elements of the programme have been less successful, with the return to teaching pilot, for example, recruiting 428 returning teachers, just over half of its target of 810, of whom 330 completed the training provided (paragraph 4.8).
Conclusion on value for money
21 DfE and BEIS face a complex challenge to improve the quality of teaching and student take-up in key STEM subjects. Some of their initiatives are achieving positive results but there remains an urgent need for a shared vision of what they are trying to achieve and coordinated plans across government. The absence of a precise
10 Summary Delivering STEM (science, technology, engineering and mathematics) skills for the economy
Recommendations
22 DfE should:
a Configure the labour market intelligence generated by Skills Advisory Panels and other mechanisms so that it enables effective decision‑making. Currently, the case for increasing the supply of STEM skills is based on different pieces of research that provide insufficient insight into the nature of the challenge.
b Provide departments with clarity on the different STEM definitions used in different contexts, and reasons for these different definitions. Without this clarity, meaningful comparisons of progress across different policy areas will always be challenging.
23 BEIS should:
c Strengthen its work to evaluate and identify what is effective in its activities to promote participation in STEM education and skills development, and ensure this is shared with its delivery partners. A range of different entities oversee or deliver activities to promote STEM. BEIS should continue to share good practice among them.
d Working with other departments, use data on skills mismatches resulting from EU exit to establish the position across relevant sectors and determine whether key capabilities are at risk. At present, there are clearly conflicting views about the likely impact on the availability of skilled workers and the flow of higher education students.
24 DfE and other key departments should:
e Take steps to influence the skills marketplace in priority areas where insufficient development of STEM skills is taking place. Departments are starting to take positive steps towards establishing better mechanisms to identify priority areas, but this intelligence will only be meaningful if the departments have the ability to influence the marketplace to develop the necessary skills.
f Fully embed a more structured approach to STEM across government.
Part One
Background
Definition
1.1 STEM stands for science, technology, engineering and mathematics. In education, it means the study of these subjects, either exclusively or in combination. In employment, STEM refers to work that:
•
involves the application of science, technology, engineering or mathematics knowledge and skills; and/or•
requires an appropriate qualification in a STEM subject; and/or•
is located in a particular industry or sector, such as pharmaceuticals, construction or aerospace.1.2 There is no universal definition of what should be counted as a STEM subject or job. For example, researchers sometimes include different subjects when calculating the number of STEM students. The situation with job classifications is much more complex, because many jobs within STEM sectors do not require STEM skills (for example, a human resources specialist in an engineering company), while some jobs in non-STEM sectors clearly do require STEM skills (for example, an IT support specialist in a law firm).
12 Part One Delivering STEM (science, technology, engineering and mathematics) skills for the economy
Figure 1 Shows Key routes for formal development of STEM knowledge and skills
Concern about the supply of STEM skills in the workforce
1.4 Since the early 2000s, there has been a growing focus on how to achieve increased productivity and economic growth in an era of rapid technological change. Government concern goes at least as far back as the 2002 Roberts review, which considered the difficulties that employers faced in recruiting highly skilled scientists and engineers.1
1.5 This concern has generated a widely held belief that one of the UK’s key economic problems is a broad shortage of STEM skills in the workforce. The November 2017 policy paper, Industrial Strategy: Building a Britain fit for the future, included ‘people’ as one of its five themes, and stated that “…we need to tackle particular shortages of STEM skills. These skills are important for a range of industries from manufacturing to the arts”.2
1 Sir Gareth Roberts, SET for success: the supply of people with science, technology, engineering and mathematics skills, April 2002.
[image:14.595.154.539.188.414.2]2 HM Government, Industrial Strategy: Building a Britain fit for the future, November 2017.
Figure 1
Key routes for formal development of STEM knowledge and skills
Setting Type of learning Typical qualifications Educational level
School or sixth-form college Classroom-based GCSEs and A levels 2–3
Further education college Mainly classroom-based but with work experience in some cases
Vocational qualifications such as BTECs and NVQs
2–5
Apprenticeship Work-based but with some formal off-the-job training
Apprenticeships (various levels, from GCSE-equivalent to master’s degree)
2–7
Higher education institution Mainly classroom-/ laboratory-based, but with work experience in some cases
Bachelor’s or master’s degree, PhD
6–8
Place of work Workplace training and up-skilling
N/A N/A
1.6 It is difficult to measure precisely the economic impact of STEM skills, but research in STEM-reliant sectors helps to illustrate their value. EngineeringUK has calculated that around 5.7 million people, or 19% of the UK workforce, work in engineering organisations and that engineering contributes around 26% of the UK’s gross domestic product.3 Similarly, in 2014, the Confederation of British Industry reported that the gross
value added (a standard measure of the value of goods and services produced) per employee in the advanced manufacturing sector stood at £49,000 compared with a national average of £37,000.4
1.7 Exit from the European Union (EU) could affect the availability of people with the requisite STEM skills in the workplace. EngineeringUK has reported, for example, that the UK is “highly dependent” on attracting and retaining workers from overseas to meet the current shortfall of engineering graduates.5 This makes the UK skills picture highly
sensitive to any changes that might arise.
Government responsibility for STEM skills
1.8 There is no unified government STEM skills programme, and responsibility for different elements is spread across a number of departments (Figure 2 overleaf). The Department for Education (DfE) is responsible for the main formal learning routes: schools, colleges, apprenticeships, and higher education institutions. It is also responsible for generating research on employers and skills needs.6 The Department for Business,
Energy & Industrial Strategy (BEIS) has overall responsibility for the industrial strategy, develops insights into key business sectors, and leads on doctoral training. It also leads a STEM inspiration programme, encouraging young people to consider STEM careers by running science and engineering activities, mainly within a schools setting.7
1.9 Other departments also play an important role. The Department for Digital, Culture, Media & Sport (DCMS) is concerned with the broad development of digital and cyber security skills, and encouraging businesses to take appropriate action to defend themselves and their customers from cyber attack. The Ministry of Defence has a large apprenticeships programme, mainly in STEM areas, and has a particular need for engineering skills. The Department for Transport is interested in skills among its workforce that support national infrastructure projects, such as building the High Speed 2 rail line. Most STEM definitions exclude medicine and dentistry, so we do not specifically consider the healthcare sector in this report.
3 EngineeringUK, Engineering UK 2017: The State of Engineering, February 2017.
4 Confederation of British Industry, Engineering our future: Stepping up the urgency on STEM, 2014. 5 See footnote 3.
6 This was a function carried out by the UK Commission for Employment and Skills until it closed in early 2017. 7 BEIS’s STEM inspiration programme is delivered in conjunction with a number of partner bodies, including STEM
14 Part One Delivering STEM (science, technology, engineering and mathematics) skills for the economy
Figure 2 shows Responsibility for funding, managing and delivering STEM skills is spread across a number of departments
Funding
1.10 Funding the development of STEM skills involves several departments, and is embedded across a number of non-STEM specific policy areas. Aside from the core teaching of STEM subjects, some of the most significant initiatives in terms of spending are:
•
providing higher education institutions with additional money to support their teaching of very high-cost STEM subjects;•
allocating capital funds to enhance higher education STEM teaching facilities; and•
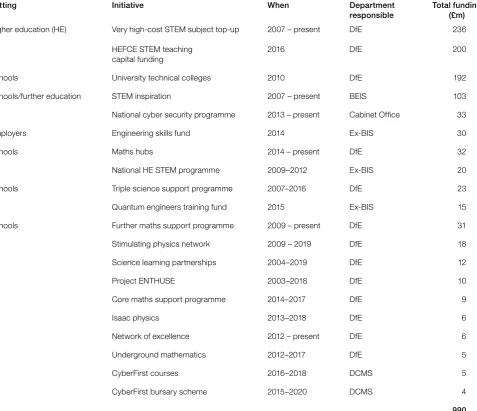
running university technical colleges, which were set up to offer 14- to 19-year-olds a combination of technical, practical and academic learning.1.11 We estimate that total dedicated spending on key STEM initiatives from 2007 to 2017 amounts to around £990 million,8 in addition to the mainstream educational
funding that has been spent on STEM.
[image:16.595.46.540.207.453.2]8 This includes the sum currently committed to existing STEM initiatives.
Figure 2
Main departmental responsibilities for STEM
Department for Education
• Schools • Further education • Higher education • Apprenticeships • Lifelong learning • Careers strategy
• Labour market intelligence
Source: National Audit Offi ce
Responsibility for funding, managing and delivering STEM skills is spread across a number of departments
Ministry of Defence
• Defence STEM engagement programme • STEM apprenticeships
programme
Other departments
• HM Treasury • Cabinet Office • Home Office
Department for Transport
• Transport infrastructure skills strategy
• STEM apprenticeships programme
Department for Digital, Culture, Media & Sport
• Digital skills • Cyber security • Digital strategy
Department for Business, Energy & Industrial Strategy
Scope of this report
1.12 This report focuses on government’s overall approach to enhancing STEM skills, and on how each section of the STEM skills pipeline is performing, looking in particular at the development of STEM skills in those aged over 16. It expands on a number of issues covered by our recent report on the higher education market.9 It covers
the situation in England, in keeping with the responsibilities of the key government departments involved.10 Although it is focused on DfE and BEIS, who have primary
responsibility for STEM activities, the report references a number of other departments that also share responsibility for delivering STEM skills.
1.13 The report covers three main areas:
•
government’s understanding of the need for enhanced STEM skills in the workforce (Part Two);•
what the performance of the education pipeline shows about the effectiveness of past initiatives to enhance STEM skills (Part Three); and•
the opportunities and risks associated with the latest initiatives to enhance STEM skills (Part Four).1.14 The report does not evaluate all the STEM programmes in place over recent years, but focuses on key initiatives in schools, apprenticeships, further education and higher education.
9 Comptroller and Auditor General, The higher education market, Session 2017-19, HC 629, National Audit Office, December 2017.
16 Part Two Delivering STEM (science, technology, engineering and mathematics) skills for the economy
Part Two
Government’s understanding of the need for
enhanced STEM skills in the workforce
2.1 This part examines:
•
whether government maintains a high-quality evidence base to help define the STEM skills challenge, based on robust definitions;•
the leadership and success measures underpinning efforts to boost STEM skills;•
popular estimates of STEM skills shortages, and the evidence for a STEM skills ‘mismatch’ rather than universal shortages; and•
how government is dealing with the potential impact of exit from the European Union (EU).The quality of the evidence base
2.2 Government does not currently have a robust, independent evidence base that defines the STEM skills problem. The industrial strategy green paper acknowledged this gap, noting that “part of the problem has been the lack of a single authoritative source” of evidence on skills needs, and that such a source needs to be established.11
2.3 The case for increasing the supply of STEM skills, as set out in the green paper and the November 2017 policy paper Industrial Strategy: Building a Britain fit for the future, is therefore built on research conducted by employer representative groups, including EngineeringUK and the Confederation of British Industry (CBI).12 This research indicates
an undersupply of people with the right STEM skills in general terms. However, it does not analyse the undersupply – for example, by sub-sector, region or skill level – in a way that can fully identify the problem. In addition, other pieces of skills research draw different conclusions. For example, a 2015 UK Commission for Employment and Skills (UKCES) report suggested that the problem, for ‘high-level’ STEM skills at least, relates to the quality rather than the quantity of people with qualifications in STEM subjects entering the workforce.13
11 HM Government, Building our Industrial Strategy, January 2017, p. 45.
12 HM Government, Building our Industrial Strategy, January 2017; HM Government, Industrial Strategy: Building a Britain fit for the future, November 2017.
2.4 UKCES, the main body previously responsible for producing labour market intelligence and a strategic overview of skills supply, closed in early 2017. It published regular analyses of skill needs, including the ‘Working Futures’ reports, which provided 10-year projections of demand for skills across the whole economy.
2.5 As of November 2017, the Department for Education (DfE) was considering how it might develop an authoritative source of intelligence. Since early 2017, it has been developing plans for a network of Skills Advisory Panels. These are regional entities that will work with employers, education providers and other local partners to assess and manage skills needs in each region.
Leadership and measurement of impact
2.6 DfE takes the lead for the majority of STEM interventions, but the lack of formal coordination across government creates a risk that the overall approach is not cohesive, strategies that support STEM are not aligned, and emerging issues are not dealt with in a timely way. For example, while the Department for Business, Energy & Industrial Strategy (BEIS) is responsible for the industrial strategy, the Department for Digital, Culture, Media & Sport (DCMS) is responsible for the UK digital strategy and DfE, with input from other departments, leads on the careers strategy. This situation is further complicated by the number of additional stakeholders involved. The Royal Academy of Engineering, for example, has identified over 600 organisations, aside from employers and universities, involved in STEM education in some way.14
2.7 DfE has begun to address these issues. As of November 2017 it has appointed a single lead for STEM, and the Department is in the process of establishing a departmental STEM Programme Board, which aims to facilitate a joined-up approach to STEM within the Department and across government. The Department also plans to establish a cross-governmental STEM governance group. These are positive developments, but they will need to be properly embedded and maintained to ensure they function effectively. There have been previous attempts to establish cross-departmental STEM governance bodies or working groups, but none have lasted long enough to have a meaningful impact.
2.8 To date, the departments have not collectively set out precisely what they are seeking to achieve in their efforts to boost STEM skills, or what success will look like. Broadly, their approach is to encourage higher participation in STEM subjects at all levels of the pipeline, which is expected to increase the flow of people with appropriate STEM skills into the workplace. This approach is not surprising, given the lack of rigorous intelligence on the nature of the problem, and the challenges of predicting STEM skills needs into the future. The success of government initiatives can be measured only against the very general objective of increasing participation in STEM education.
18 Part Two Delivering STEM (science, technology, engineering and mathematics) skills for the economy
2.9 As of November 2017, DfE advised us that it was in the process of developing detailed success measures for its work to boost STEM skills. It is too early to draw any conclusions about these measures.
The definition of STEM subjects and jobs
2.10 Improving the evidence base is made more complex by the lack of consistent and well-understood definitions, both in an educational and labour market context. For example:
•
identifying STEM subjects tends to be more straightforward in post-16 education, given the narrow range of A level subjects generally studied. In higher education, the Joint Academic Coding System (JACS) is commonly used to designate STEM subjects. However, researchers vary in the way they treat disciplines such as medicine and sports science, and many subjects conventionally regarded as non-STEM, such as geography or economics, include STEM elements; and•
in a work context, there is huge scope for different definitions of what makes up a STEM job. STEM jobs are typically identified by the industry or occupation in which they take place, based on Standard Industrial Classification (SIC) codes or Standard Occupational Classification (SOC) codes respectively, but each code covers hundreds of classes of industry and occupation.2.11 This lack of consistent definitions can lead to starkly contrasting research findings, which in turn undermines government’s ability to understand the problem and target its programmes effectively. For instance:
•
in 2012, the Royal Academy of Engineering and EngineeringUK used the same UKCES data to estimate the demand for engineering skills between 2010 and 2020. The Royal Academy of Engineering concluded that 1.23 million science, engineering and technology workers would be needed over this period, while EngineeringUK concluded the figure was around 2.2 million.15,16 The variation wasmostly due to differences in the footprint of occupations each body identified as ‘engineering’, as per SOC code classifications; and
•
in 2014, the Royal Society found that 50% of those working in STEM jobs were women, while researchers from the Women in Science and Engineering (WISE) campaign concluded the figure was around 13%.17,18 This discrepancy was againdue to differences in the occupations labelled as STEM by each body and, to a lesser extent, the different datasets used.
15 Royal Academy of Engineering, Jobs and Growth: the Importance of Engineering Skills to the UK Economy, September 2012.
16 EngineeringUK, Engineering UK 2012:The State of Engineering, 2012. 17 Royal Society, A picture of the UK scientific workforce, February 2014.
2.12 In 2012, a House of Lords study recommended that “Government should work together with the Higher Education Statistics Agency, the research councils, higher education institutions, and professional bodies to formulate and apply a standard definition of STEM”.19 However, this broad piece of work has not been carried out.
In early 2017, the Royal Society established a working group, with input from a number of organisations, to compile an exhaustive list of STEM SOC codes. It aimed to produce a standard taxonomy of STEM occupations by the end of 2017.
Estimates of the STEM skills problem
2.13 Broad estimates of the nature of STEM skills shortages vary widely according to which definition, dataset and methodology are used. Estimates tend to be based on employer surveys, along with modelling of educational and occupational data. Most surveys involve a relatively small sample of employers, and modelling is particularly problematic due to the unpredictable impacts of technological changes (which are especially relevant to many STEM occupations) and future events like exit from the EU.
2.14 Recent estimates of shortages have focused on particular sectors or disciplines, and include:
•
in 2017, EngineeringUK estimated an annual shortage of around 45,000 people with engineering skills at levels 3 and above, based on estimated annual demand of 158,000 for skills at this level (or just over 1.5 million by 2024);20•
in 2014, the Gatsby Charitable Foundation estimated that up to 700,000 STEM technicians would be required over the next decade to meet employer demand;21 and•
in 2013, the Social Market Foundation estimated an annual shortage of 40,000 STEM graduates each year to 2020.222.15 As part of its programme to set up national colleges, BEIS undertook detailed analysis of skills needs in a small number of specific sub-sectors. The business case for each college included a rigorous analysis of the current and projected supply and demand for skills for that industry. The business case for the National College for Nuclear, for example, was based on work by the Nuclear Energy Skills Alliance that examined individual occupations by region and skill level, and concluded that the industry will require an additional 2,200 full-time equivalent workers with high-level STEM skills each year.
19 House of Lords Select Committee on Science and Technology, Higher Education in Science, Technology, Engineering and Mathematics (STEM) subjects, July 2012.
20 EngineeringUK, Engineering UK 2017:The State of Engineering, 2017.
20 Part Two Delivering STEM (science, technology, engineering and mathematics) skills for the economy
figure_stacked_bar_135mm
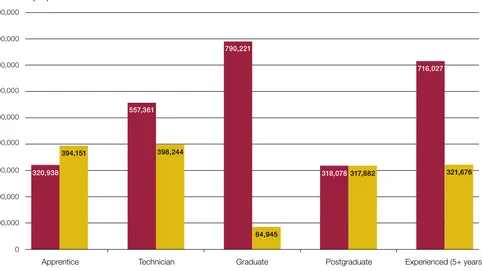
2.16 In the absence of a definitive figure, we carried out our own analysis
[image:22.595.50.532.375.646.2](see Appendix Two for a fuller explanation of our methodology). We estimate that, in 2015, employers in England experienced around 2.7 million STEM recruitment shortages, and they expected around 1.5 million in 2018 (Figure 3). Our estimate also suggests employers expect these shortages to fall in 2018, particularly at graduate level. Shortages in other areas are expected to persist, particularly for apprentices and technicians. This analysis also demonstrates the difficulty of understanding the true nature and extent of the STEM skills problem using sample-based survey methodologies and existing national-level datasets. By itself this would not provide a sufficiently detailed basis on which to intervene, and does not distinguish between problems with availability of skills and problems with employers’ approaches to accessing those skills.
Figure 3
Estimate of employer-reported STEM recruitment shortages: 2015 and (expected) 2018
Estimated recruitment shortages vary substantially by level of STEM-qualified employee
Number of people
STEM recruitment shortage 2015
Expected STEM recruitment shortage 2018
Notes
1 We carried out this analysis by matching 2015 CBI education and skills survey responses (quoted in the industrial strategy green paper) with Office for National Statistics data on businesses in England.
2 We have weighted the estimate by size of CBI survey respondent, and have used a figure of 1% of each business’s workforce (to a minimum of one person) to generate a numerical estimate.
Source: National Audit Office analysis of survey information from the Confederation of British Industry and data produced by the Office for National Statistics
Apprentice Technician Graduate Postgraduate Experienced (5+ years)
0 200,000 300,000 400,000 500,000 600,000 700,000 900,000
800,000
100,000
320,938
394,151
557,361
398,244
790,221
84,945
318,078317,882
716,027
2.17 Our fieldwork also identified recurring issues that point towards a wider STEM ‘mismatch’, in which there is oversupply of some skills and undersupply of others. This term covers various situations arising from a misalignment between the skills needed in the economy and those available in the labour pool, of which skills shortages are just one part.23
2.18 Recent research, along with the experience of many of the stakeholders we interviewed, suggests there is an acute shortage of technician-level STEM skills.24
Interviewees attributed this shortage to an undersupply of people with level 3 to
5 vocational qualifications over the last 20 years, due to lower participation in vocational education.25 This lack of new entrants has led employers to rely on an ageing workforce,
many of whom are now reaching retirement age.
2.19 But there is also an oversupply of some STEM qualifications, particularly at degree level. For instance, there appears to be a surfeit of biological science graduates, a greater proportion of whom enter non-graduate roles compared to the STEM average. This is evidenced by the fact that more biological science graduates earn low salaries 40 months after graduation, compared to the STEM average, and the average for all subjects.
2.20 Both the oversupply of some graduate-level skills and the undersupply of
technician-level skills can result in graduates occupying technician-level roles for which they are overqualified and under-skilled. This can lead to low morale and high staff turnover. Graduate-level skills may not align directly with those required in technician-level roles, particularly in engineering-related occupations, where technicians are likely to have expertise in particular processes or instruments that graduates may lack.
2.21 For some higher-level (e.g. graduate) roles, the issue is not a shortage of people with the relevant qualifications, but the skills these people hold. This includes particular technical skills that employers expect graduates to have, or ‘softer’ employability skills. This indicates that, in some areas, there are sufficient people with high-level STEM skills to meet demand, but these individuals do not possess all the skills required by employers. This problem is generally attributed to some higher education institutions not possessing the right equipment, courses being more focused on theoretical topics than vocational application, and a lack of work experience opportunities.
2.22 As of November 2017, DfE was setting up Skills Advisory Panels (SAPs) to work with Local Enterprise Partnerships (LEPs) at a regional and local level to better understand and address regional and local skills needs.26 There is a risk that this will be
hampered by differences in quality between SAPs, as our recent report found in relation to combined authorities, and of incoherence across regions.27
23 Government Office for Science, Skills Demand, Training and Skills Mismatch: A Review of Key Concepts, Theory and Evidence, 2016, p. 27.
24 Technical vocational skills below degree level. The 2014 Gatsby Charitable Foundation report Our Work Supporting Technicians noted the shortage of skills at this level.
25 This is corroborated by the 2016 Report of the Independent Panel on Technical Education, which noted that the post-secondary technical education sector in England is very small by international standards.
26 The DCMS-led Digital Skills Partnerships, set out in the industrial strategy policy paper, will perform a similar role for digital skills.
22 Part Two Delivering STEM (science, technology, engineering and mathematics) skills for the economy
The likely impact of exit from the EU
2.23 The impact of exit from the EU is hard to predict, but some major science and engineering bodies believe it could reduce the availability of STEM skills. Engineering the Future, an alliance of professional engineering bodies hosted by the Royal Academy of Engineering, for example, noted that the UK’s existing engineering skills shortage could be exacerbated if access to the EU’s engineering workforce is limited.28 The CBI has
also expressed concern about possible restrictions on the rights of non-graduate EU workers to work in the UK, which would include those with technician-level skills.29
2.24 Some science and engineering bodies also believe there could be a reduction in the numbers of EU and other international students coming to study STEM subjects at higher education level. For example, the Engineering the Future alliance has noted that it is reasonable to assume “many students from EU member states would see studying within the EU as a more attractive option”, particularly if UK universities charge them tuition fees at overseas student levels.30 In 2015/16 there were 438,000 international
students in the UK (19% of the total student population), with 127,000 from the EU. A reduction in these numbers could have a dual impact, for instance:
•
tuition fee income from EU-domiciled students could fall; and•
some postgraduate taught courses in STEM subjects rely on EU and overseas students to remain viable, so may have to be discontinued if they fail to attract enough non UK-domiciled students.312.25 As of November 2017, BEIS and DfE were involved in cross-government work to assess the wider impacts of exiting the EU. This work is being informed by the Migration Advisory Committee, the independent body responsible for advising government on migration issues.
28 Engineering the Future, Engineering a future outside the EU, October 2016. 29 Confederation of British Industry, Making a Success of Brexit, December 2016. 30 See footnote 28.
Part Three
The performance of the education pipeline in
delivering STEM skills
3.1 This part examines:
•
the range of recent initiatives designed to enhance STEM skills in various parts of the education pipeline; and•
the performance of the pipeline in terms of trends in A levels, apprenticeships and further education, higher education and lifelong learning.Recent key initiatives to enhance STEM skills
24 Part Three Delivering STEM (science, technology, engineering and mathematics) skills for the economy
[image:26.595.53.531.184.595.2]Figure 4 Shows Key STEM initiatives, 2007–17
Figure 4
Key STEM initiatives, 2007–2017
Setting Initiative When Department
responsible
Total funding (£m)
Higher education (HE) Very high-cost STEM subject top-up 2007 – present DfE 236
HE HEFCE STEM teaching
capital funding
2016 DfE 200
Schools University technical colleges 2010 DfE 192
Schools/further education STEM inspiration 2007 – present BEIS 103
All National cyber security programme 2013 – present Cabinet Office 33
Employers Engineering skills fund 2014 Ex-BIS 30
Schools Maths hubs 2014 – present DfE 32
All National HE STEM programme 2009–2012 Ex-BIS 20
Schools Triple science support programme 2007–2016 DfE 23
HE Quantum engineers training fund 2015 Ex-BIS 15
Schools Further maths support programme 2009 – present DfE 31
Stimulating physics network 2009 – 2019 DfE 18
Science learning partnerships 2004–2019 DfE 12
Project ENTHUSE 2003–2018 DfE 10
Core maths support programme 2014–2017 DfE 9
Isaac physics 2013–2018 DfE 6
Network of excellence 2012 – present DfE 6
Underground mathematics 2012–2017 DfE 5
CyberFirst courses 2016–2018 DCMS 5
HE CyberFirst bursary scheme 2015–2020 DCMS 4
990
Notes
1 These initiatives are additional to routine public funding for STEM learning at all levels.
2 For programmes running for more than one year, the cost shown is the aggregate cost incurred since the inception of the programme, insofar as this can be precisely determined. These costs are expressed in cash terms and have not been adjusted for infl ation during the period. 3 The costs shown in this table also include amounts currently committed to key existing initiatives.
4 The cost included for university technical colleges relates to set-up costs only.
5 The engineering skills fund comprised three separate initiatives worth £10 million each, established in response to Professor John Perkins’ Review of Engineering Skills (November 2013): ‘Developing Women Engineers’, ‘Improving Engineering Careers’ and ‘Improving Engineering Skills in Smaller Companies’.
6 STEM inspiration activities commenced in the 1990s, but only actual and committed expenditure since 2007 has been included. 7 The cost for the science learning partnerships relates to the 2016-19 contract only.
8 This list was correct as at the end of our fi eldwork (September 2017).
9 BEIS = Department for Business, Energy & Industrial Strategy; DCMS = Department for Digital, Culture, Media & Sport; DfE = Department for Education; HEFCE = Higher Education Funding Council for England.
Figure XX Shows...
A levels
3.3 Between them, the Department for Education (DfE) and the Department for
Business, Energy & Industrial Strategy (BEIS) oversee a large number of initiatives aimed at improving the take-up and delivery of STEM subjects at school. Further detail about these is set out in Appendix Three. Insofar as they have been carried out, evaluations of these programmes suggest that they have had some positive impacts (Figure 5).
Figure 5
Evaluation of school-focused initiatives
Initiative Summary of evaluation(s) performed
Triple science support programme (TSSP)
The evaluation of the 2014-16 contract found that 90% of schools indicated that the programme helped improve their triple science provision. It enabled schools to provide more high-quality continuing professional development (CPD) and bespoke support to their staff than they otherwise would have, and helped the pace of development of triple science at target schools.
Some aspects of the programme, such as the networking support and online resources, were found to be less effective.
Further maths support programme
Providers saw an increase or sustainment of the number of further maths students.
Science learning partnerships
69% of teachers participating in local CPD events reported greater motivation and engagement in lessons among pupils, and 43% noted improved progress in science. Teachers involved in CPD provided by STEM Learning Ltd are also more likely to remain in the profession than those who are not.
Stimulating physics network
The programme performed strongly against the key performance indicators evaluated, with 89% of teachers reporting increased pupil engagement in physics lessons, 96% of heads of science/physics reporting a positive impact on departmental culture and practice, and 62% of mentee teachers identifying a positive impact from their mentor support.
Project ENTHUSE An evaluation of the ENTHUSE partnership strand found it had a very positive impact, with the majority of school leaders and teachers reporting it had increased pupils’ engagement with, and attainment in, STEM subjects, and their awareness of STEM career paths.
STEM inspiration The STEM ambassadors scheme was found to increase the number of young people who pursue STEM study post-16, and who go into STEM careers.
Participants on CREST Silver Awards are more likely to take a STEM subject post-GCSE compared with the wider pupil population, but are self-selecting and tend to come from a more privileged socio-economic background and have stronger prior educational attainment.
Network of excellence The evaluation noted the difficulty of precisely measuring the impact of the programme, but anecdotal evidence indicated elements of the programme, such as ‘master teachers’, were found to be very helpful for computer science teachers.
CPD activities took place after school hours so some teachers struggled to engage with them, and it was found that the programme could not meet the needs of all schools.
Note
26 Part Three Delivering STEM (science, technology, engineering and mathematics) skills for the economy
STEM A level trends
3.4 STEM A level examination entries increased from 252,000 in 2011/12 to 259,000 in 2016/17, a 3% rise against a 4.8% fall in entries overall.32 Provisional data indicate that
participation in STEM subjects accounted for 34.9% of all A level entries in 2016/17 (up from 32.3% in 2011/12), having grown by 2.6% compared with the previous year following three years of faltering growth, although this masks persistent problems in some areas.
3.5 In 2016/17 physics, which is seen as a requirement for many STEM careers, grew particularly strongly after two years of decline in absolute and proportional terms (Figure 6). Biology and chemistry followed a similar pattern, but remain below 2013/14 levels in both absolute and proportional terms. In terms of attainment, outcomes in STEM subjects in 2016/17 were better than in non-STEM subjects. STEM subjects saw an average point score (APS) of 36.5, compared with an APS of 35.7 across all subjects.33
3.6 There is a consistent gender participation gap in most STEM subjects. In 2016/17, females made up 42% of all STEM A level examination entries, including just 9.4% of entries in computing, 21.2% in physics (Figure 6) and 39% in mathematics. Conversely, females made up 61.8% of A level biology entries. In terms of outcomes, females regularly outperform males in many STEM subjects and results overall are very similar. Female students had an APS of 36.3 in STEM subjects in 2016/17, compared with 36.6 for male students. This participation gap shows that young women represent a pool of potential STEM-skilled people that is currently being lost to the economy.
STEM teaching workforce
3.7 DfE has sought to improve the STEM teaching workforce and give STEM subjects more importance in the curriculum, but the challenges in these areas are considerable. Our 2016 report Training new teachers found that some STEM subjects suffer from acute teacher shortages.34 For example, it found that the proportion of physics classes
taught by a teacher without a relevant post A level qualification rose from 21% to 28% between 2010 and 2014, and that the leaving rates for mathematics and science teachers were above average. DfE offers increased payments to trainee teachers in a range of high-demand subjects. For 2018/19 DfE is offering up to £28,000 of additional funding for trainee teachers in physics, chemistry and computing, and up to £26,000 for trainees in biology. It has also introduced a total payment of up to £32,000 to mathematics trainees, consisting of training scholarships of up to £22,000 (or bursaries of £20,000) and a total of £10,000 in retention payments if they remain in teaching for 5 years post-qualification.
32 The A levels we have classified as STEM are: mathematics, further mathematics, biology, chemistry, physics, ICT, computing, other science and design and technology (D&T). The DfE definition of STEM A levels excludes ICT, other science and D&T on the grounds that these are neither ‘facilitating subjects’ as defined by the Russell Group (Informed choices: a Russell Group guide to making decisions about post‑16 education, 2016), nor part of the English Baccalaureate qualification. The subjects DfE classifies as STEM performed especially strongly over the period, growing by 12.9% between 2011/12 and 2016/17, and 9.8% between 2015/16 and 2016/17. 2016/17 data are provisional and subject to change.
33 Average point score (APS) assigns a numerical value to each grade achieved, with an A* worth 60 points and an E worth 10 points. The APS for a group of subjects is calculated by totalling the score for each grade achieved and dividing by the number of examination entrants in those subjects.
figure_stacked_bar_135mm
Females 6,452 6,596 6,736 6,811 6,652 6,947
Males 24,297 25,312 25,490 25,113 24,396 25,750
Physics as a percentage 3.9 4.1 4.3 4.2 4.2 4.4
[image:29.595.99.550.207.491.2]of total A level entries
Figure 6
Trends in A level physics entries from 2011/12 to 2016/17 (provisional), by gender
Number of examination entries %
Females typically make up only around a fifth of all entries in A level physics
Note
1 The collection methodology changed slightly between 2014/15 and 2015/16, with a new data source being introduced. The impact of this change appears to be very small: when applied retroactively to 2014/15, for example, the total number of A level entries fell from 758,625 (using the previous methodology) to 758,565, but we have shown this change in methodology in the graph with the vertical dashed line.
Source: National Audit Office analysis of data gathered by the Department for Education
2011/12 2012/13 2013/14 2014/15 2015/16 2016/17
0 5,000 10,000 15,000 20,000 25,000 30,000
35,000 5.0
4.0
3.0
2.0
1.0
28 Part Three Delivering STEM (science, technology, engineering and mathematics) skills for the economy
Apprenticeships and further education
3.8 The number of starts in STEM apprenticeships grew from 95,000 in 2012/13 to 112,000 in 2016/17, an increase of around 18%, when they accounted for 22.6% of all starts (compared to 18.5% in 2012/13).35 This was mainly driven by growth in
apprenticeships covering: engineering and manufacturing technologies; and construction, planning and the built environment. Starts in other STEM areas performed less well
(Figure 7). However, there is a clear gender disparity, with females making up around 8% of STEM apprenticeship starts in 2016/17 despite representing over 50% of apprenticeship starts in total.
3.9 Our 2016 report on apprenticeships found that ongoing reforms to the
apprenticeship system, such as the introduction of new standards, had been welcomed by employers. But many employers, particularly small and medium-sized enterprises, struggle to engage with the design process due to the resources required. Data suggest that while the overall number of apprenticeship starts fell by 2.8% in 2016/17 compared with 2015/16, the number of starts on higher apprenticeships rose from 27,000 to 37,000 over the same period, a 34.8% increase.
3.10 Some further education providers have reported difficulties accessing capital funding under the new funding system led by Local Enterprise Partnerships (LEPs), and are therefore disincentivised from taking on the financial risk involved in running costly STEM courses. Since 2015, responsibility for distributing DfE capital grant funding has been entirely devolved to LEPs, who distribute it on a competitive basis according to the priorities set out in their strategic economic plans. Some providers have faced difficulties accessing this funding, relying instead on cash reserves and private loans to finance investment in STEM facilities. Providers therefore need to take a strategic approach to educational provision in each area, in conjunction with stakeholders such as LEPs, local authorities and other providers, to ensure they realise maximum value from any investment. The recent area reviews of post-16 education and training, which focused on aligning provision locally, may help foster this coordination.
3.11 Other challenges in the provision of STEM training in further education include:
•
funding following the pupil, so schools are financially disincentivised from encouraging pupils to opt for further education routes;•
the patchy nature of careers advice and work experience available at schools, which makes it more difficult for pupils to understand the full range of options open to them;36 and•
providers struggling to offer some courses due to the absence locally of sufficient numbers of students and/or employers to make courses financially viable.35 The four sector subject areas we have identified as STEM are: construction, planning and the built environment; engineering and manufacturing technologies; information and communication technology; and science and mathematics. 36 House of Commons Sub-Committee on Education, Skills and the Economy, Careers education, information advice
3.12 The industrial strategy green paper also pointed out that non-apprenticeship further education consists of a “bewilderingly complex array” of qualifications, including BTECs, diplomas, awards and certificates, delivered by a variety of provider types.37 The number
of qualification types available, and the lack of clear pathways through them, makes it difficult for learners, providers and employers to navigate and understand. The number of non-apprenticeship learning aims studied by learners at level 3 and above (excluding A levels) remained at around 110,000 between 2011/12 and 2015/16.38
37 HM Government, Building our Industrial Strategy, January 2017.
[image:31.595.210.548.211.508.2]38 These figures are derived from the ‘National Aims Report’, as published by DfE in December 2016. This report lists all ‘learning aims’ (individual courses that are often combined to form different qualifications), and shows the number of learners enrolled on each by academic year. Individual learners can study multiple aims each year (e.g. as part of a qualification made up of multiple aims), so can be counted multiple times in the report. Also, the report excludes aims in years where there are fewer than 100 enrolments. The National Aims Report therefore provides an approximate indicator of levels of participation in non-apprenticeship, non A level FE study.
Figure 7
STEM apprenticeship starts, 2012/13 to 2016/17
Number of starts
0 20,000 40,000 60,000 120,000 140,000
2012/13 2013/14 2014/15 2015/16 2016/17
Starts grew overall between 2012/13 and 2016/17, but have declined over the past year
80,000 100,000
Notes
1 The sector subject areas identified as STEM are in line with those awarded STEM top-up funding by the Education and Skills Funding Agency. 2 All numbers are rounded to the nearest 10.
Source: National Audit Office analysis of Department for Education data
Total STEM 94,600 94,140 108,400 116,460 111,850
Engineering and manufacturing technologies 66,410 64,830 74,060 78,480 74,860
Construction, planning and the built environment 13,740 15,880 18,290 21,450 21,210
ICT 14,130 13,070 15,660 16,030 15,480
30 Part Three Delivering STEM (science, technology, engineering and mathematics) skills for the economy
Higher education
STEM funding
3.13 In recent years, DfE has sought to change the higher education sector through reforms to funding and the abolition of the cap on student numbers.
Funding reform means that institutions are now reliant on tuition fees for the majority of their student-related income, and the amount that the Higher Education Funding Council for England (HEFCE) allocates for teaching fell from around £4.3 billion in 2011/12 to around £1.3 billion in 2017/18.
3.14 HEFCE funding for each institution is based on measures including the number and characteristics of students and the subjects studied, recognising that STEM subjects typically involve higher delivery costs. The abolition of caps on student numbers gives institutions control over the number of places they offer. These reforms aim to make the system more demand-led, incentivising institutions to structure their mix of courses, and the number of places offered, to match demand from prospective students.39
3.15 HEFCE supports provision of some high-cost STEM subjects that have historically struggled to remain financially viable. Its ‘very high-cost STEM funding’ targets four subject areas: chemical engineering; chemistry; mineral, metallurgy and materials engineering; and physics. The funding began in 2007 when student demand for these subjects appeared to be in decline, and some departments faced closure. In 2016/17, HEFCE awarded around £24 million to 51 institutions on condition that they continue to maintain taught programmes in these very high-cost subjects. HEFCE also provides a high-cost subject top-up to institutions to offset the costs in excess of the £9,000 tuition fee associated with high-cost subjects, which includes most STEM subjects.40 Between 2012/13 and 2015/16, the total amount paid to institutions under
the high-cost subject top-up was around £1.5 billion.
3.16 In 2015/16, HEFCE also awarded around £200 million of capital funding to provide new or upgraded STEM teaching facilities to support the expansion of student numbers, including meeting increased demand from STEM graduates. This funding was allocated on the basis of a competition and match-funded by recipients, and is expected to increase student numbers on STEM courses by 10%.
39 The new Teaching Excellence Framework reinforces institutions’ accountability to students for the quality of the educational experience offered, including the design and range of courses.
Undergraduate numbers in STEM subjects
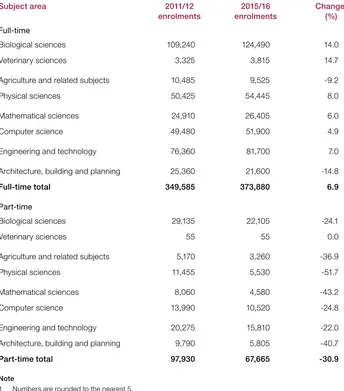
3.17 Undergraduate enrolments in STEM subjects represent just under a third of enrolments in all subjects. Overall numbers fell slightly from around 448,000 in 2011/12 to 442,000 in 2015/16 (a 1.3% fall), against a 12.4% decline in overall enrolments across the same period, but this masks very different trends for full-time and part-time courses. Enrolments on full-time STEM courses grew by 24,000 (6.9%) against an overall rise of 13,000 (1.1%), while on part-time they fell by 30,000 (30.9%) against an overall fall of 214,000 (47%, Figure 8 overleaf). Where there has been growth this appears to reinforce rather than address reported skills mismatches.
3.18 The highest growth has been in biological sciences, which may already have a surfeit of graduates, whereas enrolments in subjects where employer demand is higher, like engineering and technology or physical sciences, have either grown by less or fallen. Overall, students studying STEM subjects achieve higher grades than those in non-STEM subjects: in 2015/16, 92.4% of STEM students achieved at least a lower second-class degree, compared with 90.7% of non-STEM students, and 27.4% of STEM students achieved a first class degree, compared with 20.9% of non-STEM students.41
3.19 As with other stages of the pipeline, there is also a marked gender disparity in higher education, which reflects the pattern set down at A level. Gender breakdowns are only available for UK-wide figures, which show that in 2015/16 female students made up 38.3% of undergraduate STEM enrolments, despite accounting for 56.4% of enrolments overall. They predominate in biological sciences (61.2% in 2015/16), but are in the minority in most other STEM subjects, including in engineering and technology (14.9%) and mathematics (37.7%).
3.20 Large numbers of people leaving STEM courses do not progress to work in STEM occupations, particularly from higher education. Longitudinal research by the Higher Education Statistics Agency (HESA) indicates that, of the 75,000 people graduating in 2015/16 from full-time STEM degree courses, only just over 18,000 (24.2%) were known to be working in a STEM occupation within six months.42 Some of the remainder,
including the 15,000 (19.9%) whose destinations are unknown and the 13,000 (17.6%) going on to further study, may end up in STEM occupations. In early 2017, HESA began work to improve its data collection methodology, which will include delaying data collection until 12–18 months after graduation to take account of the lead-time for new graduates entering sustained employment. This improved data should become available from 2020, providing DfE with better information about the transition rates of STEM graduates into STEM occupations, and enabling it to do more to understand why the proportion of STEM graduates entering STEM occupations is so low, and what can be done to improve the situation.
41 Higher Education Statistics Agency data, showing first degree classes awarded on an FTE basis by English institutions. 42 National Audit Office analysis of Higher Education Statistics Agency data. If calculated as a percentage of only the
32 Part Three Delivering STEM (science, technology, engineering and mathematics) skills for the economy
Figure 8 Shows Undergraduate STEM subject enrolments in England, 2011/12 to 2015/16
[image:34.595.157.501.201.592.2]3.21 An independent evaluation of the 3-year, £20 million National Higher Education STEM Programme, which sought to enhance the recruitment and development of chemistry, engineering, mathematics and physics students, found it had met its aims overall, and noted that it coincided with a growth in participation in these subjects. However, it could not determine the impact of individual initiatives, or evidence any impact on the institutional culture at universities. The Department for Digital, Culture, Media & Sport-led CyberFirst bursary scheme offered a £4,000 bursary and work placements to students studying cyber security as a degree or degree apprenticeship, but the impact of this scheme is unclear at this point.
Figure 8
Undergraduate STEM subject enrolments in England, 2011/12 to 2015/16
Trends in part‑time enrolments are very different from trends in full‑time enrolments
Subject area 2011/12 enrolments 2015/16 enrolments Change (%) Full-time Biological sciences Veterinary sciences 109,240 3,325 124,490 3,815 14.0 14.7
Agriculture and related subjects Physical sciences 10,485 50,425 9,525 54,445 -9.2 8.0 Mathematical sciences Computer science 24,910 49,480 26,405 51,900 6.0 4.9
Engineering and technology 76,360 81,700 7.0
Architecture, building and planning
Full‑time total 25,360 349,585 21,600 373,880 -14.8 6.9 Part-time Biological sciences Veterinary sciences 29,135 55 22,105 55 -24.1 0.0
Agriculture and related subjects
Physical sciences 5,170 11,455 3,260 5,530 -36.9 -51.7 Mathematical sciences Computer science 8,060 13,990 4,580 10,520 -43.2 -24.8
Engineering and technology
Architecture, building and planning
Part‑time total 20,275 9,790 97,930 15,810 5,805 67,665 -22.0 -40.7 ‑30.9 Note
1 Numbers are rounded to the nearest 5.
Lifelong learning
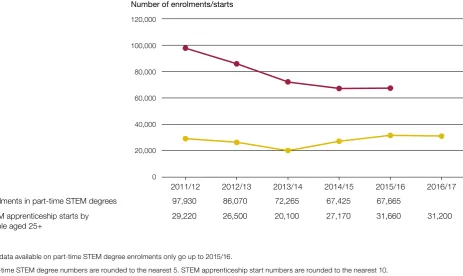
3.22 Overall participation in lifelong learning has fallen since 2011 (Figure 9 overleaf), placing greater pressure on the education system to meet demand for STEM skills. Lifelong learning comprises in-work training (either formal or informal), apprenticeships and part-time learning. It enables people to transition into STEM occupations, progress within them, or maintain the skill levels required to keep pace with rapidly evolving STEM workplaces.43 While STEM apprenticeship starts by people aged 25 and above
have seen a slight increase since 2011/12, enrolments in part-time undergraduate STEM degrees fell from around 98,000 in 2011/12 to just over 67,500 in 2015/16, a 30.9% fall (Figure 8). This collapse in part-time STEM degree enrolments is part of an overall decline in part-time degree enrolments, which fell by 47% overall. Meanwhile, a 2015 report by the Department for Business, Innovation & Skills found that spending on in-work training by employers fell by £2.5 billion between 2011 and 2013, a 17% reduction per employee.44
Diversity
3.23 There is some evidence to indicate a participation gap on the basis of
characteristics other than gender, including ethnicity and socio-economic background, at every stage of the post-16 education pipeline. The incidence and significance of these gaps are difficult to measure with precision due to there being less high-quality data and analysis available than for gender, but the quality of the available data is improving.45 More d