Statistical Data 2003
Prepared by The Institute for Employment StudiesPrepared by:
Peter Bates
Contents
Executive Summary 4
1. Methodology 5
1.1 Summary 5
1.2 Methodology 5
2. Headline results for Learner Support 2000/2001 7
2.1 Overall 7
2.2 Learner Support Funding and age 7
2.3 Learner Support Funding and gender 8
2.4 Learner Support Funding and ethnicity 9
2.5 Learner Support Funding and college type/mode of
attendance/residential status 11
2.6 Qualification aims 13
2.7 Learner Support Funding and reported disability/learning difficulty 14
2.8 Learner Support Funding and widening participation uplift 15
2.9 Learner Support Funding, retention/withdrawal and
achievement rates 17
3. Retention 19
4. Achievement 24
Appendix 1: Additional Tables 29
A1 Learner support (headline numbers) 29
A2 Learner support by age (per cent) 33
Executive Summary
Methodology
The results presented in this report are based on an amalgamation of data from the LSC’s Individualised Student Records (ISR 20 /22) and the manual returns for 2000/2001. The ISR is a collection of data on all students enrolled at colleges in the Further Education sector, including specialist-designated colleges and students in external institutions on provisions that are funded by the LSC.
Key Findings
Some of the key findings of this report are as follows:
• Overall, 7.9 per cent of Further Education students studying on council funded provisions were in receipt of some form of Learner Support Funding.
• 6.9 per cent of students received Access Funds, 0.9 per cent of students received Childcare Support and 0.1 per cent of students received Residential Bursaries.
• Broken down by age, 15.4 per cent of students between 16 to 18 years old, 9.5 per cent of 19 to 24 year olds, and 4.1 per cent of those 25 years old or over are estimated to be in receipt of Access Funds.
• On the subject of gender, 60 per cent of Further Education students were female, compared with 64 per cent of Access Fund recipients. The higher proportion of female students receiving Access Funds may partly reflect Access Fund allocation relating to childcare.
• Members of ethnic minoritieswere proportionally more likely to be in receipt of Learner Support Funding than their white counterparts, forming at least 13 per cent of the overall student population, but 23 per cent of the Access Fund recipients.
• Recipients of Access Funds or Residential Bursaries were more likely to report a disability or learning difficultythan their student counterparts who did not receive such funding. 6.2 per cent of Access Fund recipients report a learning difficulty and 5.2 percent of Access Fund recipients report a disability, compared to 2.6 per cent and 2.9 per cent respectively among non-recipients.
• The data demonstrate that Access Funds and Childcare Support are targeted
towards students living in areas of greatest deprivation. Residents in areas with the highest deprivation were twice as likely to receive Access Funds than residents in areas of low deprivation.
• Retention rates are higher among Access Fund students than among students overall. In the population as a whole, the Retention rate was just over 81 per cent, compared with Access Fund recipients (87 per cent), Childcare recipients (88 per cent), and Residential Bursaries (90 per cent).
1.
Methodology
1.1 Summary
This report reviews the allocation and impact of Learner Support Funding among students studying within institutes of Further Education.
The main body of the report is in three parts:
• Chapter 2 provides headlines on the distribution of Access Funds, and other government funds or initiatives, by student characteristics, college and course types.
• Chapter 3 examines in greater detail the association between Learner Support Funding and retention.
• Chapter 4 focuses on the relationship between Learner Support Funding and
achievement.
The Appendix provides additional headline (numbers) estimates for people in receipt of Learner Support Funding by individual and course characteristics, broken down by age groups (ie ’16 to 18’, ’19 to 24’ and ‘25 or over’).
1.2 Methodology
1.2.1 Data sets
The results presented in this paper are based on an amalgamation of data from the LSC’s Individualised Student Records (ISR 20/22) and the manual returns for 2000/2001. The Individualised Student Records (ISR) is a collection of data on all students enrolled at colleges in the Further Education sector, including specialist-designated colleges and students in external institutions on provisions that are funded by the LSC. Each student has a single record in the student data set providing details of the student’s individual characteristics, including their date of birth, sex and ethnicity. They also have one or more associated records in the qualification aims data set, recording details of each qualification they are taking, the type of course and Learner Support arrangement.
1.2.2 Reporting of Learner Support
To overcome the potential problems associated with the under-reporting of Learner Support within the ISR, the ISR estimates have been ‘grossed up’ using estimates from the manual returns data. Given the degree of under-reporting, and consequently the size of the corresponding grossing factors, cases in which the reported cell sizes are small (under 1,000) should be treated with caution. All numbers presented in this paper have been rounded to the nearest 100.
Finally, it must be stressed that these estimates are an attempt to improve upon the undercounting of Learner Support recipients within ISR 20/22. They should not, however, be used to comment upon the student population in general, ie on issues not specifically related to Learner Support, as in such instances the unweighted ISR data may be a more appropriate reference.
1.2.3 Future analysis
A question that will arise regarding the current approach is one of longitudinal comparability and reproducibility. To avoid double collection, in future years the manual returns data will not report on the number of students in receipt of awards. This will not be an issue if successful measures are undertaken to improve the reporting of student level data within the ISR. However, in the event of undercounting within future data sets, there will be a need to develop new approaches to this research. It is beyond the scope of this paper to consider how future analysis will be conducted but there are a number of options that may be worth reviewing.
At present, the ISR records the type of government initiative from which a student is benefiting and allows a value of ‘0’ to be recorded if no information is provided/the student is not in receipt of support. If future years were to distinguish between ‘no information provided/available’ and ‘not in receipt of support’, it maybe possible to assess the degree of ‘item non-response’ associated with the Learner Support variables and to track the level of non-response more easily at the college level. The additional information maybe used to control for the effects of such non-response. This is similar to the approach currently used in coding ethnicity fields and those relating to learning difficulties and/or disabilities.
A second possibility would be for researchers to consider the relationship between the average number, amount and types of awards made available and the average number of students in receipt of those awards. The assumption underlying any analysis, however, is that it would be possible to find an association that remains constant. Even if this is true of previous years, it may not be true of future ones, particularly if there are changes to the policy environment (eg through the introduction of EMAs).
It is clear, however, that future research would require early consideration of these issues and potential alternatives.
1.2.4 Sample
2.
Headline Results for Learner
Support 2000/2001
2.1 Overall
There were approximately 3.5m students studying council funded courses within Further Education institutions between 2000/2001. Almost eight per cent (7.9) of these students are in receipt of some form of Learner Support Funding.
Broken down by types of funds, approximately seven (6.9) per cent of students received Access Funds, 0.9 per cent of students received Childcare Support and 0.1 per cent of students received Residential Bursaries.
2.2 Learner Support Funding and age
The majority of students in Further Education (over 80 per cent) were 19 years old and over. This is reflected in the distribution of Access Fund recipients, where nearly 60 per cent were over the age of 18. In the case of Childcare Support, over 90 per cent were over the age of 18. Residential Bursaries were the main exception and 65 per cent of students receiving Residential Bursaries were under 19 years old, while 90 per cent were under the age of 25.
Figure 2.1: Distribution of Learner Support Funding by age group (per cent)
Table 2.1: Learner Support Funding by age group
Access Residential Childcare None Total
16 to 18 inclusive 102,500 1,800 2,900 557,100 664,400 19 to 24 inclusive 41,000 700 6,700 381,300 429,800 25 and over 100,900 300 21,800 2,318,000 2,441,000
Access
Residential bursary
Childcare support
None of the above
0% 10% 20% 30% 40% 50% 60% 70% 80% 90% 100%
2.3 Learner Support Funding and gender
Females are more likely to benefit from Learner Support Funding than their male counterparts. Sixty per cent of Further Education students were female, compared with 64 per cent of Access Fund recipients. The higher proportion of female students receiving Access Funds may partly reflect Access Fund allocation relating to childcare.
Figure 2.2: Distribution of Learner Support Funding by sex (per cent)
Source: IES Analysis
In Table 2.2, we can see that females have greater representation among Access Fund recipients irrespective of age group. The fact that more than 70 per cent of recipients who are over 25 years old were female, may reflect the use of Access Funds to support childcare-related needs.
Table 2.2: Learner Support Funding by gender and age group (per cent)
Access Residential Childcare None Total 16 to 18 inclusive
Female 57.5 49.4 66.3 50.6 51.7 Male 42.5 50.6 33.7 49.4 48.3 Total 100.0 100.0 100.0 100.0 100.0
19 to 24 inclusive
Female 61.7 46.6 86.9 56.1 57.1 Male 38.3 53.4 13.1 43.9 42.9 Total 100.0 100.0 100.0 100.0 100.0
25 and over
Female 70.6 47.2 83.6 62.0 62.5 Male 29.4 52.8 16.4 38.0 37.5 Total 100.0 100.0 100.0 100.0 100.0
Source: IES Analysis
Access
Residential bursary
Childcare support
None of the above
0% 10% 20% 30% 40% 50% 60% 70% 80% 90% 100%
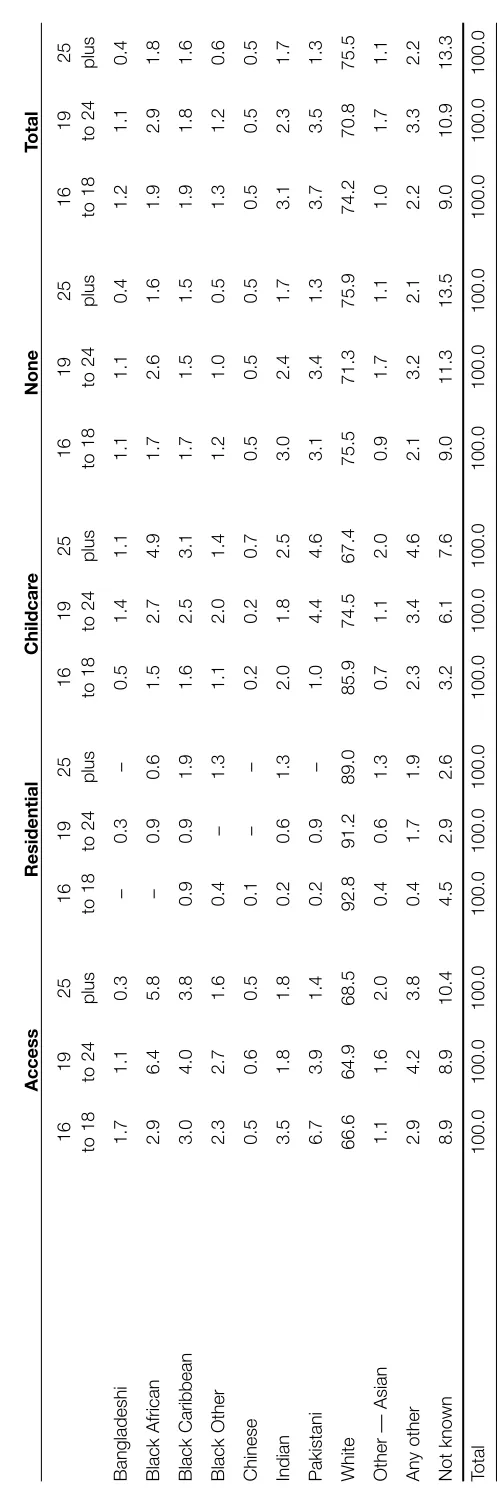
2.4 Learner Support Funding and ethnicity
Table 2.3: Distribution of Learner Support Funding by ethnicity (per cent)
Access Residential Childcare None Total
Bangladeshi 1.0 0.1 1.1 0.6 0.6 Black African 4.7 0.3 4.1 1.7 2.0 Black Caribbean 3.5 1.0 2.9 1.5 1.7 Black Other 2.1 0.5 1.5 0.7 0.8 Chinese 0.5 0.1 0.6 0.5 0.5 Indian 2.5 0.5 2.3 2.0 2.0 Pakistani 4.0 0.4 4.2 1.8 2.0 White 67.1 91.9 70.6 75.3 74.7 Other — Asian 1.6 0.6 1.7 1.2 1.2 Any other 3.5 0.9 4.1 2.2 2.3 Not known 9.5 3.9 6.9 12.5 12.2 Total 100.0 100.0 100.0 100.0 100.0
Source: IES Analysis
T
able 2.4: Lear
ner Support Funding by ethnicity and age gr
oup (per cent)
Access Residential Childcar e None T otal 16 19 25 16 19 25 16 19 25 16 19 25 16 19 25 to 18 to 24 plus to 18 to 24 plus to 18 to 24 plus to 18 to 24 plus to 18 to 24 plus Bangladeshi 1.7 1 .1 0.3 – 0.3 – 0.5 1 .4 1.1 1 .1 1.1 0 .4 1.2 1 .1 0.4 Black African 2.9 6 .4 5.8 – 0.9 0 .6 1.5 2 .7 4.9 1 .7 2.6 1 .6 1.9 2 .9 1.8 Black Caribbean 3.0 4 .0 3.8 0 .9 0.9 1 .9 1.6 2 .5 3.1 1 .7 1.5 1 .5 1.9 1 .8 1.6 Black Other 2.3 2 .7 1.6 0 .4 – 1 .3 1.1 2 .0 1.4 1 .2 1.0 0 .5 1.3 1 .2 0.6 Chinese 0.5 0 .6 0.5 0 .1 – – 0.2 0 .2 0.7 0 .5 0.5 0 .5 0.5 0 .5 0.5 Indian 3.5 1 .8 1.8 0 .2 0.6 1 .3 2.0 1 .8 2.5 3 .0 2.4 1 .7 3.1 2 .3 1.7 Pakistani 6.7 3 .9 1.4 0 .2 0.9 – 1.0 4 .4 4.6 3 .1 3.4 1 .3 3.7 3 .5 1.3 White 66.6 64.9 68.5 92.8 91.2 89.0 85.9 74.5 67.4 75.5 71.3 75.9 74.2 70.8 75.5
Other — Asian
1.1 1 .6 2.0 0 .4 0.6 1 .3 0.7 1 .1 2.0 0 .9 1.7 1 .1 1.0 1 .7 1.1 Any other 2.9 4 .2 3.8 0 .4 1.7 1 .9 2.3 3 .4 4.6 2 .1 3.2 2 .1 2.2 3 .3 2.2 Not known 8.9 8 .9 10.4 4 .5 2.9 2 .6 3.2 6 .1 7.6 9 .0 11.3 13.5 9 .0 10.9 13.3 To tal 100.0 100.0 100.0 100.0 100.0 100.0 100.0 100.0 100.0 100.0 100.0 100.0 100.0 100.0 100.0
[image:10.595.96.345.52.799.2]We can see from Table 2.4 that there are some differences between membership of ethnic minority groups, receipt of Learner Support Funding and age. Members of ethnic minority groups appear to have disproportionate representation among Access Fund recipients, irrespective of their age, but the level of disproportion is greatest among those aged 25 years and over. Among 16 to 18 year olds, ethnic minority groups account for at least 16.8 per cent of the student population and 24.6 per cent of the Access Fund population, while among those 25 years old or over they represent 11.2 per cent of the student population and 21 per cent of Access Fund recipients.
2.5 Learner Support Funding and college type/mode
of attendance/residential status
There is some correlation between the types of funding that students may receive and the type of college they attend (Table 2.5). Unsurprisingly, most Residential Bursaries went to students in Specialist Colleges and to students living in accommodation owned or managed by the college (Table 2.6). Students within Specialist Colleges were also around six times more likely to receive Childcare Support. (The breakdown of Tables 2.5 and 2.6 by age, is reported in the Appendix).
Table 2.5: Distribution of Learner Support Funding by institution type (per cent)
Access Residential Childcare None Total
FE college 85.6 15.9 56.4 79.2 79.4 Sixth form college 6.5 – 1.5 5.5 5.6 Specialist college 2.5 82.4 10.4 1.5 1.7 External institution 5.3 – 22.3 9.8 9.6 Specialist designated 0.1 – 9.4 3.9 3.7
Dance/Drama – – – – –
Total 100.0 100.0 100.0 100.0 100.0
Table 2.6: Distribution of Learner Support Funding by residential status (per cent)
Access Residential Childcare None Total
Student living in college
accommodation on campus 0.4 44.6 1.6 0.1 0.2 Student living in college
managed accommodation 4.4 6.3 0.7 2.4 2.5 Student not living in
college accommodation 95.2 49.1 97.7 97.5 97.3 Total 100.0 100.0 100.0 100.0 100.0
Source: IES Analysis
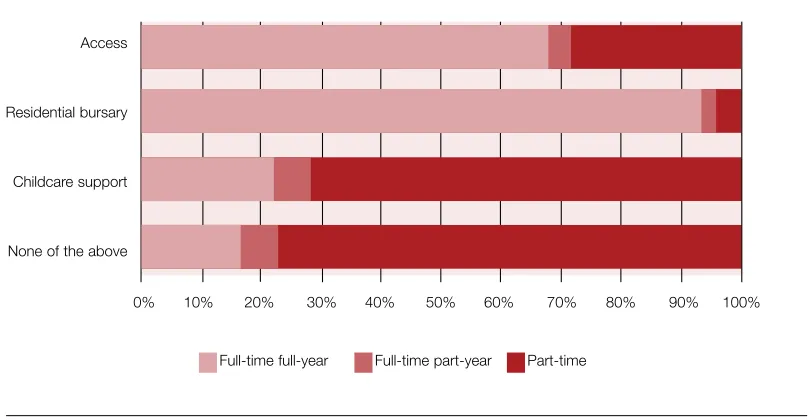
The breakdown by mode of attendance (Figure 2.3) reveals that Learner Support Funding was proportionally more likely to be provided to students on full-time courses than part-time ones.
Figure 2.3: Distribution of Learner Support Funding by mode of attendance (per cent)
Source: IES Analysis
Over three-quarters of council funded students were on part-time courses, while less than 30 per cent of Access Fund recipients studied part-time. Among Childcare Support recipients the distribution is closer to the population as a whole, and just over 70 per cent of students in receipt of Childcare Support were on part-time courses.
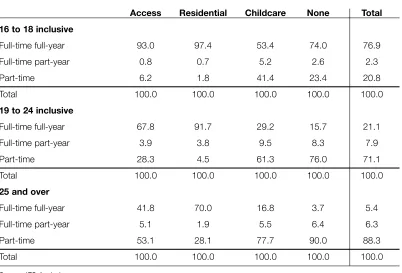
Separating out mode of attendance, age and receipt of Access Funds, suggests that although full-time students were more likely to receive funding than their part-time counterparts, the effect of mode of attendance on the likelihood of receiving support is reduced as age increases (Table 2.7).
Access
Residential bursary
Childcare support
None of the above
Full-time full-year
0% 10% 20% 30% 40% 50% 60% 70% 80% 90% 100%
2.6 Qualification aims
Tables 2.8 and 2.9 illustrate the distribution of Learner Support by level of
[image:13.595.110.512.202.475.2]qualification aim and qualification type. Recipients of Access Funds or Residential Bursaries were generally more likely to be participating in higher level (NVQ level 3 or equivalent) study (Access Fund recipients were twice as likely than the student population as a whole to be studying at NVQ level 3 or equivalent, while those on Residential Bursaries were nearly three times as likely.
Table 2.7: Learner Support Funding by mode of attendance and age group (per cent)
Access Residential Childcare None Total 16 to 18 inclusive
Full-time full-year 93.0 97.4 53.4 74.0 76.9 Full-time part-year 0.8 0.7 5.2 2.6 2.3 Part-time 6.2 1.8 41.4 23.4 20.8 Total 100.0 100.0 100.0 100.0 100.0
19 to 24 inclusive
Full-time full-year 67.8 91.7 29.2 15.7 21.1 Full-time part-year 3.9 3.8 9.5 8.3 7.9 Part-time 28.3 4.5 61.3 76.0 71.1 Total 100.0 100.0 100.0 100.0 100.0
25 and over
Full-time full-year 41.8 70.0 16.8 3.7 5.4 Full-time part-year 5.1 1.9 5.5 6.4 6.3 Part-time 53.1 28.1 77.7 90.0 88.3 Total 100.0 100.0 100.0 100.0 100.0
Source: IES Analysis
Table 2.8: Distribution of Learner Support Funding by NVQ level of qualification aim (per cent)
Access Residential Childcare None Total
1 & Entry 15.2 2.1 24.2 28.5 27.6 2 29.2 27.0 29.6 25.8 26.0 3 49.1 67.9 24.0 23.2 25.0 4, 5 & HE 1.1 1.4 1.3 1.7 1.7 Other 5.4 1.5 20.9 20.8 19.7 Total 100.0 100.0 100.0 100.0 100.0
Table 2.9: Distribution of Learner Support Funding by type of qualification aim (per cent)
Access Residential Childcare None Total
A/AS GCE A2 level 10.2 0.9 1.6 5.9 6.1 GCSE 2.3 0.2 2.2 2.0 2.1 GNVQ precursor 12.5 52.9 4.6 3.7 4.4 GNVQ/AVCE 13.5 6.7 2.1 3.7 4.3 NVQ 13.6 5.9 10.8 8.6 8.9 Access to HE 6.0 1.8 4.1 0.8 1.2 HNC/HND 0.1 0.1 0.0 0.0 0.0
OCN 1.3 – 1.6 1.3 1.3
Additional NVQ/GNVQ 0.0 – 0.0 0.0 0.0 Other 40.5 31.4 73.0 73.9 71.6 Total 100.0 100.0 100.0 100.0 100.0
Source: IES Analysis
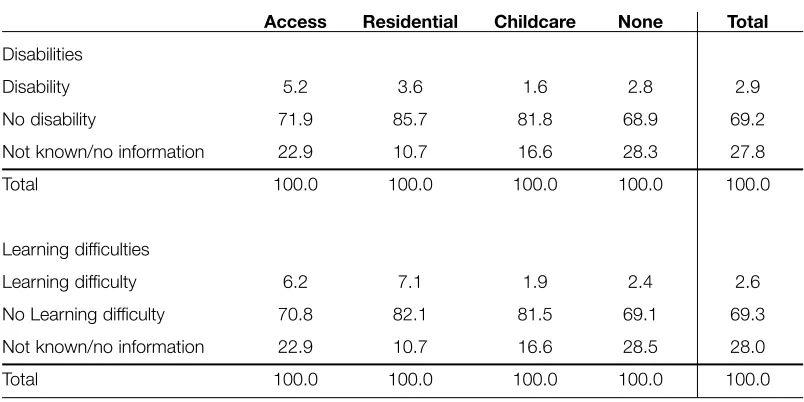
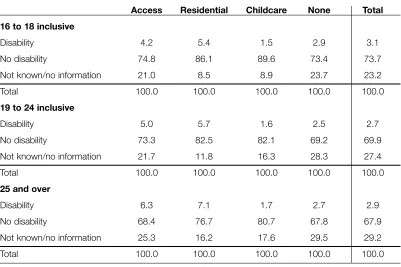
2.7 Learner Support Funding and reported
disability/ learning difficulty
Table 2.10 presents the distribution of Learner Support Funding by whether the student reports a disability or learning difficulty. The data reveals that recipients of Access Fund or Residential Bursary support were more likely to report a disability or learning difficulty than their non-recipient counterparts (6.2 per cent of Access Fund recipients report a learning difficulty and 5.2 per cent of Access Fund
recipients report a disability, compared to 2.6 per cent and 2.9 per cent respectively among non-recipients).
[image:14.595.136.538.577.778.2]The relationship between Learner Support Funding and student age is reported in Tables 2.11 and 2.12. Both Access Fund and Residential Bursary recipients were also more likely to report a disability or learning difficulty than their non-funded counterparts, irrespective of their age group. Among Access Fund recipients, the higher the age group, the more likely (relative to those in their age cohort) the students are to report a disability or learning difficulty.
Table 2.10: Distribution of Learner Support Funding by disability and/or learning difficulty (per cent) Access Residential Childcare None Total
Disabilities
Disability 5.2 3.6 1.6 2.8 2.9 No disability 71.9 85.7 81.8 68.9 69.2 Not known/no information 22.9 10.7 16.6 28.3 27.8 Total 100.0 100.0 100.0 100.0 100.0
Learning difficulties
Learning difficulty 6.2 7.1 1.9 2.4 2.6 No Learning difficulty 70.8 82.1 81.5 69.1 69.3 Not known/no information 22.9 10.7 16.6 28.5 28.0 Total 100.0 100.0 100.0 100.0 100.0
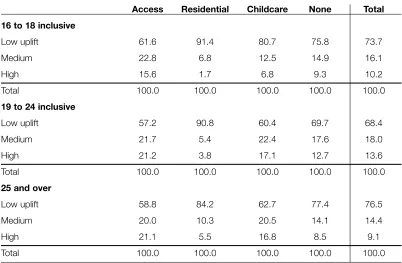
2.8 Learner Support Funding and widening
participation uplift
[image:15.595.109.510.196.463.2]The LSC’s method of allocating widening participation funding is partly based on a modified version of the DTLR’s Index of Deprivation. According to the scale, wards are given funding uplifts ranging from zero to 12 per cent depending on their level of relative deprivation.
Table 2.11: Distribution of Learner Support Funding by disability and age (per cent)
Access Residential Childcare None Total 16 to 18 inclusive
Disability 4.2 5.4 1.5 2.9 3.1 No disability 74.8 86.1 89.6 73.4 73.7 Not known/no information 21.0 8.5 8.9 23.7 23.2 Total 100.0 100.0 100.0 100.0 100.0
19 to 24 inclusive
Disability 5.0 5.7 1.6 2.5 2.7 No disability 73.3 82.5 82.1 69.2 69.9 Not known/no information 21.7 11.8 16.3 28.3 27.4 Total 100.0 100.0 100.0 100.0 100.0
25 and over
Disability 6.3 7.1 1.7 2.7 2.9 No disability 68.4 76.7 80.7 67.8 67.9 Not known/no information 25.3 16.2 17.6 29.5 29.2 Total 100.0 100.0 100.0 100.0 100.0
Source: IES Analysis, 2003
Table 2.12: Distribution of Learner Support Funding by learning difficulty and age (per cent)
Access Residential Childcare None Total 16 to 18 inclusive
Learning difficulty 6.2 10.8 2.9 3.8 4.2 No learning difficulties 73.0 81.2 88.4 72.4 72.6 No information provided 20.8 8.0 8.7 23.8 23.2 Total 100.0 100.0 100.0 100.0 100.0
19 to 24 inclusive
[image:15.595.107.512.511.773.2]Learner Support Funding by uplift factor is illustrated in Figure 2.4. The graph suggests that Access Funds and Childcare Support are targeted towards areas of greatest deprivation. Students in receipt of Access Fund support were twice as likely to be living in a high uplift area than students overall, while students in receipt of Childcare Support were over 60 per cent more likely to be living in such areas.
For the purposes of this analysis, the uplift factor has been grouped into categories labelled ‘low uplift’, ‘medium uplift’ and ‘high uplift’, based on the full population of students taking Further Education courses. The low uplift covers students living in areas that are up to the 75th percentile of the uplift range, medium uplift covers the 75th to the 90th percentile, while high uplift covers those living in areas with uplifts beyond the 90th percentile.
Figure 2.4: Distribution of Learner Support Funding by widening participation factor (per cent)
Source: IES Analysis
Finally, the relationship between Learner Support Funding, widening participation factor and age is reported in Table 2.13. Across each age group, Access Fund recipients were disproportionately more likely to come from areas of high deprivation. However, the propensity of high uplift students to receive funding appears to increase with age. Students between the ages of 16 to 18 represent ten per cent of the high uplift student population, but nearly 16 per cent of Access Fund recipients in high uplift areas. This compares with students who are 25 years old or over, who represent nine per cent of the high uplift area students, but 21.1 per cent of Access Fund recipients in high uplift areas.
Access
Residential bursary
Childcare support
None of the above
High uplift
0% 10% 20% 30% 40% 50% 60% 70% 80% 90% 100%
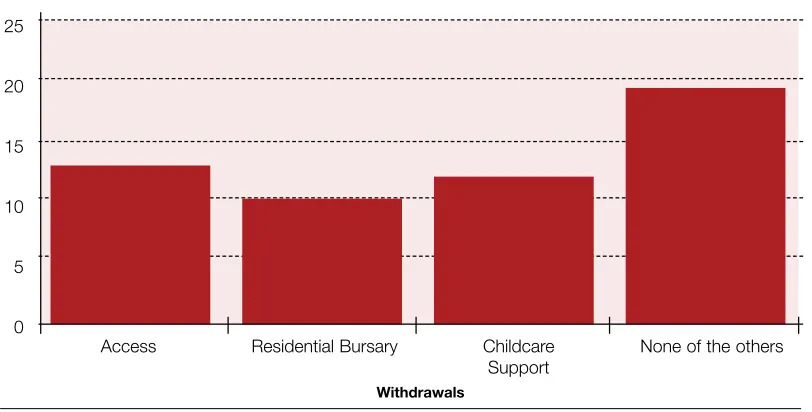
2.9 Learner Support Funding, retention/withdrawal
and achievement rates
Retention/withdrawal rates
Retention status is calculated using the methodology developed in FEFC Performance Indicators 1999/2000. In summary:
• If the student is continuing on any qualification of greater than one week in length, the student is treated as retained.
• If the student has completed at least one qualification, of greater than one week in length, and has not withdrawn from any qualification, the student is treated as retained.
[image:17.595.108.510.344.607.2]• If the student has both withdrawn and completed a qualification, they are treated as retained if they either, completed a qualification after their last withdrawal date, or if their last withdrawal was no more than two months (62 days) after their last completion date.
Table 2.13: Learner Support Funding by widening participation factor and age group (per cent) Access Residential Childcare None Total 16 to 18 inclusive
Low uplift 61.6 91.4 80.7 75.8 73.7 Medium 22.8 6.8 12.5 14.9 16.1 High 15.6 1.7 6.8 9.3 10.2 Total 100.0 100.0 100.0 100.0 100.0
19 to 24 inclusive
Low uplift 57.2 90.8 60.4 69.7 68.4 Medium 21.7 5.4 22.4 17.6 18.0 High 21.2 3.8 17.1 12.7 13.6 Total 100.0 100.0 100.0 100.0 100.0
25 and over
Low uplift 58.8 84.2 62.7 77.4 76.5 Medium 20.0 10.3 20.5 14.1 14.4 High 21.1 5.5 16.8 8.5 9.1 Total 100.0 100.0 100.0 100.0 100.0
Source: IES Analysis
In all other cases the student is considered to have withdrawn from Further Education.
Achievement rates
[image:18.595.137.543.181.387.2]The achievement rates reported in this paper are based on qualifications level data. Courses that were non-council funded, were still in continuation, or for which the result was not yet known, were excluded from the analysis. The achievement rate was thus defined as the proportion of qualifications for which a result was known that had been completed successfully.
Figure 2.5: Distribution of Learner Support Funding by withdrawal rates (per cent)
Source: IES Analysis
Table 2.14 highlights the achievement rates of Learner Support Funding recipients. The results suggest that achievement rates among those in receipt of Learner Support are slightly worse than those who are not in receipt of support. This is possibly because the recipients of Learner Support are among the most
disadvantaged students. Interestingly, when the focus is on students living in areas of high deprivation, those with funding perform slightly better than those who did not receive funding.
Table 2.14: Achievement rates by and Learner Support Funding
% N
Access 71.1 142,200
Residential Bursary 71.3 3,000 Childcare Support 76.5 27,400 None of the above 76.7 4,161,200
Total 76.5 4,333,800
Source: IES Analysis
Access Residential Bursary Childcare Support
None of the others 25
20
15
10
5
0
3.
Retention
This section examines the impact of Learner Support Funding on retention by individual and course-based characteristics. Some of the main conclusions that may be drawn from this analysis are summarised below.
• For both sexes the participation rates of those in receipt of funding was greater than that of the non-recipients. However, the improvement in retention appeared to be greater in males than females.
• When comparisons are made between recipients of Learner Support within
each ethnic minority groupand retention rates, we find that those in receipt of funding (Access or Childcare) had higher retention rates irrespective of their ethnic origin. Access Funds appeared to be associated with the greatest increases in retention among those students from Pakistani and Chinese backgrounds.
• Irrespective of age, students in receipt of funding were less likely than their non-funded counterparts to withdraw from education. The greatest differential in retention between funded and non-funded students was among those aged over 25. It is likely that this is a reflection of the many underlying and inter-related differences between young and mature students (eg differences in course types, mode of attendance, personal circumstances etc.) rather than simply an age effect per se.
• The impact of Access Funding on retention varies with the students’ mode of attendance. Access Funds appear to have a positive impact on retention among those students studying full-time part-year and those studying on part-time courses. There is little difference, however, between full-time full-year students who receive Access Fund support, and those who do not. Students in receipt of Childcare Support had higher retention levels, irrespective of mode of attendance.
• Learner Support Funding is more strongly associated with improvements in
retention among students taking lower level qualifications(eg NVQ levels 2 or below) than higher ones.
Table 3.1: Retention rates by sex and Learner Support Funding
Access Residential Childcare None Total
Retention Number Retention Number Retention Number Retention Number Retention Number
Female 87.5 155,400 90.9 1,400 88.6 26,000 82.5 1,933,300 82.9 2,116,100 Male 86.8 89,000 89.0 1,400 84.3 5,400 78.0 1,323,200 78.6 1,419,100 Total 87.2 244,500 89.9 2,800 87.8 31,400 80.7 3,256,500 81.2 3,535,200
Source: IES Analysis
Table 3.2: Retention rates by age and Learner Support Funding
Access Residential Childcare None Total
Retention Number Retention Number Retention Number Retention Number Retention Number
16 to 18 87.7 91,600 90.3 2,100 87.3 3,300 85.7 565,400 86.0 662,500 19 to 24 84.6 41,600 90.4 1,000 86.5 7,100 77.8 385,200 78.6 434,900 25 & over 87.7 110,900 86.9 500 88.2 21,500 80.0 2,283,400 80.5 2,416,300 Total 87.2 244,100 89.9 3,700 87.7 32,000 80.8 3,235,300 81.3 3,515,100
Source: IES Analysis
Table 3.3: Retention rates by ethnicity and Learner Support Funding
Access Residential Childcare None Total
Retention Number Retention Number Retention Number Retention Number Retention Number
Bangladeshi 89.1 2,500 – – 89.8 400 82.3 19,700 83.2 22,500 Black African 88.2 11,500 – – 91.9 1,300 84.2 57,000 85.0 69,700 Black Caribbean 86.1 8,600 – – 89.0 900 81.8 49,900 82.5 59,400 Black Other 85.9 5,100 – – 86.2 500 80.6 22,000 81.6 27,600 Chinese 91.6 1,300 – – 84.7 200 83.2 15,400 83.8 16,800 Indian 92.3 6,100 – – 92.0 700 85.3 65,600 86.0 72,500 Pakistani 92.4 9,900 – – 88.5 1,300 83.3 60,000 84.7 71,200 White 86.5 164,000 89.6 2,600 87.2 22,200 80.7 2,451,400 81.1 2,640,200 Other — Asian 88.0 3,900 – – 91.7 500 81.7 37,500 82.4 41,900 Any other 86.5 8,500 – – 92.2 1,300 81.0 71,500 81.8 81,300 Not known 88.5 23,200 98.1 100 85.8 2,200 78.4 406,500 79.0 432,000 Total 87.2 244,500 89.9 2,800 87.8 31,400 80.7 3,256,500 81.2 3,535,200
Table 3.4: Retention rates by institution type and Learner Support Funding
Access Residential Childcare None Total
Retention Number Retention Number Retention Number Retention Number Retention Number
FE college 86.9 209,200 86.4 400 88.4 17,700 80.2 2,579,600 80.7 2,807,000 Sixth form college 92.6 15,900 – – 88.0 500 85.8 180,500 86.4 196,900 Specialist college 89.6 6,100 90.7 2,300 85.2 3,300 70.0 49,400 73.6 61,100 External institution 84.9 13,000 – – 88.4 7,000 82.5 319,400 82.7 339,400 Specialist designated 74.7 300 – – 85.8 3,000 82.8 127,400 82.8 130,600 Dance and Drama – – – – – – 93.3 200 93.3 200 Total 87.2 244,500 89.9 2,800 87.8 31,400 80.7 3,256,500 81.2 3,535,200
Source: IES Analysis
Table 3.5: Retention rates by mode of attendance and Learner Support Funding
Access Residential Childcare None Total
Retention Number Retention Number Retention Number Retention Number Retention Number
Full-time full-year 87.6 165,300 90.6 2,600 88.0 7,200 87.6 557,200 87.6 732,400 Full-time part-year 93.0 7,500 – – 83.7 2,000 48.1 193,800 50.1 203,400 Part-time 85.8 71,600 77.3 200 88.1 22,300 81.6 2,505,400 81.8 2,599,500 Total 87.2 244,500 89.9 2,800 87.8 31,400 80.7 3,256,500 81.2 3,535,200
Source: IES Analysis
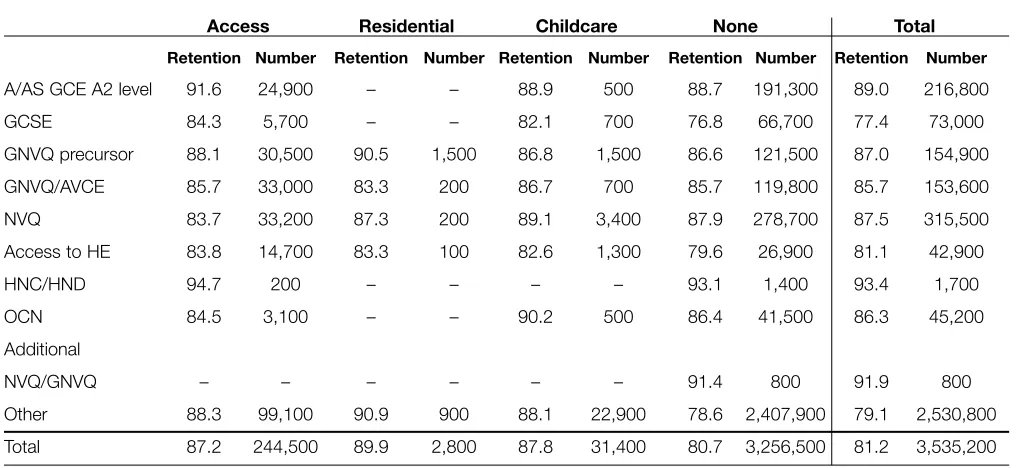
Table 3.6: Retention rates by level of qualification aim and Learner Support Funding
Access Residential Childcare None Total
Retention Number Retention Number Retention Number Retention Number Retention Number
1 & Entry 85.9 37,200 86.0 100 87.9 7,600 80.5 929,600 80.7 974,500 2 85.2 71,400 88.1 800 88.9 9,300 81.2 838,800 81.6 920,300 3 89.1 120,000 91.1 1,900 86.1 7,500 87.7 754,400 87.9 883,800 4, 5 & HE 91.5 2,800 – – 93.9 400 92.0 55,700 92.0 58,900 Other 83.8 13,100 – – 87.8 6,600 71.5 678,000 71.8 697,700 Total 87.2 244,500 89.9 2,800 87.8 31,400 80.7 3,256,500 81.2 3,535,200
Table 3.7: Retention rates by type of qualification aim and Learner Support Funding
Access Residential Childcare None Total
Retention Number Retention Number Retention Number Retention Number Retention Number
A/AS GCE A2 level 91.6 24,900 – – 88.9 500 88.7 191,300 89.0 216,800 GCSE 84.3 5,700 – – 82.1 700 76.8 66,700 77.4 73,000 GNVQ precursor 88.1 30,500 90.5 1,500 86.8 1,500 86.6 121,500 87.0 154,900 GNVQ/AVCE 85.7 33,000 83.3 200 86.7 700 85.7 119,800 85.7 153,600 NVQ 83.7 33,200 87.3 200 89.1 3,400 87.9 278,700 87.5 315,500 Access to HE 83.8 14,700 83.3 100 82.6 1,300 79.6 26,900 81.1 42,900 HNC/HND 94.7 200 – – – – 93.1 1,400 93.4 1,700 OCN 84.5 3,100 – – 90.2 500 86.4 41,500 86.3 45,200 Additional
NVQ/GNVQ – – – – – – 91.4 800 91.9 800 Other 88.3 99,100 90.9 900 88.1 22,900 78.6 2,407,900 79.1 2,530,800 Total 87.2 244,500 89.9 2,800 87.8 31,400 80.7 3,256,500 81.2 3,535,200
Source: IES Analysis
Table 3.8: Retention rates by widening participation category and Learner Support Funding
Access Residential Childcare None Total
Retention Number Retention Number Retention Number Retention Number Retention Number
Low uplift 87.3 146,000 90.1 2,500 87.8 20,100 80.7 2,482,400 81.1 2,651,000 Medium 87.0 52,500 90.2 200 87.3 6,300 80.1 476,100 80.8 535,100 High 87.3 46,000 82.9 100 88.4 5,000 81.0 297,900 81.9 349,000 Total 87.2 244,500 89.9 2,800 87.8 31,400 80.7 3,256,500 81.2 3,535,200
[image:22.595.33.543.76.310.2]Source: IES Analysis
Table 3.9: Retention rates by residential accommodation and Learner Support Funding
Access Residential Childcare None Total
Retention Number Retention Number Retention Number Retention Number Retention Number
Student living in college accom.
on campus 89.3 1,000 91.9 1,300 63.6 500 63.0 4,500 71.6 7,200 Student living in
college managed
accom. 85.1 10,800 92.9 200 86.5 200 80.9 77,300 81.4 88,400 Student not living in
college accom. 87.3 232,700 87.6 1,400 88.2 30,700 80.7 3,174,700 81.2 3,439,500 Total 87.2 244,500 89.9 2,800 87.8 31,400 80.7 3,256,500 81.2 3,535,200
Table 3.10: Retention rates by main disability and Learner Support Funding
Access Residential Childcare None Total
Retention Number Retention Number Retention Number Retention Number Retention Number
Visual impairment 89.3 900 – – – – 83.2 6,300 84.0 7,200 Hearing impairment 90.3 900 – – – – 84.4 8,500 85.0 9,500 Disability affecting
mobility 91.8 1,300 – – – – 86.0 8,900 86.7 10,300 Other physical
disabilities 86.5 1,400 – – – – 87.1 6,800 87.0 8,200 Other medical
conditions 85.4 2,900 90.5 100 84.0 100 83.9 16,800 84.1 19,900 Emotional or
behavioural difficulties 87.6 400 – – – – 87.1 2,200 87.2 2,600 Mental ill health 84.1 600 – – – – 85.7 6,000 85.5 6,600 Temporary disability
after illness 88.9 100 – – – – 84.4 700 85.0 800 Profound/complex
disability 90.0 100 – – – – 89.3 1,100 89.3 1,200 Multiple disabilities 93.7 700 – – – – 88.1 5,700 88.6 6,400 Other 88.3 3,400 – – 86.5 200 86.9 26,800 87.1 30,300 No disability 87.4 175,800 90.0 2,400 88.0 25,700 81.1 2,244,000 81.6 2,447,800 Not known/
no information 86.3 55,900 88.9 300 87.7 5,200 79.1 922,600 79.5 984,000 Total 87.2 244,500 89.9 2,800 87.8 31,400 80.7 3,256,500 81.2 3,535,200
Source: IES Analysis
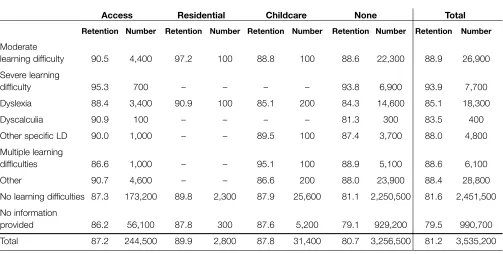
Table 3.11: Retention rates by main learning difficulty and Learner Support Funding
Access Residential Childcare None Total
Retention Number Retention Number Retention Number Retention Number Retention Number
Moderate
learning difficulty 90.5 4,400 97.2 100 88.8 100 88.6 22,300 88.9 26,900 Severe learning
difficulty 95.3 700 – – – – 93.8 6,900 93.9 7,700 Dyslexia 88.4 3,400 90.9 100 85.1 200 84.3 14,600 85.1 18,300 Dyscalculia 90.9 100 – – – – 81.3 300 83.5 400 Other specific LD 90.0 1,000 – – 89.5 100 87.4 3,700 88.0 4,800 Multiple learning
[image:23.595.58.561.469.723.2]4.
Achievement
In general, recipients of Learner Support Funding had only marginally lower rates
of achievement than those who were not in receipt of such support. This should not, however, be considered a causal relationship, as recipients of support are more likely to have other ‘risk factors’ affecting achievement than their non-funded counterparts. Consequently, we are not necessarily comparing like-with-like. Interestingly, there are variations between student groups: students living in high uplift areas who received Learner Support Funding, for example,
performed better than those who did not receive funding.
With regards to some of the other findings:
• There is a less negative association between Access Fund recipients and achievement
rates among female students than males.
• All ethnic groups in receipt of Access Funds, except Black Africans, report lower
achievement rates than their counterparts who do not receive funding. However, there are differences between ethnic groups, with Black Caribbean, Black other, Chinese, Indian and other Asians performing less negatively than Pakistani and White recipients.
• There is a mixed association between Learner Support Funding, achievement and the level
of qualification aim. Access Fund and Childcare students appear to perform better than their non-funded counterparts when they are studying for NVQ level 4 and 5 courses.
• Finally, the association between Learner Support Funding and achievement is also very much dependent upon the level of deprivation. Students living in a high uplift area had higher rates of achievement than their counterparts who were not funded.
Table 4.1: Achievement rates by sex and Learner Support Funding
Access Residential Childcare None Total
% N % N % N % N % N
Female 72.6 91,800 72.4 1,500 76.8 23,900 77.8 2,479,200 77.6 2,596,400 Male 68.2 50,300 70.2 1,500 74.3 3,500 75.0 1,682,000 74.8 1,737,400 Total 71.1 142,200 71.3 3,000 76.5 27,400 76.7 4,161,200 76.5 4,333,800
Source: IES Analysis
Table 4.2: Achievement rates by age and Learner Support Funding
Access Residential Childcare None Total
Achievement Number Achievement Number Achievement Number Achievement Number Achievement Number
16 to 18 yrs 68.1 74,600 72.7 2,100 72.5 2,900 73.2 1,360,600 73.0 1,440,200 19 to 24 yrs 70.1 20,600 68.6 700 75.6 6,200 74.8 408,900 74.6 436,400 25 yrs or more 76.2 47,000 66.3 200 77.4 18,200 78.9 2,391,800 78.9 2,457,200 Total 71.1 142,200 71.3 3,000 76.5 27,400 78.9 4,161,200 76.5 4,333,800
Table 4.3: Achievement rates by ethnicity and Learner Support Funding
Access Residential Childcare None Total
Achievement Number Achievement Number Achievement Number Achievement Number Achievement Number
Bangladeshi 68.1 1,700 – – 63.0 300 69.9 30,100 69.7 32,200 Black African 66.3 6,400 – – 66.2 1,100 63.8 83,400 64.0 90,900 Black Caribbean 64.0 4,500 – – 63.1 800 64.9 59,700 64.8 65,000 Black Other 66.0 3,000 – – 72.3 500 65.2 30,100 65.4 33,600 Chinese 71.7 800 – – 74.6 100 72.2 23,700 72.2 24,600 Indian 71.8 4,900 – – 75.8 600 72.2 102,100 72.2 107,700 Pakistani 67.6 7,000 – – 75.9 1,200 71.6 90,200 71.3 98,400 White 72.7 90,100 72.0 2,800 78.5 18,700 78.0 3,078,700 77.9 3,190,300 Other — Asian 69.8 2,300 – – 74.4 500 70.8 53,400 70.8 56,200 Any other 69.5 4,600 – – 73.5 1,200 70.3 97,000 70.3 102,800 Not reported 69.2 17,000 59.5 100 74.9 2,300 76.8 512,700 76.5 532,100 Total 71.1 142,200 71.3 3,000 76.5 27,400 76.7 4,161,200 76.5 4,333,800
Source: IES Analysis
Table 4.4: Achievement rates by college type and Learner Support Funding
Access Residential Childcare None Total
Achievement Number Achievement Number Achievement Number Achievement Number Achievement Number
FE college 69.2 116,900 73.1 300 76.7 17,100 76.3 3,103,400 76.1 3,237,800 Sixth form
college 82.9 14,800 – – 86.5 400 84.5 480,900 84.4 496,100 Specialist
college 72.0 3,800 71.1 2,600 69.7 1,900 78.1 64,100 77.3 72,400 External
institution 77.5 6,500 – – 81.8 5,700 76.0 322,300 76.1 334,600 Specialist
designated 93.9 100 64.7 2,200 62.8 190,500 62.8 192,900 Total 71.1 142,200 71.3 3,000 76.5 27,400 76.7 4,161,200 76.5 4,333,800
[image:25.595.57.565.77.311.2]Source: IES Analysis
Table 4.5: Achievement rates by mode of attendance and Learner Support Funding
Access Residential Childcare None Total
Achievement Number Achievement Number Achievement Number Achievement Number Achievement Number
Full-time
full-year 69.8 112,100 71.1 2,900 71.7 9,200 73.3 1,469,700 73.1 1,593,900 Full-time
Table 4.6: Achievement rates by level of qualification aim and Learner Support Funding
Access Residential Childcare None Total
Achievement Number Achievement Number Achievement Number Achievement Number Achievement Number
1 & Entry 66.8 41,000 72.0 800 71.4 9,200 74.1 1,186,600 73.8 1,237,600 2 67.3 45,300 69.5 1,200 76.6 7,300 73.1 987,100 72.9 1,040,900 3 76.3 40,200 76.8 800 77.2 3,400 78.4 952,800 78.3 997,200 4, 5 & HE 72.1 500 – – 76.6 100 64.6 32,500 64.8 33,100 Other 79.9 15,200 58.0 200 82.4 7,300 81.9 1,002,200 81.9 1,024,900 Total 71.1 142,200 71.3 3,000 76.5 27,400 76.7 4,161,200 76.5 4,333,800
[image:26.595.35.540.257.497.2]Source: IES Analysis
Table 4.7: Achievement rates by category of qualification aim and Learner Support Funding
Access Residential Childcare None Total
Achievement Number Achievement Number Achievement Number Achievement Number Achievement Number
A/AS GCE
A2 level 76.4 19,500 64.8 100 73.5 500 82.4 510,600 82.1 530,700 GCSE 79.2 6,600 – – 81.1 700 81.2 118,900 81.1 126,300 GNVQ precursor 88.2 4,200 91.1 400 88.4 300 82.5 61,100 82.9 66,000 GNVQ/AVCE 78.5 5,800 85.2 100 74.7 200 77.8 72,800 77.8 78,900 NVQ 80.6 6,800 84.9 100 77.4 1,200 75.7 147,800 76.0 155,900 Access to HE 88.0 2,800 – – 86.2 500 83.7 17,000 84.4 20,300 HNC/HND – – – – – – 78.5 300 77.9 300 OCN 77.1 1,800 – – 73.9 400 80.6 46,600 80.4 48,800 Additional
NVQ/GNVQ 61.3 2,000 55.0 100 66.5 200 65.2 31,600 65.0 33,800 Other 67.0 92,600 67.7 2,300 76.1 23,500 75.5 3,154,300 75.2 3,272,700 Total 71.1 142,200 71.3 3,000 76.5 27,400 76.7 4,161,200 76.5 4,333,800
Source: IES Analysis
Table 4.8: Achievement rates by widening participation uplift and Learner Support Funding
Access Residential Childcare None Total
Achievement Number Achievement Number Achievement Number Achievement Number Achievement Number
Low uplift 71.7 86,100 71.2 2,700 77.9 17,200 78.2 3,205,900 78.0 3,312,000 Medium uplift 70.6 30,100 72.8 200 74.5 5,500 73.4 585,100 73.2 621,000 High uplift 69.4 25,900 – – 73.4 4,600 68.6 370,200 68.7 400,800 Total 71.1 142,200 71.3 3,000 76.5 27,400 76.7 4,161,200 76.5 4,333,800
Table 4.9: Achievement rates by residential status and Learner Support Funding
Access Residential Childcare None Total
Achievement Number Achievement Number Achievement Number Achievement Number Achievement Number
Student living in college accom. on
campus 77.0 800 79.2 1,500 71.6 500 83.1 9,300 81.7 12,200 Student living in
college managed
accom. 79.3 2,700 85.5 100 86.0 100 79.2 75,600 79.2 78,600 Student not living
in college accom. 70.9 138,700 60.9 1,300 76.5 26,700 76.6 4,076,300 76.4 4,243,100 Total 71.1 142,200 71.3 3,000 76.5 27,400 76.7 4,161,200 76.5 4,333,800
Source: IES Analysis
Table 4.10: Achievement rates by disability and Learner Support Funding
Access Residential Childcare None Total
Achievement Number Achievement Number Achievement Number Achievement Number Achievement Number
Visual
impairment 71.7 600 – – – – 76.9 10,200 76.6 10,800 Hearing
impairment 72.3 600 – – – – 76.7 12,600 76.5 13,300 Disability
affecting
mobility 68.5 700 – – 84.6 100 79.2 12,200 78.6 12,900 Other physical
disability 71.7 700 – – – – 78.9 9,300 78.4 10,000 Other medical
condition 70.6 1,900 59.3 100 69.8 100 76.5 31,100 76.1 33,200 Emotional/
behavioural
difficulties 82.6 200 – – – – 81.0 3,700 81.1 4,000 Mental ill health 75.1 300 – – – – 78.7 8,300 78.5 8,600 Temporary
disability after
illness – – – – – – 76.0 1,200 75.8 1,200 Profound/
complex
disabilities – – – – – – 82.3 1,800 82.3 1,800 Multiple
Table 4.11: Achievement rates by learning difficulties and Learner Support Funding
Access Residential Childcare None Total
Achievement Number Achievement Number Achievement Number Achievement Number Achievement Number
Moderate learning
difficulties 71.2 2,500 80.2 100 69.8 100 76.9 40,600 76.5 43,400 Severe learning
difficulties 88.2 500 – – – – 82.5 10,200 82.7 10,700 Dyslexia 67.7 2,400 70.5 200 69.3 200 72.2 29,800 71.9 32,500 Dyscalculia 78.2 100 – – – – 74.5 500 75.1 600 Other specific
learning difficulties 64.9 900 – – 70.7 100 72.0 8,600 71.4 9,500 Multiple learning
difficulties 62.6 600 – – – – 77.4 7,700 76.4 8,300 Other 70.5 2,800 80.7 100 69.8 200 74.5 41,000 74.2 44,100 No learning
difficulties 71.3 102,500 70.8 2,400 76.5 22,200 77.0 2,929,800 76.8 3,057,000 Not known 70.7 30,000 68.7 200 77.5 4,400 76.0 1,093,000 75.8 1,127,600 Total 71.1 142,200 71.3 3,000 76.5 27,400 76.7 4,161,200 76.5 4,333,800
Appendix 1: Additional Tables
This section presents additional tables covering:
• Estimated studentnumbers receiving Learner Support Funding, by individual
course and college characteristics (Section A1).
• Estimated proportionsof students receiving Learner Support Funding, by
individual course or college characteristics and age bands (16 to 18 years, 19 to 24 years and 25 years or over) (Section A2).
• Estimated numbersof students receiving Learner Support Funding, by
individual course or college characteristics and age bands (16 to 18 years, 19 to 24 years and 25 years or over) (Section A3).
[image:29.595.110.510.423.641.2]A1Learner support (headline numbers)
Table A1: Learner Support Funding by sex
Access Residential Childcare None Total
Female 155,500 1,400 26,000 1,933,300 2,116,000 Male 89,000 1,400 5,400 1,323,200 1,419,100 Total 244,500 2,800 31,400 3,256,500 3,535,200
Source: IES Analysis
Table A2: Learner Support Funding by ethnicity
Access Residential Childcare None Total
Bangladeshi 2,500 – 400 20,000 22,600 Black African 11,500 – 1,300 57,000 69,800 Black Caribbean 8,600 – 900 50,000 59,400 Black Other 5,100 – 500 22,000 27,600 Chinese 1,300 – 200 15,400 16,800 Indian 6,100 – 700 65,600 72,500 Pakistani 10,000 – 1,300 60,000 71,200 White 164,000 2,600 22,200 2,451,400 2,640,200 Other — Asian 3,900 – 500 37,500 42,000 Any other 8,500 – 1,300 71,500 81,300 Not known 23,200 100 2,200 406,500 432,000 Total 244,500 2,800 31,400 3,256,500 3,535,200\
Table A3: Learner Support Funding by institution type
Access Residential Childcare None Total
FE college 209,200 400 17,700 2,579,600 2,807,000 Sixth form college 15,900 – 500 180,500 196,900 Specialist college 6,100 2,300 3,300 49,400 61,100 External institution 13,000 – 7,000 319,400 339,400 Specialist designated 300 – 3,000 127,400 130,600 Dance/drama – – – 200 200 Total 244,500 2,800 31,400 3,256,500 3,535,200
Source: IES Analysis
Table A4: Learner Support Funding by mode of attendance
Access Residential Childcare None Total
Full-time full-year 165,300 2,600 7,200 557,200 732,400 Full-time part-year 7,500 – 2,000 193,800 203,400 Part-time 71,600 200 22,300 2,505,400 2,599,500 Total 244,500 2,800 31,400 3,256,500 3,535,200
Source: IES Analysis
Table A5: Learner Support Funding by NVQ level of qualification aim
Access Residential Childcare None Total
1 & Entry 37,200 100 7,600 929,600 974,500 2 71,400 800 9,300 838,800 920,300 3 120,000 1,900 7,500 754,400 883,800 4, 5 & HE 2,800 – 400 56,000 58,900 Other 13,100 – 6,600 678,000 697,700 Total 244,500 2,800 31,400 3,256,500 3,535,200
Table A6: Learner Support Funding by type of qualification aim
Access Residential Childcare None Total
A/AS GCE A2 level 24,900 – 500 191,300 216,800 GCSE 5,700 – 700 66,700 73,000 GNVQ precursor 30,500 1,500 1,500 121,500 154,900 GNVQ/AVCE 33,000 200 700 119,800 153,600 NVQ 33,200 200 3,400 278,700 315,500 Access to HE 14,700 100 1,300 26,900 42,900 HNC/HND 200 – – 1,400 1,700 OCN 3,200 – 500 41,500 45,200 Additional NVQ/GNVQ – – – 800 800 Other 99,100 900 22,900 2,407,900 2,530,800 Total 244,500 2,800 31,400 3,256,500 3,535,200
Source: IES Analysis
Table A7: Learner Support Funding by widening participation factor
Access Residential Childcare None Total
Low uplift 146,000 2,500 20,100 2,482,400 2,651,000 Medium 52,500 200 6,300 476,100 535,100 High 46,000 100 5,000 297,900 349,000 Total 244,500 2,800 31,400 3,256,500 3,535,200
[image:31.595.109.510.77.279.2]Source: IES Analysis
Table A8: Learner Support Funding by residential status
Access Residential Childcare None Total
Student living in college
accom. on campus 1,000 1,300 500 4,500 7,200 Student living in college
managed accom. 10,800 200 200 77,300 88,500 Student not living in
college accom. 232,700 1,400 30,700 3,174,700 3,439,500 Total 244,500 2,800 31,400 3,256,500 3,535,200
Table A9: Learner Support Funding by type of disability
Access Residential Childcare None Total
Visual impairment 900 – – 6,300 7,200 Hearing impairment 900 – – 8,500 9,500 Disability affecting mobility 1,300 – – 8,900 10,300 Other physical disabilities 1,400 – – 6,800 8,200 Other medical conditions 2,900 100 100 16,800 20,000 Emotional or behavioural
difficulties 400 – – 2,200 2,600 Mental ill health 600 – – 6,000 6,600 Temporary disability after illness 100 – – 700 800 Profound/complex disability 100 – – 1,100 1,200 Multiple disabilities 700 – – 5,700 6,400 Other 3,400 – 200 26,800 30,300 No disability 175,800 2,400 25,700 2,244,000 2,447,900 Not known/no information 55,900 300 5,200 922,600 984,000 Total 244,500 2,800 31,400 3,256,500 3,535,200
Source: IES Analysis
Table A10: Learner Support Funding by type of learning difficulty
Access Residential Childcare None Total
Moderate learning difficulty 4,400 100 100 22,300 26,900 Severe learning difficulty 700 – – 6,900 7,700 Dyslexia 3,400 100 200 14,600 18,300 Dyscalculia 100 – – 300 400 Other specific LD 1,000 – 100 3,700 4,800 Multiple learning difficulties 1,000 – 100 5,100 6,100 Other 4,600 – 200 23,900 28,800 No learning difficulties 173,200 2,300 25,600 2,250,500 2,451,500 No information provided 56,100 300 5,200 929,200 990,700 Total 244,500 2,800 31,400 3,256,500 3,535,200
[image:32.595.136.535.77.342.2]Source: IES Analysis
Table A11: Learner Support Funding by retention status
Access Residential Childcare None Total
Withdrawn 31,200 300 3,800 630,000 665,300 Retained 213,200 2,500 27,600 2,626,500 2,869,900 Total 244,500 2,800 31,400 3,256,500 3,535,200
oup (per cent) Access Residential Childcar e None T otal 16 19 25 16 19 25 16 19 25 16 19 25 16 19 25 to 18 to 24 plus to 18 to 24 plus to 18 to 24 plus to 18 to 24 plus to 18 to 24 plus 82.3 92.5 86.1 13.0 18.8 27.1 52.1 65.0 54.3 76.9 87.2 78.5 77.4 87.2 78.6 13.4 1 .8 1.4 0 .1 – 4 .2 1.7 1 .3 1.6 19.1 2 .6 2.8 18.1 2 .5 2.7 3.7 2 .6 1.3 86.9 80.5 59.7 38.3 6 .1 8.0 1 .9 1.7 1 .4 2.6 1 .9 1.5 0 .6 3.0 11.0 – 0.8 9 .0 5.0 18.6 25.7 1 .8 6.8 12.2 1 .6 6.6 12.3 – 0 .1 0.2 – – – 2.9 9 .0 10.4 0 .2 1.7 5 .2 0.2 1 .7 5.0 – – – – – – – – – – – – – – – 100.0 100.0 100.0 100.0 100.0 100.0 100.0 100.0 100.0 100.0 100.0 100.0 100.0 100.0 100.0
oup (per cent)
[image:33.595.100.466.80.794.2]T
able A14: Lear
ner Support Funding by qualification type and age gr
oup (per cent)
Access Residential Childcar e None T otal 16 19 25 16 19 25 16 19 25 16 19 25 16 19 25 to 18 to 24 plus to 18 to 24 plus to 18 to 24 plus to 18 to 24 plus to 18 to 24 plus
A/AS GCE A2 level
19.7 7 .0 1.8 1 .0 0.9 – 3.8 2 .6 1.0 26.2 4 .4 1.2 25.0 4 .6 1.3 GCSE 2.6 2 .2 2.0 0 .1 0.6 – 1.7 2 .9 2.0 2 .9 2.8 1 .7 2.8 2 .8 1.7 GNVQ pr ecursor 18.2 15.1 5 .6 58.1 45.2 38.6 21.8 5 .1 2.2 13.9 5 .5 1.0 14.7 6 .5 1.2 GNVQ/A VCE 25.6 11.7 2 .0 7.8 5 .1 4.2 9 .2 3.8 0 .7 19.2 2 .6 0.1 20.1 3 .5 0.2 NVQ 11.6 14.0 15.4 4 .5 9.8 6 .1 9.6 12.4 10.4 9 .7 11.7 7 .8 10.0 11.9 8 .1
Access to HE
0.1 9 .4 10.6 0 .2 5.1 4 .2 – 5 .2 4.3 0 .1 1.7 0 .9 0.1 2 .5 1.3 HNC/HND 0.0 0 .2 0.1 0 .2 – – – 0 .0 0.0 0 .0 0.1 0 .0 0.0 0 .1 0.0 OCN 0.4 1 .4 2.2 – – – 0.2 1 .3 1.9 0 .5 1.7 1 .4 0.5 1 .6 1.4 Additional NVQ/GNVQ 0.0 0 .0 0.0 – – – – – 0.0 0 .0 0.0 0 .0 0.0 0 .0 0.0 Other 21.8 39.0 60.2 28.1 33.1 46.9 53.7 66.7 77.5 27.6 69.4 85.8 26.9 66.4 84.7 To tal 100.0 100.0 100.0 100.0 100.0 100.0 100.0 100.0 100.0 100.0 100.0 100.0 100.0 100.0 100.0
Source: IES Analysis Table A15: Lear
ner Support Funding by r
esidential status and age gr
oup (per cent)
Access Residential Childcar e None T otal 16 19 25 16 19 25 16 19 25 16 19 25 16 19 25 to 18 to 24 plus to 18 to 24 plus to 18 to 24 plus to 18 to 24 plus to 18 to 24 plus
Student living in college accom. on campus
0.7 0 .3 0.2 57.7 23.3 12.3 7 .8 1.2 0 .8 0.4 0 .2 0.1 0 .6 0.2 0 .1
Student living in college managed accom.
5 .2 4.0 3 .8 4.3 11.5 6 .8 0.7 1 .3 0.6 2 .4 2.3 2 .4 2.9 2 .5 2.4
Student not living in college accom.
94.1 95.7 96.1 37.9 65.3 81.0 91.5 97.5 98.6 97.2 97.5 97.6 96.5 97.3 97.5 To tal 100.0 100.0 100.0 100.0 100.0 100.0 100.0 100.0 100.0 100.0 100.0 100.0 100.0 100.0 100.0
[image:34.595.97.518.89.796.2]T
able A17: Lear
ner Support Funding by lear
ning dif
ficulties and age gr
oup (per cent)
Access Residential Childcar e None T otal 16 19 25 16 19 25 16 19 25 16 19 25 16 19 25 to 18 to 24 plus to 18 to 24 plus to 18 to 24 plus to 18 to 24 plus to 18 to 24 plus Moderate lear ning dif ficulty 1.9 2 .1 1.6 2 .4 2.9 4 .2 0.7 0 .3 0.4 1 .1 0.8 0 .6 1.2 0 .9 0.6 Sever e lear ning dif ficulty 0.2 0 .7 0.2 0 .1 0.3 – – 0 .0 0.1 0 .3 0.2 0 .1 0.4 0 .2 Dyslexia 1 .7 1.5 1 .1 5.9 3 .5 1.9 1 .2 0.8 0 .4 1.1 0 .6 0.3 1 .2 0.7 0 .3 Dyscalculia 0.0 0 .0 0.0 – – – – 0 .0 – 0 .0 0.0 0 .0 0.0 0 .0 0.0
Other specific LD
0.5 0 .3 0.3 0 .2 – – 0.1 0 .3 0.2 0 .3 0.1 0 .1 0.3 0 .2 0.1 Multiple lear ning dif ficulties 0 .4 0.4 0 .4 – 0 .3 0.6 0 .1 0.1 0 .3 0.2 0 .2 0.1 0 .2 0.2 0 .2 Other 1.6 2 .2 2.1 2 .2 0.9 – 0.8 0 .7 0.6 1 .0 0.8 0 .7 1.1 0 .9 0.7 No lear ning dif ficulties 73.0 71.2 68.5 81.2 80.6 76.1 88.4 81.5 80.6 72.4 68.8 68.4 72.6 69.3 68.5
No information pr
ovided 20.8 21.5 25.7 8 .0 11.5 17.1 8 .7 16.1 17.5 23.8 28.3 29.7 23.2 27.4 29.4 To tal 100.0 100.0 100.0 100.0 100.0 100.0 100.0 100.0 100.0 100.0 100.0 100.0 100.0 100.0 100.0
Source: IES Analysis Table A18: Lear
ner Support Funding by r
e
tention status and age gr
oup (per cent)
Access Residential Childcar e None T otal 16 19 25 16 19 25 16 19 25 16 19 25 16 19 25 to 18 to 24 plus to 18 to 24 plus to 18 to 24 plus to 18 to 24 plus to 18 to 24 plus W ithdrawn 12.3 15.2 12.3 9 .7 9.5 13.6 12.3 13.5 11.8 14.3 22.2 20.1 13.9 21.4 19.7 Retained 87.7 84.8 87.7 90.3 90.5 86.4 87.7 86.5 88.2 85.7 77.8 79.9 86.1 78.6 80.3 To tal 100.0 100.0 100.0 100.0 100.0 100.0 100.0 100.0 100.0 100.0 100.0 100.0 100.0 100.0 100.0
[image:36.595.97.317.74.796.2] [image:36.595.375.475.102.793.2]T
able A21: Lear
ner Support Funding by institution type and age gr
oup Access Residential Childcar e None T otal 16 19 25 16 19 25 16 19 25 16 19 25 16 19 25 to 18 to 24 plus to 18 to 24 plus to 18 to 24 plus to 18 to 24 plus to 18 to 24 plus FE college 84,300 38,000 86,900 200 – 100 1,500 4,400 11,900 428,300 332,400 1,819,000 514,400 374,800 1,917,800
Sixth form college
13,800 800 1,400 – – – – 100 300 107,000 10,000 63,800 120,000 10,800 65,600 Specialist college 3,800 1,100 1,300 1,600 500 200 1,100 400 1,700 10,600 6,400 32,400 17,000 8,400 35,600 Exter nal institution 700 1,200 11,100 – – – 100 1,300 5,600 10,100 25,900 283,400 11,000 28,400 300,100 Specialist designated – – 300 – – – – 600 2,300 1,200 6,700 119,400 1,300 7,300 122,000 Dance/drama – – – – – – – – – 100 – – 100 – – To tal 102,500 41,100 100,900 1,800 700 300 2,900 6,700 21,900 557,100 381,300 2,318,000 664,400 429,800 2,441,000
Source: IES Analysis Table A22: Lear
ner Support Funding by mode of attendance and age gr
oup Access Residential Childcar e None T otal 16 19 25 16 19 25 16 19 25 16 19 25 16 19 25 to 18 to 24 plus to 18 to 24 plus to 18 to 24 plus to 18 to 24 plus to 18 to 24 plus Full-time full-year 95,300 27,900 42,200 1,800 600 200 1,500 2,000 3,700 412,300 60,000 84,900 510,900 90,500 131,000 Full-time part-year 800 1,600 5,100 – – – 200 600 1,200 14,200 31,600 148,000 15,200 33,800 154,300 Part-time 6,400 11,600 53,600 – – 100 1,200 4,100 17,000 130,600 289,700 2,085,100 138,300 305,500 2,155,700 To tal 102,500 41,100 100,900 1,800 700 300 2,900 6,700 21,800 557,100 381,300 2,318,000 664,400 429,800 2,441,000
[image:38.595.95.426.83.799.2]T
able A25: Lear
ner Support Funding by widening participation uplift and age gr
oup Access Residential Childcar e None T otal 16 19 25 16 19 25 16 19 25 16 19 25 16 19 25 to 18 to 24 plus to 18 to 24 plus to 18 to 24 plus to 18 to 24 plus to 18 to 24 plus Low uplift 63,200 23,500 59,400 1,700 600 300 2,300 4,100 13,700 422,300 265,900 1,794,200 489,500 294,000 1,867,500 Medium 23,400 8,900 20,200 100 – – 400 1,500 4,500 83,100 67,000 326,100 106,900 77,400 350,800 High 16,000 8,700 21,300 – – – 200 1,200 3,700 51,800 48,500 197,700 68,000 58,400 222,700 To tal 102,500 41,100 100,900 1,800 700 300 2,900 6,700 21,800 557,100 381,300 2,318,000 664,400 429,800 2,441,000
Source: IES Analysis Table A26: Lear
ner Support Funding by widening participation uplift and age gr
oup Access Residential Childcar e None T otal 16 19 25 16 19 25 16 19 25 16 19 25 16 19 25 to 18 to 24 plus to 18 to 24 plus to 18 to 24 plus to 18 to 24 plus to 18 to 24 plus
Student living in college accom. on campus
700 100 200 1,100 200 – 200 100 200 2,000 600 1,900 4,000 1,000 2,200
Student living in college managed accom.
5,300 1,600 3,800 100 100 – – 100 100 13,600 8,900 54,800 19,100 10,700 58,700
Student not living in college accom.
96,500 39,300 96,900 700 400 300 2,600 6,500 21,500 541,500 371,900 2,261,300 641,300 418,200 2,380,100 To tal 102,500 41,100 100,900 1,800 700 300 2,900 6,700 21,800 557,100 381,300 2,318,000 664,400 429,800 2,441,000
[image:40.595.94.416.66.799.2]T
able A28: Lear
ner Support Funding by lear
ning dif
ficulty and age gr
oup Access Residential Childcar e None T otal 16 19 25 16 19 25 16 19 25 16 19 25 16 19 25 to 18 to 24 plus to 18 to 24 plus to 18 to 24 plus to 18 to 24 plus to 18 to 24 plus Moderate lear ning dif ficulty 1,900 800 1,600 – – – – – 100 6,300 3,200 12,900 8,300 4,000 14,600 Sever e lear ning dif ficulty 200 300 200 – – – – – – 600 1,200 5,100 800 1,500 5,400 Dyslexia 1,700 600 1,100 100 – – – 100 100 6,400 2,300 5,900 8,200 3,000 7,100 Dyscalculia – – – – – – – – – 100 – 100 100 100 200
Other specific LD
500 100 400 – – – – – – 1,400 500 1,800 2,000 700 2,200 Multiple lear ning dif ficulties 400 200 400 – – – – – 100 1,000 800 3,200 1,400 1,000 3,700 Other 1,600 900 2,100 – – – – – 100 5,600 2,900 15,400 7,300 3,800 17,600 No lear ning dif ficulties 74,800 29,200 69,100 1,500 500 200 2,500 5,500 17,600 403,400 262,500 1,584,600 482,300 297,700 1,671,500
No information pr
ovided 21,300 8,900 25,900 100 100 100 300 1,100 3,800 132,300 107,900 689,000 154,000 117,900 718,800 To tal 102,500 41,100 100,900 1,800 700 300 2,900 6,700 21,800 557,100 381,300 2,318,000 664,400 429,800 2,441,000
[image:42.595.96.328.87.798.2]Sherwood Annesley Nottingham NG15 0DJ
Tel: 0845 60 222 60 Fax: 0845 60 333 60 Minicom: 0845 60 555 60 © Crown copyright 2003
Produced by the Department for Education and Skills ISBN: 1 84185 976 3
Ref No: EVSTAT