Let’s Stay Put
Literacy and Numeracy Pilot
31 March 2010 - Progress Report
Angela Hill
Leanne Dalley-Trim
Andrea Lynch
Contents
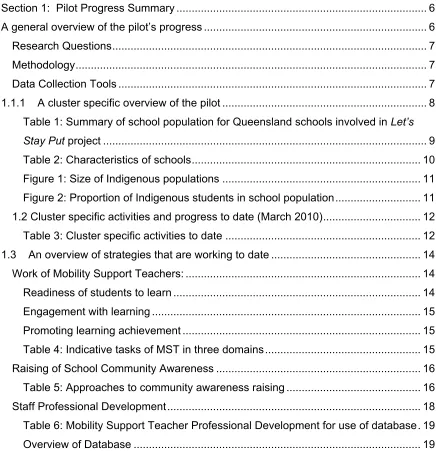
Section 1: Pilot Progress Summary ... 6
!
A general overview of the pilot’s progress ... 6
!
Research Questions... 7
!
Methodology... 7
!
Data Collection Tools ... 7
!
[image:2.595.89.525.110.561.2]1.1.1
!
A cluster specific overview of the pilot ... 8!
Table 1: Summary of school population for Queensland schools involved in Let’s Stay Put project ... 9
!
Table 2: Characteristics of schools... 10
!
Figure 1: Size of Indigenous populations ... 11
!
Figure 2: Proportion of Indigenous students in school population... 11
!
1.2 Cluster specific activities and progress to date (March 2010)... 12
!
Table 3: Cluster specific activities to date ... 12
!
1.3
!
An overview of strategies that are working to date ... 14!
Work of Mobility Support Teachers: ... 14
!
Readiness of students to learn ... 14
!
Engagement with learning ... 15
!
Promoting learning achievement ... 15
!
Table 4: Indicative tasks of MST in three domains... 15
!
Raising of School Community Awareness ... 16
!
Table 5: Approaches to community awareness raising ... 16
!
Staff Professional Development... 18
!
Table 6: Mobility Support Teacher Professional Development for use of database. 19
!
Overview of Database ... 19!
1.4 Information on the next steps to deliver the pilot ... 21
!
Action Research Meetings ... 21
!
Table 7: Schedule of planned Action Research meetings for 2010... 21
!
Surveys ... 21
!
Interviews ... 21
!
MST Database ... 22
!
Professional Development of teachers ... 22
!
Community engagement ... 22
!
Section 2: Framework Data ... 23
!
2.1.1
!
Outline the student baseline data collected in 2009, as agreed in your EvidenceFramework... 23
!
Quantitative data: Students... 23
!
Measuring and Mapping Mobility ... 23
!
Table 8: Mobility indices for schools – 2008 and 2009... 24
!
Quantitative data: Literacy and numeracy performance ... 24
!
Example 1: Mobility within NAPLAN testing periods ... 25
!
Example 2: Traceability of students undertaking NAPLAN in each school site... 25
!
Figure 3: The interaction between mobility and NAPLAN results in the Cairns cluster ... 26
!
Overall NAPLAN results... 27
!
Figure 4: 2008 and 2009 NAPLAN Results - Year 3 Reading... 27
!
Figure 5: 2008 and 2009 NAPLAN Results - Year 5 Reading... 27
!
Figure 6: 2008 and 2009 NAPLAN Results - Year 7 Reading... 28
!
Figure 7: 2008 and 2009 NAPLAN Results - Year 3 Writing ... 28
!
Figure 8: 2008 and 2009 NAPLAN Results - Year 5 Writing ... 29
!
Figure 9: 2008 and 2009 NAPLAN Results - Year 7 Writing ... 29
!
Figure 10: 2008 and 2009 NAPLAN Results - Year 3 Numeracy... 30
!
Figure 11: 2008 and 2009 NAPLAN Results - Year 5 Numeracy... 30
!
Figure 12: 2008 and 2009 NAPLAN Results - Year 7 Numeracy... 31
!
NAPLAN Results of Mobile students... 31
!
Figure 13: Cairns cluster 2009 NAPLAN Reading results for mobile and non-mobile students ... 31
!
Figure 14: Cairns cluster 2009 NAPLAN writing results for mobile and non-mobile students ... 32
!
Figure 15: Cairns cluster 2009 NAPLAN Numeracy results for mobile and non-mobile students ... 32
!
Quantitative data: Literacy and numeracy proficiency ... 32
!
Table 9: Range and frequency of main literacy diagnostic instruments ... 33
!
Table 10: Range and frequency of numeracy tests... 34
!
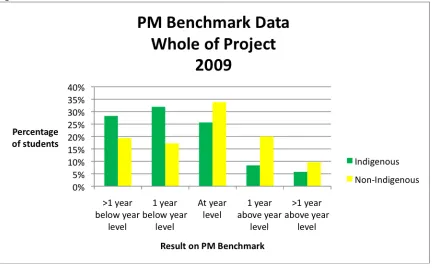
Figure 16: PM Benchmark results for mobile students across the cluster... 35
!
Qualitative data: Students ... 36
!
Mobility Support Teacher Database... 36
!
Qualitative data: student engagement/participation ... 36
!
Case Study 1: Cairns cluster ... 37
!
Case Study 2: Logan cluster ... 38
!
Case Study 4: Riverway cluster... 40
!
2.1.3
!
Provide information on any emerging issues or actions taken in response to the data analysis collected to date... 41!
2.2
!
Framework Data – Teachers ... 41!
2.2.1 Provide information on data collected in 2009, as agreed in your Evidence Framework... 41
!
Quantitative Data: Teachers ... 41
!
Quantitative data: Teacher Capacity – improvement over time ... 41
!
Table 11: Cairns cluster: Teacher survey quantitative data ... 43
!
Table 12: Central Queensland cluster: Teacher survey quantitative data... 46
!
Table 13: Logan cluster: Teacher survey quantitative data... 48
!
Table 14: Riverway cluster: Teacher survey quantitative data ... 51
!
2.2.2 Provide your analysis of the data collected in 2009... 60
!
2.2.3
!
Provide information on any emerging issues or actions taken in response to the data analysis collected to date... 60!
2.3
!
Framework Data – School Leaders ... 60!
2.3.1
!
Provide information on data collected in 2009, as agreed in your Evidence Framework... 60!
Quantitative data: School leadership qualities ... 60
!
Qualitative data: School leadership qualities ... 61
!
2.3.2 Provide your analysis of the data collected in 2009... 62
!
2.3.3 Provide information on any emerging issues or actions taken in response to the data analysis collected to date... 62
!
2.4
!
Framework Data – Parents/Community... 63!
2.4.1
!
Provide information on data collected in Terms 1 and 2, as agreed in your Evidence Framework ... 63!
Quantitative data: Parent and community engagement and support of the school... 63
!
Reasons for movement ... 64
!
Figure 17: Cairns cluster - reasons for mobility ... 64
!
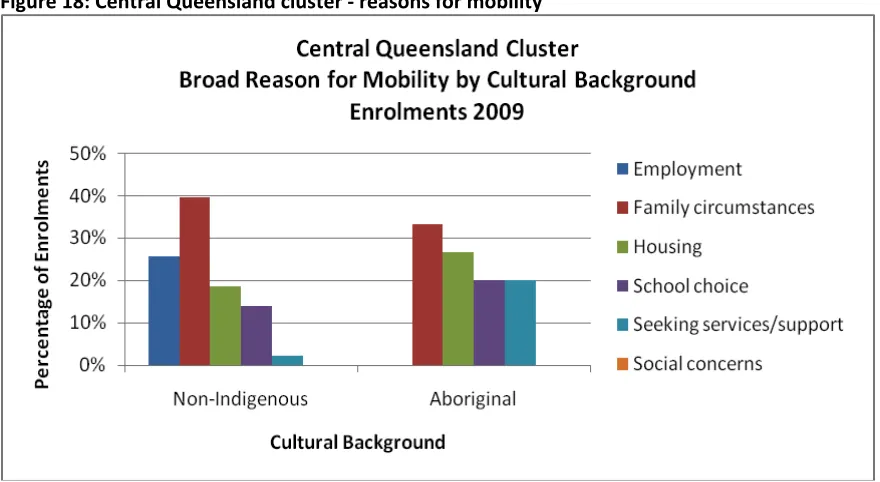
Figure 18: Central Queensland cluster - reasons for mobility ... 64
!
Figure 19: Riverway cluster - reasons for mobility... 65
!
Figure 20: Logan cluster - reasons for mobility ... 65
!
Qualitative data: Parent and community engagement and support of the school... 66
!
Table 16: Weir State School engagement activities ... 66
!
Table 17: Rasmussen State School engagement activities ... 67
!
!
"#$%&'(!)*!!+&,'%!+-'.-#//!"0112-3!
4!.#(#-2,!'5#-5!'7!%8#!9&,'%:/!9-'.-#//!
A range of Indigenous population dynamics play out underneath the demographic picture that can be constructed from official statistics. Primary among these are temporary mobility practices. Although temporary movements are largely ‘uncaptured’ by conventional statistical measures, they are pervasive in public life and thought. (Prout, 2008; p i)
The ‘Let’s Stay Put for Literacy and Numeracy Learning’ two year pilot aims to trial a ‘systematic response’ (Prout, 2008) to the reality of Indigenous temporary mobility practices across a range of Queensland school sites.
The ‘Let’s Stay Put for Literacy and Numeracy Learning’ project has a two pronged approach:
1. The professional development of teachers to understand student needs and intervention strategies – as they pertain to mobile students, mobile Indigenous students.
2. The case management of individual students – that is, mobile students, and in particular mobile Indigenous students.
The aims of the ‘Let’s Stay Put for Literacy and Numeracy Learning’ project will build an understanding of student mobility and its impact on learning, particularly in literacy and numeracy, through:
• Developing innovative student centred approaches and interventions to address
issues of mobility.
• Lifting teacher capacity by building professional development networks and
resources.
• Implementing whole-of-school strategies that can be used and applied across the
school/s.
• Building the evidence-base on mobility and its impact on student learning.
Long-term objectives are to:
• Increase teacher, school and system knowledge and skills of the needs of mobile
students.
• Reduce rates of student mobility.
;#/#2-$8!<0#/%&'(/!
The research questions framing the ‘Let’s Stay Put for Literacy and Numeracy Learning’
project focus upon a two-pronged approach:
1. The professional development of teachers to build capacity to respond to the needs of mobile students.
2. To manage students’ needs via an individualised approach.
=#%8'>','.3!
The research aspect of the project is being conducted within a collaborative action
research framework. This method sees the JCU researchers consistently liaise and work in close collaboration with school staff and other key stakeholders. In doing so, the Action Research Teams work within the framework of the following sequence for planning inquiry in action:
1. Form an action group(s)
2. Review existing and required information 3. Gather and analyse evidence to identify needs 4. Propose ways of addressing identified needs 5. Consult with interested parties
6. Develop action plans
7. Plan for systematic implementation over a significant period of time 8. Plan the evaluation process
9. Implement the plan
10. Evaluate the program and reflect on results achieved (Alloway, Dalley-Trim, Gilbert & Trist, 2006).
To inform the action research process and design appropriate interventions the methodological specifics of this research include:
?2%2!@',,#$%&'(!A'',/!
• Quantitative data in relation to student mobility extracted from SMS • Documentation of action research cycle
• School based surveys of teachers
• Interviews with school staff – teachers and administrators and Indigenous
community members
• Analysis of other relevant material and documentation, including literacy and
numeracy achievement data.
• Analysis of programs and strategies for literacy and numeracy development.
)B)B)!4!$,0/%#-!/9#$&7&$!'5#-5!'7!%8#!9&,'%!!
The four clusters – Cairns, Riverway, Central Queensland and Logan – involved in the
‘Let’s Stay Put for Literacy and Numeracy Learning’ project are markedly different in nature.
Table 1 summarises the school population data in 2008, 2009 and Term 1 2010 and notes the number of Indigenous (Aboriginal and/or Torres Strait Islander) and non Indigenous students enrolled at key census points.
Table 2 provides a summary of key characteristics of each school within the four clusters, noting student attendance (as reported in School Annual Reports), the Broad Socio-Economic Grouping (BSEG) of each school and whether or not the school has a Special Education Unit. Each of these features is indicative of the complexities within the school community. A final column in this table notes additional features of the school
A2C,#!)*!"0112-3!'7!/$8'',!9'90,2%&'(!7'-!<0##(/,2(>!/$8'',/!&(5',5#>!&(!!"#$%&'#()&*+#! 9-'D#$%!
Population Size 2008 Population Size 2009 Population Size 2010 Cluster School
Total Indigenous Indigenous Non- Total Indigenous Indigenous Non- Total Indigenous Indigenous Non-Balaclava State
School 267 158 109 250 160 90 208 132 76
Cairns West State
School 429c 301c 128 417 302c 115 446 296 150
C
ai
rn
s
Parramatta State
School 305 178 127 325 197 128 356 214 142
Kelso State
School 449 76 373 424 85 339 401 78 323
Rasmussen State
School 409 141 268 408 167 241 390 156 234
R
iv
er
w
ay
Weir State
School 765 193 572 759 179 580 740 168 572
Allenstown State
School 424 53 371 388 40 348 350 42 308
C
en
tr
al
Q
ue
en
sl
an
d
Crescent Lagoon
State School 4164 86c 330 397 78 319 378 80 298
Marsden State
School 766 65 701 795 59 736 881 68 813
Woodridge State
School 507 58 449 527 65 462 518 53 465
Logan
Woodridge North
State School 517 53 464 471 49 422 503 44 459
4 denotes day 4 data
A2C,#!E*!@82-2$%#-&/%&$/!'7!/$8'',/!!
Cluster School Attendance rate % (2009)
BSEG
(2006) ICESEA (2009)
Special Education Unit Additional characteristics Balaclava State School
82 Low 729 X
Up to 60% Indigenous students with Torres Strait Islander students the largest group. Many students provided with meals within the school.
Cairns West State School
87 Low 689 X
Up to 70% of school population are Indigenous students. Currently operating with a ‘service agreement’ in relation to attendance and stability of students.
Cairns
Parramatta State
School 88 Low 765 X
Up to 60% of school population are Indigenous students.
Kelso State
School 90
Mid-Low 861
Rapidly changing housing in local area through significant suburban development.
Rasmussen State
School 86
Mid-Low 776 X
Up to 40% Indigenous students. Support services include Red Cross Peace Coach. Feeder suburb has very low housing tenure.
Riverway
Weir State
School 90
Mid-Low 837 X
Large population of students with special needs. A ‘positive learning centre’ – a regional behaviour
modification program – is also a feature of the school.
Allenstown State
School 93
Low 925 X
Ten percent of school population are Indigenous students. School recently renovated to cater for support staff and revised processes for administration. Central Queensland Crescent Lagoon State School
93 Low Mid 910
‘Zoned’ school. Capacity to enrol new students
determined by zoning rules.
Marsden State School
91 Mid-Low 867 X
More than 36 cultural groups are represented in the school. Significant population of Pacifika students.
Woodridge State
School 90 Low 877 X
The school has an ‘on arrival’ ESL centre. Large number of refugee students from locations of trauma: Congo, Sudan, Cambodia.
Logan
Woodridge North State School
91 Low 865 X
The Indigenous student population within each school is presented below in Figure 1, while Figure 2 presents the proportion of Indigenous students within each school mapped over a three year period. Four schools – Balaclava, Cairns West, Parramatta and
Rasmussen – show a school population with consistently more than 35% Indigenous students.
F&.0-#!)*!"&G#!'7!H(>&.#('0/!9'90,2%&'(/!
)BE!@,0/%#-!/9#$&7&$!2$%&5&%&#/!2(>!9-'.-#//!%'!>2%#!I=2-$8!EJ)JK!
JCU researchers have facilitated a range of activities during 2009 and 2010. An overview of the nature of these activities, and the participants involved in these activities, is presented in the table following (see Table 3). See Appendix 1 for presentations used in action research meetings.
A2C,#!L*!@,0/%#-!/9#$&7&$!2$%&5&%&#/!%'!>2%#!!
Date Event/activity Attendees Location
February - 2009
17/18 Whole of project workshop Principals, MSTs, ISSU managers, DET Brisbane
March
Action Research Meeting Action research team Cairns 3
Consultation MSTs Cairns
Action Research Meeting Action research team Townsville (JCU) 6
Staff briefing ISSU Townsville Townsville Action Research Meeting Action research team Rockhampton
Consultation MST MST Rockhampton
18
Staff briefing Full staff Central Queensland cluster Rockhampton Staff briefing Full staff Marsden Marsden
Consultation MST MST Marsden
Staff briefing Full staff Woodridge Nth Woodridge Nth 19
Consultation MST MST Woodridge Nth
Staff briefing Full staff Woodridge Woodridge Staff briefing Admin staff Woodridge Woodridge
Consultation MST MST Woodridge
20
Action Research Meeting Action research team Logan
26 Consultation MST Townsville clusters: MSTs Townsville (JCU)
April
8 Consultation ISSU Townsville Townsville
20 Staff briefing Full staff Cairns cluster Cairns 24 Term 1 data due
27 Staff briefing Full staff Vincent Vincent
28 Staff briefing Admin staff Townsville clusters Townsville (JCU) 30 Consultation MST Townsville clusters: MSTs Townsville (JCU)
May
5 Staff briefing Full staff Heatley Heatley 8 Action Research Meeting Action research team Cairns
11 Staff briefing Full staff Kelso Kelso
15 Action Research Meeting Action research team Townsville (JCU) 19 Action Research Meeting Action research team Rockhampton
20 Steering group meeting Brisbane
21 Action Research Meeting Action research team Logan
June
Interim Report 1 submitted
7 Action Research Meeting Action research team Townsville (JCU) Action Research Meeting Action research team Rockhampton Teacher Focus Group Volunteer teachers, MST Rockhampton 13
Consultation MST MST Rockhampton
Action Research Meeting Action research team Logan Teacher Focus Group Volunteer teachers, MSTs Logan 14
Consultation MST MSTs Logan
Action Research Meeting Action research team Cairns Teacher Focus Group Volunteer teachers, MSTs Cairns 18
Consultation MST MSTs Cairns
20 Teacher Focus Group Volunteer teachers, MSTs Townsville (Riverway)
26 Teacher Focus Group Volunteer teachers, MSTs Townsville (Tsv West)
September
17 Consultation MST Townsville clusters: MSTs Townsville (JCU)
24/25 Attend IEW Conference Townsville
October
15 Consultation MST Townsville clusters: MSTs Townsville (JCU) 30 Project consultation MSTs, DET team, JCU team, School Leadership reps Brisbane DET office
November
Action Research Meeting Action research team Cairns
13 Consultation MSTs Cairns
Action Research Meeting Action research team Rockhampton
Consultation MST Rockhampton
16
Teacher Survey Crescent Lagoon SS Staff Crescent Lagoon SS Action Research Meeting Action research team Logan
Indigenous stakeholders’
meeting DET and community members Woodridge SS
Consultation MSTs Logan
Teacher Survey Marsden SS staff Marsden SS 17
Teacher Survey Woodridge Nth SS staff Woodridge Nth SS 20 Action Research Meeting Action research team Townsville (JCU) 23 Teacher Survey Rasmussen SS staff Rasmussen SS
Teacher Survey Balaclava SS staff Balaclava SS Teacher Survey Parramatta SS staff Parramatta SS 24
Teacher Survey Allenstown SS staff Allenstown SS 25 Teacher Survey Woodridge SS Staff Woodridge SS
26 Consultation MST MSTs Townsville (JCU)
27 Teacher Survey Cairns West SS Staff Cairns West SS
30 Teacher Survey Weir SS Staff Weir SS
December
1 Teacher Survey Currajong SS Staff Currajong SS
7 Teacher Survey Heatley SS Staff Heatley SS
Teacher Survey Vincent SS Staff Vincent SS
10 Teacher Survey Kelso SS Staff Kelso SS
February 2010
)BL! 4(!'5#-5!'7!/%-2%#.&#/!%82%!2-#!6'-M&(.!%'!>2%#!!
Strategies to ensure enactment of each of the project’s aims are now well developed in each site.
N'-M!'7!='C&,&%3!"099'-%!A#2$8#-/*!!
The Mobility Support Teachers (MSTs) focus in the following areas has continued.
• Developing innovative student centred approaches and interventions to address
issues of mobility.
• Implementing whole-of-school strategies that can be used and applied across the
school/s.
All schools in the project continue to work successfully with the employment of MST. Despite the appointment of a new Principal and MST at Rasmussen school at the start of 2010, the project has continued at the school in a seamless manner. A third MST in the Cairns cluster has also been integrated in the project successfully.
The MSTs continue to develop innovative student centred approaches to address issues of mobility. In mapping the tasks completed by the MST, it is increasingly possible to ‘frame’ the tasks completed to support Indigenous student in three domains:
1. Developing the ‘readiness’ of students to learn
2. Supporting engagement in learning, with a focus on literacy and numeracy learning
3. Improving learning achievement, with a focus on literacy and numeracy.
;#2>&(#//!'7!/%0>#(%/!%'!,#2-(!
Recent studies highlight the importance of ‘learning readiness’, particularly for children living in poverty. The Implications of Poverty on Children’s Readiness to Learn Report
(2009)expands traditional definitions of learning readiness, beyond psychological
indicators such as language and cognitive development, to broader based ecological and sociological factors. Drawing on the work of Kagan & Rigby (2003), the report promotes a revised understanding of learning readiness to embrace a broader range of factors that interact in complex ways that can shape a child’s readiness to learn.
status checks including hearing and vision checks, alongside accessing family support services are also critical ‘readiness indicators’.
O(.2.#1#(%!6&%8!,#2-(&(.!
As outlined in the Department of Education and Training’s document Indigenous
Education Strategic Directions 2008-2011, ensuring active engagement with learning is a critical aspect of improving learning achievement. Without engagement with learning, improvements in achievement are unlikely. The MSTs are working systematically within the schools to improve mobile students’ engagement with learning. In particular their focus is on:
• Ensuring regular attendance and participation
• Promoting active participation in school activities
• Supporting behaviour needs, including timely referral to support staff
• Ensuring personalised learning plans are developed for each student with a focus
on literacy and numeracy learning needs.
+-'1'%&(.!,#2-(&(.!2$8#1#(%!!
The third key aspect of the MST’s work is promoting learning achievement. The MST completes diagnostic testing and is able to measure progress in collaboration with the classroom teacher.
A sample of the indicative work of the MST in relation to the three domains above, appears in Table 4
A2C,#!P*!H(>&$2%&5#!%2/M/!'7!="A!&(!%8-##!>'12&(/!
Readiness to Learn Engagement with Learning Learning Achievement • Determining support needs of
child and family
• Assisting with referrals for housing, transport, medical needs
• Linking to key Indigenous community and staff members
• Providing book/resource starter back
• Providing school uniforms • Reviewing schooling history
and reports to determine learning and support needs • Establishing relationships
• Providing overview of school’s routines • Monitoring attendance
systematically
• Updating parent/caregiver on child’s attendance including positive reports on progress
• Suggesting key components of personalised learning plan for classroom teacher • Supporting transition in
classroom or playground • Timely linking to student
support professionals
• Completing diagnostic testing
• Analysing NAPLAN results • Assisting teachers to source
appropriate teaching and learning resources • Connecting teachers to
and family
• Inclusion in in-school
supports e.g. Breakfast Club, Homework Club, social skills groups
and teacher for learning needs/transition
• Supporting classroom teacher with behaviour issues/plans
;2&/&(.!'7!"$8'',!@'110(&%3!462-#(#//!
Schools continue to work in a range of ways to engage community members in the project and the importance of schooling stability. Table 5 describes key school
communication initiatives while Appendix 2 provides examples of the materials used in each school site/cluster. Section 2.4 of this report details school specific strategies to engage Indigenous community members.
A2C,#!Q*!499-'2$8#/!%'!$'110(&%3!262-#(#//!-2&/&(.!! School Document and Website Information
Annual School Report 2008 - Introduction
Rasmussen State School has a proven record in adding value to the literacy, numeracy and social development of our students.
While the school has a high percentage of mobile students, which is reflected in the key outcomes in the middle years, we are engaged in cutting-edge research into best-practice for timely intervention for these students. This is the Let’s Stay Put campaign which is a collaborative project with James Cook University and Kelso and Weir State Schools. Our Mobility Support Teacher ensures that enrolling students settle quickly to become successful learners.
Annual School Report 2008 - Future Outlook
In the coming year, we expect to improve the monitoring of valued-addedness in literacy and numeracy of students who have been enrolled at our school for only a short time. We will have a strong emphasis on working collaboratively with James Cook University and three other school clusters in Cairns, Rockhampton and Logan as part of the federally funded Let’s Stay Put for Literacy and Numeracy program.
School Website
Section for New Students which includes Information to Parents and Students, Bus Transport, Bikeways, School Hours, Parent Liaison Officers, Special Needs, Uniforms, Admission Policy and Stationery.
Annual Operational Plan 2008 mentions MST and goals relating to mobility Student Services
A case-managed approach to student services ensures individualized achievement and builds social capital
• Focus on emotional literacy development and implementation of Circle Time in every classroom every week
• Improve cluster model of ‘Head of Student Services’ role to ensure consistent service delivery across schools
• Refine strategies to address mobility issues within cluster and extend to Bwgcolman
Through our Mobility Project, we support new students enrolling in our school and promote the one child, one school, one year principle. Students are encouraged to attend school regularly as each day of schooling counts and assists students in developing the skills they need to become life long learners.
Annual School Report 2008 - Introduction
This is the third year for our involvement in the joint Mobility Project – Let’s Stay Put – One child, one school, one year, with staff from James Cook University (JCU). The project is investigating the effect of mobility on student learning outcomes. School staff, including the Mobility Support Officer/MST who has been employed using funds from Education Queensland and Community Renewal, have worked closely with staff from JCU to continue gather data around school mobility trends and to plan interventions for school programs. The project was one the regional winners for Showcase 2008.
Kelso State School
School Website
Lists MST in staff section. Provides general information on enrolment and provides necessary forms, booklists and uniforms.
Annual School Report 2008 - Social Climate Support programs include:
School Chaplaincy, Mobility Support Officer/MST, Social Justice program, Student Council, Indigenous Aide Program, Positive Behaviour Support Program, and Breakfast Program.
School Website has section on Enrolment which includes:
Let's Stay Put Project : "Let's Stay Put - one child, one school, one year" After finding local children were changing schools regularly and struggling to settle in, the staff at Weir, Rasmussen and Kelso state schools put their heads together to develop the Let's Stay Put: One Child, One School, One Year program. Through grants, they employ mobility support officers for consistency and family support across all three schools. The program's success stories now include the North Queensland region Showcase Award for Excellence in Inclusive Education. Rasmussen State School principal Loretta Swayn said having stable schooling during the primary school years was important to children's learning. For further information go to the Education Queensland Notification of Showcase place winners notification.
The Enrolment section provides documentation for parents to print, i.e. Student Enrolment Form, and outlines necessary documentation such as a birth certificate. This section of the website also provides information on the placement of new students and the process of student transfer.
The website also provides the booklist and information on uniforms.
In the Photo Gallery section there are two images of the Noticeboard displayed at the front of the school grounds. One displays ‘Lets Stay Put Regional Showcase Winners’ the other displays the message ‘Lets Stay Put. One Child. One School. One Year.’
Weir State School
Prospectus - available on school website Includes MST as Support Staff in Prospectus
Allenstown
State School School Website Has enrolment section which outlines to make appointment with MST.
Marsden State School
School Website
The Support section has a page dedicated to Mobility Support. This page provides information on the Lets Stay Put project, outlines the expected outcomes and how these outcomes will be achieved.
Information on uniforms and enrolment handbooks are also provided.
Woodridge North State School
School Website
Lists MST in Administration Team. Also has MST listed in Support section.
Mobility, MST and LSP discussed in the Four Year Action Plan 2009, available on school website.
School Website
Mention of progress made by MST and the consideration for mobility in Four Year National Partnership documentation available on website.
Woodridge State School
Secondary website
Provides information on the Let’s Stay Put project, the role of the MST, links to the ‘every day counts’ message, tips for moving and tips for ‘staying put’, community events and contacts, literacy and numeracy supports for students and parents. http://www.woodridgess.eq.edu.au/home/alync34/index.html
"%277!+-'7#//&'(2,!?#5#,'91#(%!
A2C,#!R*!='C&,&%3!"099'-%!A#2$8#-!+-'7#//&'(2,!?#5#,'91#(%!7'-!0/#!'7!>2%2C2/#!!
S5#-5!'7!?2%2C2/#!
The Let’s Stay Put Database has been developed in Microsoft Access 2003 (Version No. 11), it will not operate using earlier versions of Microsoft Access and has not been tested in Microsoft Access 2007. See Appendix 3 for screen shots of the database. This
database has been developed in a Windows XP Professional SP2 Operating System. It has not been tested in any other Windows Operating System. All Education Queensland machines operated using Windows XP Professional SP2 and had Microsoft Access 2003 installed. The only complication encountered throughout the database installation
process was MST access to the folder containing the database.
A secure location for the database – ensuring privacy requirements – has been identified on each school’s system. The placement of the database in a secure location on the school server and password protection of the database ensures student privacy is maintained.
The Let’s Stay Put database is used mainly by MSTs, however, in some schools certain admin personnel assist in data entry. In most cases, the MST received formal training
Dates of Visits Regarding Database School and Cluster
Roll Out (2009)
Week 2 – Commencing 20th July
Wednesday 22nd July Rasmussen State School – Riverway Wednesday 22nd July Weir State School – Riverway Wednesday 22nd July Kelso State School – Riverway Week 3 – Commencing 27th July
Thursday 30th July Allenstown State School – Central Queensland Thursday 30th July Crescent Lagoon State School – Central Queensland Friday 31st July Marsden State School – Logan
Monday 3rd August Woodridge State School – Logan Monday 3rd August Woodridge North State School – Logan Tuesday 4th August Parramatta State School – Cairns Tuesday 4th August Cairns West State School – Cairns Tuesday 4th August Balaclava State School – Cairns Trouble shooting, Finalising Data Collection and Report Preparation
Week 8 – Commencing 23rd November
Tuesday 24th November Allenstown State School – Central Queensland Tuesday 24th November Crescent Lagoon State School – Central Queensland Wednesday 25th November Woodridge State School – Logan
Wednesday 25th November Woodridge North State School – Logan Wednesday 25th November Marsden State School – Logan
from a JCU Research Team Member (see dates in Table 6) and were able to pass this knowledge on to relevant personnel.
Minimal training is required to use the database. Users do not require knowledge of Microsoft Access, however, it would be beneficial for users to understand how each section of data is linked. This knowledge would assist users in correcting errors in data entry that are displayed in the Data Integrity Report. For example, if an MST creates an Enrolment Interview Note a certain set of ‘Enrolment Data’ must also be entered. The Enrolment Data is linked to that particular Enrolment Interview Note. If the MST does not enter the required data a notification will appear on the Data Integrity Report. Prior to sending data to the JCU team for analysis, the MST must check that the Data Integrity Report is cleared of all notifications. Instructions are provided to MSTs on how to clear the Data Integrity Report, however, knowledge of how the sets of data link would assist MSTs in understanding why errors appear and how to independently resolve errors.
Each MST was provided with approximately ! a day of training from a JCU Research Team Member and has been provided with ongoing support via resources prepared by the JCU team, phone calls, emails and follow-up visits (see Table 6). The initial training covered the structure of the database, data entry and editing, creating reports,
configuring the database to suit the local context, suggesting improvements for the database, creating backup copies of the database, how to move the database and sending data to the JCU Team. During the training the MST was able to practice data entry/editing, asking the JCU Research Team Member for clarification on necessary aspects.
While the training that MSTs received was adequate initially, substantial support was later required. This was partly due to unforseen issues with data entry. Whilst the JCU team and EQ personnel endeavoured to provide schools with an accurate and failsafe database in a timely fashion, the unforseen errors required additional fixes to be applied to the database. These changes were minimal and the MSTs were able to add the fixes with support via email and phone. The database that is operating in schools now is much more stable and minimises the chance of mistakes during data entry.
)BP!H(7'-12%&'(!'(!%8#!(#T%!/%#9/!%'!>#,&5#-!%8#!9&,'%!!
A number of activities are planned for 2010. These are noted and discussed in detail below.
4$%&'(!;#/#2-$8!=##%&(./!
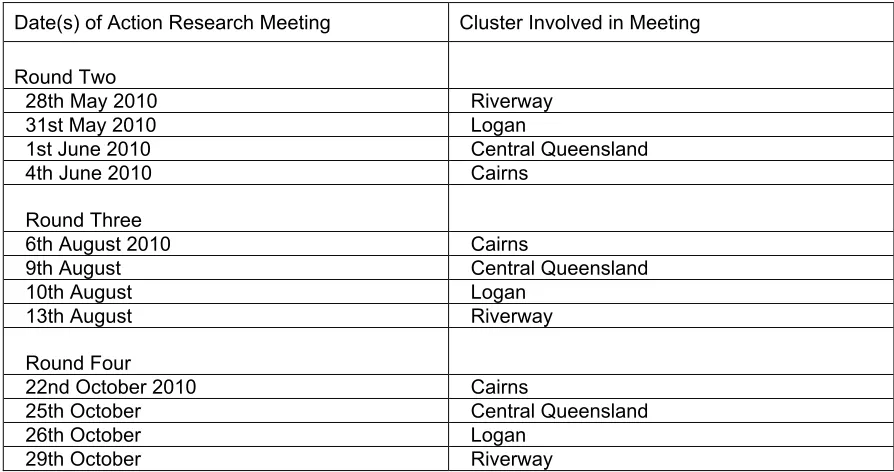
[image:21.595.83.530.237.473.2]Action Research Meetings with each cluster will continue during 2010 as detailed in Table 7 below.
A2C,#!U*!"$8#>0,#!'7!9,2((#>!4$%&'(!;#/#2-$8!1##%&(./!7'-!EJ)J!
Date(s) of Action Research Meeting Cluster Involved in Meeting
Round Two
28th May 2010 Riverway
31st May 2010 Logan
1st June 2010 Central Queensland
4th June 2010 Cairns
Round Three
6th August 2010 Cairns
9th August Central Queensland
10th August Logan
13th August Riverway
Round Four
22nd October 2010 Cairns
25th October Central Queensland
26th October Logan
29th October Riverway
"0-5#3/!
Teachers, principals and parent/carers will complete surveys in 2010.
H(%#-5/!
Interviews with Principals will be conducted as part of Round 3 action research meetings to review revised whole school strategies that enable more effective support for mobile students and to review the effectiveness of the MST role.
Interviews with key teachers will be completed in Round 4 action research meetings to review teacher practice and engagement with the project.
="A!?2%2C2/#!
Systematic reports will again be extracted from the MST database at the end of 2010.
+-'7#//&'(2,!?#5#,'91#(%!'7!%#2$8#-/!
Each cluster will prioritise actions to further the skills and knowledge of teachers in responding to the literacy and numeracy needs of students.
@'110(&%3!#(.2.#1#(%!
Work with the ISSU will focus on the implementation of appropriate engagement
strategies and measuring their effectiveness by survey and focus groups. This will be a key aspect of the action research meeting agendas throughout 2010.
The Let’s Stay Put Website will continue to expand and be utilised as a repository for community engagement materials.
)BQ! @'(%2$%!>#%2&,/!7'-!&(%#-#/%#>!92-%&#/!%'!$'(%2$%!3'0!2(>!
'C%2&(
70-%8#-!&(7'-12%&'(B
The ‘Let’s Stay Put for Literacy and Numeracy Learning’ project is supported by the following website: http://www.jcu.edu.au/letsstayput/
"#$%&'(!E*!!F-21#6'-M!?2%2!
Evidence is collected at key junctures of the project. Details are provided below.
EB)! F-21#6'-M!?2%2!V!"%0>#(%/!
EB)B)!S0%,&(#!%8#!/%0>#(%!C2/#,&(#!>2%2!$',,#$%#>!&(!EJJWX!2/!2.-##>!
&(!3'0-!O5&>#($#!F-21#6'-M!!
<02(%&%2%&5#!>2%2*!!"%0>#(%/!
=#2/0-&(.!2(>!=299&(.!='C&,&%3!!
This project uses, for the first time in Australia, a micro level analysis of movement in and out of schools to measure and map student mobility. Using the Joiners Plus Leavers (JPL)
formula (Dobson, Henthorne & Lynas, 2000), we measure the aggregate of individual movements after the first census date of the school year. In Queensland, and for our study, this date is referred to as the ‘Day 8’ census. This is the date that, traditionally, the school population is reported for the purposes of resource allocation – including teacher numbers.
The JPL formula is:
students joining the school (joiners) + students leaving the school (leavers) x 100 total school roll on the census date (DAY 8)
Using this formula, and benchmarking against the UK study, a mobility index of 20 is considered ‘high’ mobility, while an index of 35 is considered ‘very high’ mobility.
Table 8 summarises the mobility index for the school and clusters. The data presented includes 2008 enrolment data as well as 2009 data.
As noted in the last progress report, the 2008 mobility index data does not have high integrity – excepting the data from Riverway cluster, where the data was extracted under the
supervision of the JCU research team at the end of 2008. This is due to the way the
A2C,#!Y*!='C&,&%3!&(>&$#/!7'-!/$8'',/!V!EJJY!2(>!EJJW!
Mobility Index 2008 Mobility Index 2009 Cluster School Indigenous
2008
Non-Indigenous
2008
Total
2008 Indigenous 2009
Non-Indigenous 2009 Total 2009 Balaclava State
School 59.5% 41.3% 52.1% 58.8% 43.3% 53.2%
Cairns West State
School 53.2% 42.2% 49.9% 65.2% 42.6% 59.0%
C
ai
rn
s
Parramatta State
School 56.7% 40.9% 50.2% 59.4% 40.6% 52.0%
Kelso State
School 46.1% 19.8% 24.3% 36.5% 20.9% 24.1%
Rasmussen State
School 88.7% 32.5% 51.8% 71.9% 20.7% 41.7%
R
iv
er
w
ay
Weir State School 42.5% 24.3% 28.9% 41.9% 24.0% 28.2%
Allenstown State
School 41.5% 19.9% 22.6% 37.5% 15.2% 17.5%
C en tr al Q ue en sl an d Crescent Lagoon
State School 29.1% 14.5% 17.5% 16.7% 15.4% 15.6%
Marsden State
School 49.2% 27.7% 29.5% 49.2% 28.9% 30.4%
Woodridge State
School 36.2% 35.4% 35.5% 47.7% 51.9% 51.4%
Logan
Woodridge North
State School 39.6% 20.9% 22.8% 36.7% 23.9% 25.3%
Noting the potential significant underrepresentation of the index in 2008, the 2009 data
reveals that all clusters, excepting Central Queensland, have student populations with at least ‘high’ range levels of mobility. Indigenous mobility in each cluster however is above the ‘very high’ range except in Crescent Lagoon. As a zoned school, this school restricts movement and is operating under different parameters than all others in the project.
The Indigenous mobility index within all schools in the Cairns cluster and at Rasmussen school ranges between 58 and 72. These are exceptionally high levels of mobility. These indices will be updated each term in 2010.
<02(%&%2%&5#!>2%2*!Z&%#-2$3!2(>!(01#-2$3!9#-7'-12($#!
Literacy and numeracy performance as measured by achievement in the NAPLAN tests is increasingly noted as a problematic indicator of student improvement in the context of this project.
students who are mobile, and the relevance (or more aptly put, lack of relevance) of ‘whole school’ approaches to improving NAPLAN results.
OT219,#!)*!!='C&,&%3!6&%8&(![4+Z4[!%#/%&(.!9#-&'>/!
In the Cairns cluster the MSTs noted the following student who moved while undertaking the NAPLAN test as follows.
• Day 1 NAPLAN – Hope Vale
• Day 2 NAPLAN – Hope Vale
• Day 3 NAPLAN – Cairns West
This example gives rise to consideration of the high levels of mobility experienced by this student and, obviously, undertaking the movement within the testing period is highly disruptive to the student and the school testing site.
OT219,#!E*!!A-2$#2C&,&%3!'7!/%0>#(%/!0(>#-%2M&(.![4+Z4[!&(!#2$8!/$8'',!/&%#!
Each year schools are asked to formulate plans to respond their school’s NAPLAN performance. These plans are often developed for a particular cohort of students. In the context of the extraordinary levels of mobility identified in this project, it is increasingly apparent that ‘whole school plans’ are irrelevant as the cohort undertaking the NAPLAN test in Year 3 may well be a completely different group of students by the time Year 5 NAPLAN is undertaken. We refer to this issue as one of ‘traceability’.
In 2009, JCU project team member Tanya Doyle completed a detailed analysis of the
Riverway cluster, as part of an Honours thesis. Tanya used data collected from the Riverway cluster during 2008 – prior to this project’s commencements – and undertook a detailed analysis of the link between NAPLAN performance and student mobility.
F&.0-#!L*!A8#!&(%#-2$%&'(!C#%6##(!1'C&,&%3!2(>![4+Z4[!-#/0,%/!&(!%8#!@2&-(/!$,0/%#-!
These 2 data sets are interrogated “How many of these joiners and leavers have NAPLAN results recorded in the Cairns Cluster? To answer the question, an access query sought to link the EQID’s of students in both data sets.
NAPLAN results for all Joiners & Leavers in the Cairns Cluster
n = 106
NAPLAN results for each unique EQID found in the original “mobility data” set n = 79
In summary, 205 of the unique EQID’s in the Cairns Cluster “mobility data set” are missing NAPLAN results that are attached to the Cairns Cluster. This tells us, that if these students sat the NAPLAN, they did not sit it in the Cairns Cluster.
NAPLAN results for Cairns Cluster
n = 435
Joiners & Leavers in years 3, 5 & 7 in Cairns Cluster n = 232
NAPLAN results 2009 Source: PMR Corporate Data
n = 2350 This data set is
filtered so that only results related to Cairns cluster remain
Cairns Cluster “Mobility Data” 2009 Source: SMS
n = 548 This data set is
filtered so that only results for students in years 3, 5, & 7 remain
Figure 3 above presents the challenges, at school level, of implementing a response to NAPLAN results in the context of high levels of mobility. A whole school plan is clearly inappropriate in such contexts. Individualised case management of each student is more pertinent and indeed required, but is also more resource intensive.
S5#-2,,![4+Z4[!-#/0,%/!
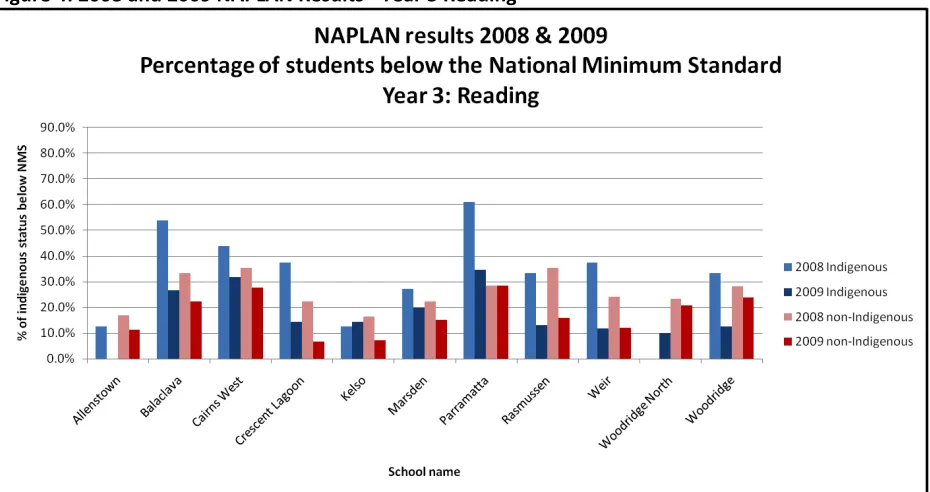
A comparison of 2008 and 2009 NAPLAN results for each of the NAPLAN strands is provided below. This comparison is of limited use given the issue of traceability, but serves to note the overall trends in the school.
F&.0-#!P*!EJJY!2(>!EJJW![4+Z4[!;#/0,%/!\!]#2-!L!;#2>&(.!!
F&.0-#!R*!EJJY!2(>!EJJW![4+Z4[!;#/0,%/!\!]#2-!U!;#2>&(.!
!
F&.0-#!Y*!EJJY!2(>!EJJW![4+Z4[!;#/0,%/!\!]#2-!Q!N-&%&(.!
!
F&.0-#!)J*!EJJY!2(>!EJJW![4+Z4[!;#/0,%/!\!]#2-!L![01#-2$3!
F&.0-#!)E*!EJJY!2(>!EJJW![4+Z4[!;#/0,%/!\!]#2-!U