Learning Agreement Pilots
Quantitative Evaluation
Research Report DCSF-RR119
Jane Perry, Susan Purdon, John D’Souza and
Steven Finch
Learning Agreement Pilots
Quantitative Evaluation
Jane Perry, Susan Purdon, John D’Souza and Steven Finch
National Centre for Social Research
The views expressed in this report are the authors’ and do not necessarily reflect those of the Department for Children, Schools and Families.
© National Centre for Social Research 2009
ISBN 978 1 84775 458 5
June 2009
i
Contents
EXECUTIVE SUMMARY ... 1
The Learning Agreement Pilots ... 1
The evaluation of LAP ... 1
The quantitative evaluation ... 1
What difference did LAP make? ... 2
Was the impact of LAP higher for some groups than for others?... 2
What was the rate of take-up of LAP?... 2
Who took part in LAP? ... 2
Why did young people decide to take part in LAP?... 3
What were participants’ perceptions of how LAP helped them? ... 3
What study did LAP participants do? ... 3
Why did some LAP participants not study or achieve a qualification? ... 3
How important were the Personal Advisers? ... 3
Were employers engaged with LAP and did this make a difference? ... 4
What was the role of payments? ... 4
What did participants value about LAP? ... 4
Conclusions... 5
1 INTRODUCTION ... 6
1.1 The Learning Agreement Pilot (LAP) ... 6
1.2 The evaluation ... 8
1.3 Research Design and Methodology ... 8
Aims ... 8
Selecting young people to interview ... 9
Fieldwork ... 9
1.4 This report ... 10
Reporting conventions... 10
Report structure:... 11
2 CHARACTERISTICS OF PARTICIPANTS... 12
2.1 Key findings ... 12
2.2 Introduction... 13
Definition of participants ... 13
2.3 Personal Characteristics ... 13
2.4 Family background ... 14
2.5 School attendance and GCSE attainment... 14
2.6 Activities at time of survey interview... 16
Main activity... 16
Participation in AA ... 17
2.7 Job characteristics... 17
2.8 Activities since school ... 18
2.9 Comparison with non-participants ... 18
ii
3 PARTICIPANTS’ EXPERIENCES OF LAP ... 20
3.1 Key Findings... 20
3.2 Introduction... 21
3.3 Starting and Ending a Learning Agreement ... 22
Length of time on LAP ... 23
3.4 Deciding to take part in LAP ... 23
How first heard of LAP ... 23
Motivations for taking part in LAP... 23
3.5 LAP status at time of interview ... 25
Reasons for not studying... 25
3.6 Studying for qualifications ... 26
Qualifications studied during LAP ... 26
Details of courses taken ... 28
Qualification achievement ... 29
3.7 Contact with Personal Advisers... 30
Usefulness of contact ... 32
3.8 Employer Engagement ... 33
3.9 Perceived value of LAP ... 34
3.10 Conclusions... 35
4 LAP PAYMENTS AND EXPENDITURE ... 37
4.1 Key findings ... 37
4.2 Introduction... 37
4.3 Receipt of payments... 38
Those who had finished LAP... 38
Those still on LAP ... 38
4.4 Delivery of payments ... 39
4.5 Use of payments ... 39
4.6 Views of payments ... 40
4.7 Conclusions... 40
5 THE IMPACT OF LAP ON PARTICIPANTS... 41
5.1 Key findings ... 41
5.2 Introduction... 42
5.3 How impact is measured ... 42
5.4 The impact of LAP on the experiences of JWT young people... 43
5.5 The short-term impact of LAP after participation ... 47
5.6 The impact of LAP on attitudes towards the future, learning and work ... 48
5.7 The relationship between impact and LAP participation rates... 50
5.8 Participants’ perceptions of impact... 50
5.9 Conclusions... 51
iii
Appendix A Results tables for chapters 2-4... 54
Appendix B Results tables for impact analysis (chapter 5) ... 80
Appendix C Details of propensity score matching ... 85
Appendix D Impact on participants and impact on the eligible population .... 90
Appendix E The relationship between impact and the participation rate ... 91
Appendix F Additional LAP Sample... 93
Appendix G Survey methodology... 97
iv
Acknowledgements
We would like to thank the young people and parents who gave up their time to provide information about their activities and experiences for this research. We would also like to thank the staff of Connexions services that provided records of young people who were in jobs without training for the sampling process and administered opt-out mailings to young people who were selected for the research.
Susanna Greenwood and Vikki McAuley managed the study for the Department of Children, Schools and Families. We are grateful for their support and for the helpful feedback that they, steering group members and other colleagues involved with the pilots provided. Our
colleagues in the consortium, particularly Jim Hillage and Claire Johnson of IES and Sue Maguire of the CEI, Warwick provided helpful comments at various stages of the process.
Within NatCen, Juliet Michaelson managed the study for most of its duration. Jenny
1
EXECUTIVE SUMMARY
The Learning Agreement Pilots
The Learning Agreement Pilots (LAP) was an initiative aimed at increasing access and take-up of education or training for 16 and 17 year olds in jobs without training (JWT). Overseen by the Department for Children, Schools and Families (DCSF) and the National Learning and Skills Council (LSC), LAP was delivered at the local level by the Connexions service and the local Learning and Skills Council (LLSC) in eight areas in England from April 2006. Young people were recruited to LAP by Connexions Personal Advisers who provided advice and guidance about learning opportunities. The Personal Adviser drew up a Learning Agreement for the young person and in most cases their employer, outlining the accredited training that the young person planned to undertake. Under some variants of the programme financial incentives in the form of bonus payments or wage compensation were provided in return for progress and qualification completion on the LAP.
The evaluation of LAP
The evaluation of LAP was carried out by a consortium comprising the Institute for Employment Studies (IES), the Centre for Education and Industry, University of Warwick (CEI) and the National Centre for Social Research (NatCen). The evaluation had three strands:
• a quantitative evaluation, using surveys of young people to measure the impact of the pilots in comparison to a number of control areas;
• a programme theory element, focusing on testing some key aspects of the policy to identify what works, what does not and the reasons for this; and
• a process evaluation, examining the ways in which the pilots have been set up and delivered and the main issues associated with their implementation.
This report presents the key findings from the quantitative evaluation which was conducted by NatCen.
The quantitative evaluation
The principal objective of the quantitative evaluation of LAP was to measure the
effectiveness of LAP in increasing young people’s participation in education and training. It also sought to measure how young people’s attitudes and aspirations changed as a result of participation. The evaluation used a robust comparison design whereby outcomes for LAP participants were compared with those for a comparison group of similar young people in areas where standard support arrangements applied. This allowed estimation of what difference LAP made, that is how many young people had outcomes that would not have otherwise happened.
2
What difference did LAP make?
Participation in LAP very significantly increased young people’s rate of studying for
qualifications compared to young people in comparison areas. At least 31% of participants studied who otherwise would not have. It is very clearly not the case that LAP only attracted young people who would have taken up study without the intervention of LAP.
Reflecting this increase in study, there was a positive shift towards jobs with in-house training. About 11% of participants took up work with in-house training who otherwise would not have done and the proportion who were in work without training was correspondingly lower.
LAP was also associated with small but positive impacts on young people’s attitudes towards learning, with fewer participants saying that they were not interested in learning and more saying that it was important for learning to have a qualification at the end of it. LAP
participants were more likely to say that “in looking for a job I am more concerned to find one with training than one that pays the best.”
Was the impact of LAP higher for some groups than for others?
The impact of LAP was generally similar for men and women except that there was a higher impact on participation in work-based training for men than for women. Similarly, older (17 year old) participants and those who had higher qualifications (five or more GCSEs at A*-C) were more likely to move into work-based training through LAP.
What was the rate of take-up of LAP?
The evaluation estimated that the take-up of LAP among eligible (JWT) young people was roughly 8.5%. (Given the difficulties in identifying the eligible population for the research, this figure should be viewed as an estimate). Thus, the 31% impact on participants’ study would imply an impact of about 3% on study for the eligible population.
Who took part in LAP?
LAP participants were slightly more likely to be female (54%) than male (46%). 95% were of White ethnic origin. Nearly all participants (94%) classified themselves as single and 90% were living with their parents. A minority were living with a partner (4%) or with others (3%). Only 3% had children, most of who were living with them.
Of the participants who were living with their parents, a little over half (57%) had parents who had no post-16 qualifications. 13% had parents who were not currently in work.
85% of participants reported that they had attended school regularly in their final year. 10% did not attend regularly and 5% did not attend at all.
Participants varied widely in their GCSE attainment but overall had much lower levels of attainment than the national average. Only 31% achieved 5 GCSEs at A*-C grade. 11% had failed or not taken Maths GCSE and the same proportion had failed or not taken English GCSE.
3
Why did young people decide to take part in LAP?
When young people were asked why they took part in LAP, the most common reasons cited were to get help with education, training or qualifications (48%), to be able to combine work and study (31%) and to get help finding a job or furthering their career (19%).
What were participants’ perceptions of how LAP helped them?
When asked at a follow-up interview how LAP had helped them, most participants had positive views. Two-thirds (66%) said that it had helped them to find a course of study and 47% said that they would not have been able to study for a qualification while working without it. 42% agreed that LAP had helped them with their current job and 73% felt that it would help them with jobs they would like to do in the future. Most participants felt that the programme was useful and found participation enjoyable.
What study did LAP participants do?
Most LAP agreements (82%) covered just one course. Most courses were at Levels 1 or 2 (36% and 37% respectively) while 9% were said to be at a higher level and for 19% the level was not identified by the participant.
The courses studied under LAP were often not at a higher level than participants’ prior qualifications. Comparison of prior qualifications with those studied under LAP suggested that 39% of those with highest prior qualifications at Level 1 and 15% of those with highest prior qualifications at Level 2 studied at a higher level under the programme.
At the time of the survey interview two thirds (65%) of respondents had finished their involvement in LAP, including 23% who had completed a qualification, 16% who had left without completing their studies and 26% who had left without undertaking any learning activities. Among those who had completed a qualification under LAP, 89% passed.
34% of respondents were still taking part in LAP at the time of interview, including 26% who were completing a qualification.
Why did some LAP participants not study or achieve a qualification?
Where participants had not yet studied on the programme at the time of the survey interview, the most common explanations were problems finding or arranging a course and waiting for a course to be arranged or for it to start. This confirms the evidence of the process evaluation that there were some problems with lack of capacity and resources among providers and a lack of flexibility in provision.
Where participants had left LAP without finishing their study, the most common explanations were lack of enjoyment of the course, the ending of a job and lack of time. In other cases failure to complete study was explained by other personal circumstances.
How important were the Personal Advisers?
4
Most young people appreciated their contact with their Personal Adviser (PA) (45% said that it was “very useful” and a further 37% said that it was “fairly useful”). In general, the more frequently participants had contact with their PA, the more this was appreciated. However, there was no evidence of a relationship between the frequency of contact and the likelihood of achieving a qualification.
In comparison with the role of the PA on the AA pilots, PA support on LAP was less intensive and the ratings of the helpfulness of the support provided were not quite so positive.
Were employers engaged with LAP and did this make a difference?
Three quarters of young people said that their employers were aware of their participation in LAP and in two thirds of these cases, the employer was said to be supportive.
While problems with employers were rarely mentioned as a reason for discontinuing study, the level of support from employers did make a difference to the level of success that young people achieved through LAP. Young people whose employers were characterised as providing “a lot” of support had higher rates of study and qualification achievement. This supports the findings of the process evaluation and programme theory evaluation that employer support improved retention and completion rates.
What was the role of payments?
Most, but not all, participants in payment areas reported that they had received some
payment as part of LAP. For some, lack of payment was related to not having studied, or not successfully completing the course. However, there were a minority of participants (13%) who had come to the end of their studying as part of LAP but had not (or were not aware of having) received a payment. There was a lot of variation in the amount of payments reported by participants in payment areas. It was not clear that this was entirely explained by some young people failing to complete their courses. Variation in implementation may also have been a factor since the process evaluation showed that the payment targets differed between pilot areas.
Nearly all payments were made electronically, direct to participants’ bank accounts. However, 10% of participants received payments by cheque or cash.
When asked to give a retrospective view of whether they would have taken part in LAP without payments, 86% of participants in payment areas said that they definitely or probably would have done. Together with the low proportion mentioning spontaneously that the payments were a motivating factor (14%), this suggests that the payments were of marginal importance compared to the support and the opportunity to study.
The proportion of LAP participants in payment areas who thought that they would have taken part without the payments was higher than for AA participants (86% compared with 75%), suggesting that the payment had slightly less importance for LAP than for AA.
What did participants value about LAP?
5
Conclusions
In conclusion, the main findings were:
The LAP was successful in encouraging young people to engage with learning and this was reflected in greater involvement with training as part of a job. LAP helped about a third of participants to take up learning when they would not otherwise have done so. It also increased participants’ awareness of learning opportunities and their motivation to study. The individualised support of Personal Advisers made a positive contribution to participation and payments helped delivery of the programme in the areas where they operated. Employers were mostly tolerant or supportive of the programme and strong support was associated with positive outcomes.
Although the impact on participants was positive, the take up rate among the 16-18 JWT target population appears to have been quite low (roughly 8.5%). Many of those eligible for LAP were not aware of the programme. This will have severely limited the impact of LAP on the whole target eligible population. For those who did take part, there was also indication that problems with capacity and flexibility of provision were an important limitation on the success of the programme, at least in the short-term.
There were some similarities between the LAP and AA but also key differences
between the programmes and the young people they supported. This suggests positive potential for the two programmes to operate in a complementary way under the Raising Participation Age agenda. However, the evaluation leaves some unanswered questions about the quality of learning undertaken and the sustainability of impacts.
The synthesis report for the evaluation of LAP cross-references these quantitative findings with the process evaluation’s evidence about implementation and delivery issues and the programme theory element’s focused studies1.
1
6
1
INTRODUCTION
1.1 The Learning Agreement Pilot (LAP)
The United Kingdom has one of the lowest rates of post-16 participation in education or employment in Europe, with the problem being particularly acute at age 17. Just under 10% of 16 and 17 year olds in England, around 100,000 young people, do not participate in any form of education, training or employment (often referred to as ‘NEET’). A further 85,000, around 8% of the cohort, are in employment which does not offer nationally accredited training (‘Jobs Without Training, JWT). There are local and regional variations across the UK, in the proportions of young people who become NEET and who enter JWT.
The 2005 Budget announced the piloting of 2 new initiatives aimed at extending participation in education and training among young people aged 16-18: Eighty million pounds was allocated over 2 years to Learning and Activity Pilots (LAP), which aim to increase access and take-up of training for 16 and 17 year olds in jobs without training (JWT). In addition, £60 million over 2 years was allocated to Activity Agreement pilots (AA) to support disengaged NEET 16 and 17 year olds back into learning.
Learning Agreements were piloted in eight pilot areas in England. They were originally established in April 2006 to run for two years. The Learning Agreement Pilot is a joint initiative between Connexions and the local Learning and Skills Council in each pilot area. The initiative is targeted at young people aged 16-17 who are working full-time but not engaged in any nationally accredited training. Young people are recruited to LAP by Connexions Personal Advisers who provide advice and guidance about learning
opportunities. Referrals to LAP also come from local Training Providers and, in some areas, from other brokerage organisations such as Train to Gain. The PA draws up a Learning Agreement for the young person and in most cases their employer (an employer is not required to be part of the LAP), outlining the accredited training that the young person will undertake.
Under some variants of the programme, financial incentives in the form of bonus payments or wage compensation are provided in return for progress on the LAP. The financial incentive varied, with a view to identifying and understanding the most successful models: in some pilot areas young people and their employer were paid a £250 bonus, in some the employer additionally received wage compensation, while in the remainder no incentive was paid to either the young person or employer (i.e. the young person only had the agreement). The pilots were extended for a further year, from April 2008. In Learning Agreement pilot areas, the existing variants were retained, with exception of the payment of wage compensation, which had operated in two pilot areas. The quantitative research covered in this report took place before the extension pilots began.
The Learning Agreement is aligned to the following principles:
• Personalisation: agreed activities are tailored to the individual and take account of personal needs and abilities, determined by the profiling and assessment process undertaken by the young person with the Personal Adviser.
• Participation: focusing on encouraging and supporting the young person to participate in accredited training.
7
• Progression: support and learning provision that provides appropriate progression routes for the young person to achieve higher-level qualifications if appropriate.
The eligible learning provision comprises all training courses covered under Section 96 of LSC’s Learning Aims Database. This includes:
• Qualifications accredited at Level 2 or above, e.g. Apprenticeships and Advanced Apprenticeships, BTEC and similar FE courses, GCSEs and A-Levels (but not standalone NVQs).
• Provision which supports progression to Level 2, as long as the learning plan also addresses basic and/or key skills, including Basic Skills in literacy and numeracy, NVQ 1 and Technical Certificates, and other short courses over 10 guided learning hours.
• Standalone Key Skills qualifications, including wider skills and those which support the LSC’s Skills for Life Target.
The 3 variants of LAP were implemented in 8 pilot areas, 4 of which were also implementing variants of AA as shown in Figure 1.1. Six ‘control areas’, where LAP was not being piloted, were included in the study for comparison purposes.
Figure 1.1 LAP variants and areas
Variant Areas Description
Lancashire Mixed rural and urban area: 15 Local Authorities
South Yorkshire Predominantly urban area: 4 Local Authorities
Variant 1
Bonus payment only
Cornwall and Devon* Large predominantly rural area: 18 Local Authorities
Greater Manchester* Large urban area: 10 Local Authorities Variant 2
Bonus payment and wage
compensation London East* Large urban area: 10 Local Authorities
Black Country Mixed rural and urban area: 4 Local Authorities
Essex, Southend & Thurrock Mixed rural and urban area: 3 Local Authorities
Variant 3
Learning Agreement only
(no bonus payment or wage compensation)
West Yorkshire* Mostly urban area: 5 Local Authorities
Control Areas
No LAP pilot
Northamptonshire
North Yorkshire
Cheshire and Warrington
South Central*
South London*
Somerset*
8
1.2 The evaluation
The Department for Children, Schools and Families (DCSF), formerly the Department for Education and Skills (DfES), commissioned the Institute for Employment Studies (IES), the Centre for Education and Industry (CEI), and the National Centre for Social Research (NatCen) to carry out an evaluation of the Activity and Learning Agreement Pilots.
The evaluation has 3 main strands:
• a quantitative evaluation, using surveys of young people to measure the impact of the pilots in comparison to a number of control areas
• a programme theory element, focusing on testing some key aspects of the policy to identify what works, what does not and the reasons for this
• a process evaluation, examining the ways in which the pilots have been set up and delivered and the main issues associated with their implementation
The process and programme theory evaluations have gathered data from qualitative
interviews and roundtable discussions, analysis of reports and documents and observations of procedures and practices. The process evaluation has produced evidence about
implementation and delivery issues. The programme theory element’s focused studies have produced evidence about the ‘kickstart’ role of role of advice and guidance and the ‘menu of choice’ and ‘broker’ theories of how LAP would work effectively. Separate reports have been produced for the different evaluation strands2
This report describes findings from the LAP quantitative evaluation based on the main survey interview and follow-up interviews with a sub-sample of participants. The synthesis report for the LAP evaluation, drew together the quantitative findings with other evidence from the process and programme strands.
1.3 Research Design and Methodology
This section presents an overview of the research design and survey methodology including sample design and fieldwork. Full details will be available in the technical report for the study.
Aims
The survey’s primary objective was to measure the effectiveness of LAP in increasing young people’s participation in education and training and promoting work. The evaluation was designed to produce an estimate of the impact of the programme for each of the 3 variants, as well as for the LAP pilots overall.
Data was collected through a large quantitative survey carried out with around 8,500 young people in the pilot and comparison areas for the AA and LAP pilots. Collecting data directly from young people, and where possible from their parents as well, also allowed their experiences and views of LAP to be described.
2
9
Selecting young people to interview
The sample was designed to be equivalent to the LAP eligible group in pilot areas, that is young people who were status-checked by Connexions between 1st April 2005 and 31st June 2007 and found to be in JWT in that period.
The sample for the survey was created by collating administrative records from each Connexions area. Connexions staff were asked to identify young people who were found to be JWT. In addition to JWT records, Connexions offices in LAP pilot areas were also asked to supply records for everyone taking up a Learning Agreement within the given period. This allowed the inclusion of additional LAP participants who, for whatever reason, did not have accurate information recorded at the time of the status check3.
Local Connexions offices sent letters to selected individuals inviting them to take part in the evaluation, but also giving the option to opt-out if they preferred not to be contacted. The contact details of the young people who did not opt out were passed to NatCen for contacting as part of the survey.
Fieldwork
The main survey interviews were carried out between July 2007 and March 20084, using a mixture of face-to-face and telephone interviewing. In total, 8,508 interviews were carried out (Figure 1.2)5. For the main LAP survey, 4,774 interviews were conducted in the pilot areas (divided fairly evenly between the 3 LAP variants) and 3,392 in comparison areas. Of the 4,774 young people interviewed from pilot areas, 511 were classified as LAP participants. In addition to the main sample identified as JWT from Connexions data, 342 interviews were conducted with an additional sample of LAP participants (for more details see Appendix F).
The response rate for the main survey was 40%.
Figure 1.2 Achieved interviews
Sample Type
JWT
Eligible Group
Additional
LAP Participants
Total
LAP pilot areas 4,774 342 5,116
LAP Control areas 3,392 - 3,392
Bases (unweighted) 8,166 342 8,508
Base = All
3
This ‘Additional LAP participants’ group are not included in main analysis presented in this report. For further details see Appendix E.
4
Interviews for LAP Variants 1 and 2 and LAP control areas took place between July 2007 and March 2008. Slow throughput for LAP Variant 3 meant that fieldwork was not able to start until October 2007.
5
10
Main interviews were mostly carried out by computer assisted telephone interviewing (CATI), although these were supplemented by face-to-face interviewing (CAPI) in order to ensure that the fieldwork could be completed to timetable6. Telephone interviewing meant that only young people for whom telephone numbers could be obtained were included in the survey sample; it also restricted the length of the main young person’s interview to less than 30 minutes (the maximum length that was consistent with obtaining good response and data quality).
In addition to the main interview with the young person, 6,794 interviews were carried out with one parent in the family (47% of those who lived with their parents). This gathered accurate data on family background and established parents’ views of young people’s activity choices and involvement with Connexions. Where a parent was not available, the young person was asked a shorter set of proxy questions. This yielded a further 5,006 proxy parent interviews.
In order to examine the experiences of participation in LAP in more detail than space allowed at the first interview, follow-up interviews with 191 survey respondents who reported
participation in LAP were carried out in April and May 2008, after the end of the main fieldwork period. Analysis of these interviews is included where appropriate. The response rate for the follow-up survey was 64%.
After fieldwork had been completed the analysis samples were reduced to exclude young people who were recorded as being 18 or over before they became JWT. This reduced the sample sizes by 14 for participants, 598 for non-participants in pilot areas and 394 for people in comparison areas.
1.4 This report
This report presents findings from the quantitative evaluation. It includes descriptive analysis of the characteristics of those who took part as well as details of their experiences of
participating in LAP. In addition, impact analysis is used to assess the effect of LAP on the eligible population and on those who took part.
The analysis presented here focuses on the main “jobs without training” sample. These are young people identified from Connexions records as being eligible for LAP. Where
appropriate, comparison is made to an equivalent sample of young people in the control areas7.
Reporting conventions
The report’s findings are described briefly in the main body of the report and, where appropriate, illustrated with graphs or simple tables.
6
DCSF required that all interviewers should be CRB-cleared, but CRB is currently unwilling to provide clearances for telephone interviewers. As NatCen only had a limited number of telephone interviewers with CRB clearance (obtained before the CRB clarified its policy), it was able to use those interviewers for the research but could not replenish them. Therefore in peak quarters, when the volume of interviewing exceeded the limited capacity of CRB-cleared telephone interviewers, face-to-face interviews were also used.
7
11
The tables on which this analysis is based are included in the Appendix. Tables generally show percentages but include two rows at the bottom showing the number of respondents on which the figures are based (known as the ‘base’). Two base figures are shown: the bottom row in each table shows the actual number of respondents; the row immediately above demonstrates the effect of using weights to correct for sampling.
In the chapters presenting descriptive analysis, percentages are rounded to the nearest whole number. Percentages of less than 0.5% are shown as * and those calculated from base sizes of less than 50 are shown in square brackets i.e. [19%].
In the descriptive analyses in Chapters 2 to 4, differences are only reported if they have a 95% probability of being statistically significant. This means that 95 times out of every 100 (or 19 times out of every 20), the result will not have occurred purely due to random chance8. Statistical calculations of significance take account of the complex sampling errors created by the sample structure.
Report structure:
This report is structured as follows:
• Chapter 2 provides describes the characteristics of those who took part in LAP before they started the programme and compares them with non-participants.
• Chapter 3 presents participants’ experiences of Learning Agreements, including differences according to variant.
• Chapter 4 focuses specifically on the role of bonus payments and wage supplementation.
• Chapter 5 presents findings from the analysis of the impact of LAP on participants.
8
In addition, the p-value associated with impact estimates is given. The p-value is the probability that a result is
12
2
CHARACTERISTICS OF PARTICIPANTS
2.1 Key findings
•
Participants were predominantly white (95%) and mostly aged 17 (40%) or 18 (55%).o They were generally in good health, with only 3% reporting a disability which affected their daily activities.
o Most participants (90%) were still living with their parents and only a very few (3%) had children of their own.
•
In terms of family background, there was some indication of disadvantage and parental low educational achievement:o 13% had parents who were not currently in work.
o 16% had received free school meals at school.
o 57% had parents without qualifications higher than GCSE.
•
LAP participants typically had better school attendance and higher GCSE attainment than participants in Activity Agreements:o 10% reported irregular attendance in Year 11 and 5% said they had not attended at all.
o 31% had 5 or more GCSEs at A*-C compared to 14% of the AA group.
•
In common with many of their age group, LAP participants were involved in a wide range of activities alongside paid work at the time of the survey:o For example 30% of those in paid work were also studying at the same time.
o When asked to select their main activity, 70% of participants said paid work (or work-based training), 13% said education/study and 13% said they were looking for a job / education place.
•
Most participants reported job characteristics and work history which were consistent with their age and experience:o Nearly all were employees, just under a third (29%) were in temporary jobs, with a similar proportion working part-time.
o Many had had several jobs in the 2-3 years since leaving school (34% had had 2 jobs since school and a further 26% had 3 or more jobs).
13
2.2 Introduction
This chapter provides background information regarding the personal and family characteristics of LAP participants before they took part in LAP.
Definition of participants
This analysis focuses on those who took an active part in LAP. In order to match common understanding most closely, active participation is defined as those who said they had agreed to take part in LAP and who reported that they had been assigned a Personal Adviser or had studied for a qualification as part of LAP.
This means that a small number of young people who said they had agreed to take part in LAP but who had never been in contact with a Personal Adviser and had never undertaken any learning activity as part of LAP are excluded from the analysis.
2.3 Personal Characteristics
Young people taking part in LAP were:
•
Slightly more likely to be male (54%) than female (46%).•
Mostly aged 17 or 18 at the time of survey interview (40% were aged 17 and 55% were aged 18).•
Single (94%); only 6% were married/living with a partner.•
From white ethnic groups (95%).•
Mostly in good health:o 56% said their health was “very good”, 38% “fairly good”;
o 6% reported a disability, with 3% saying this affected their daily activities (Table A.1). .
Most (90%) of the young people taking part in LAP still lived with their parents; 4% lived with a partner and 3% with another relative. Only 3% lived alone (Table A.2).
3% of participants had children of their own. Most commonly dependent children were living with the respondent, but a small minority had children who lived elsewhere. 4% reported that they cared for sick/disabled person who lived with them (Table A.2).
In terms of personal characteristics measured by this survey, LAP participants were fairly similar to those who participated in the Activity Agreement scheme (aimed at those Not in Education, Employment or Training). The main differences were that LAP participants were:
•
older on average (only 1% were age 16 compared to 36% of AA participants) ;•
less likely to be from a minority ethnic group (5% compared to 13% of AA participants);•
less likely to have children (3% compared to 9% AA participants)9.
9
14
2.4 Family background
Many LAP participants came from families where the parents had a low level of educational achievement: 57% had parents with no known post-16 qualification, 30% with a post-16 qualification below degree level and only 10% had parents with a degree level qualification. This was broadly comparable with AA participants (Table A.3).
There was some indication of worklessness and deprivation: 13% of those taking part in LAP had parents who were not currently in work, and 16% had received free school meals at school. A substantial proportion of parents were receiving Child Benefit and/or Child Tax Credit, presumably on behalf of other younger children. 17% of participants’ parents were receiving Working Tax Credit, 17% Council Tax Benefit, 14% Housing benefit and 10% Income Support. 15% were receiving Incapacity Benefit, Disability Living Allowance or other disability related benefits (Table A.3).
Of those where one or more parents were in work, the majority (66%) were in routine or manual occupations with 20% in intermediate occupations and 12% in managerial or professional occupations10 (Table A.3).
Of those with a parental interview which included income information, 26% reported a weekly income (including benefits but before tax) of less than £200 a week, 25% between £200 and £399, 18% between £400 and £699 and 31% £600 a week or more.
2.5 School attendance and GCSE attainment
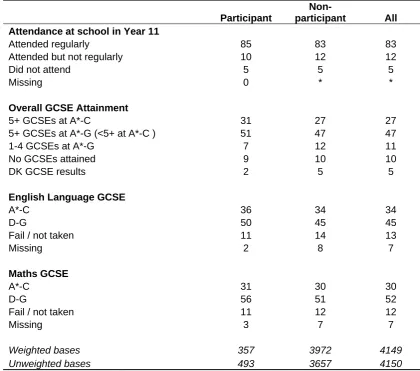
Most (85%) of those taking part in LAP had attended school regularly in Year 11, but 10% reported irregular attendance and 5% said they had not attended at all (Figure 2.1 and Table A.4). Attendance was significantly higher than the AA participant group, only 63 per cent of whom attended school regularly and 14% of whom did not attend school at all in Year 1111.
10
Parental occupational status coded using NS-SEC (3 categories) for the highest parental occupation in the household.
11
15
Figure 2.1 Attendance at school in Year 11
Attended regularly 85% Attended but not
regularly 10%
Did not attend 5%
Base = All participants (JWT sample): N=493 Source: Table A.4
37% of LAP participants who had not attended school regularly said the main reason was “playing truant”, 19% had been excluded and 12% said they had been ill.
As would be expected, overall levels of attainment were lower than the national average, but also higher than those recorded for participants in the Activity Agreement scheme.
Compared to 62% of pupils achieving 5 or more GCSEs at A*-C level across the country, only 31% of LAP participants reached this level (14% of AA participants). At the other end of the spectrum, 9% of LAP participants did not attain any GCSEs in their final year at school compared with 1% nationally but 29% of AA participants. (Figure 2.2 and Table A.4)
Figure 2.2 GCSE attainment of LAP participants compared with AA participants and all young people at the end of Key Stage 4 in England 2006/7
Column percentages
LAP Participants AA Participants All young people in England
Overall attainment
5+ GCSEs at A*-C 31 14 62
5+ GCSEs at A*-G (<5 at A*-C) 51 36 30
1-4 GCSEs at A*-G 7 17 7
No GCSEs attained or DK 9 29 1
DK GCSE results 2 4 0
Weighted base 355
Unweighted base 493 1018 648,752
Base: All participants (JWT sample)
16 In terms of basic skills:
•
11% of LAP participants had failed or not taken Maths GCSE and only 31% had achieved Grade A*-C.•
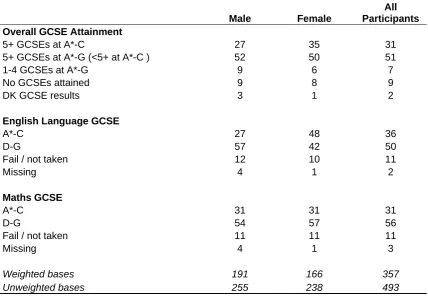
11% had failed or not taken English GCSE and only 36% had achieved Grade A*-C (Table A.4).Although 35% of female participants had achieved 5 or more A*-C grades compared to 27% of boys, this difference was not large enough to be significantly significant. There was
however a significant difference in achievement in GCSE English, with 48% of girls achieving grade A*-C compared to only 27% of boys. There appeared to be no gender difference in achievement for Maths GCSE (Table A.5).
2.6 Activities at time of survey interview
At the time of the survey interview, respondents were asked whether they were currently doing a range of activities including paid work, study or looking for work12.
Most common activities were paid work (and work-based training), education / study and looking for work / study. A very small minority reported a wide range of other activities such as voluntary work, looking after children or the home/family, other training/personal
development courses or taking a break from work/study (Table A.6).
As is common for young people of their age, many participants reported being involved in more than one activity at the time of interview. For example, of LAP participants who were in paid work, 30% were also undertaking education/study and 14% were looking for a job.
Main activity
Respondents were asked to select one activity as their ‘main activity’. 68% of participants saw paid work as their main activity, with a further 2% saying ‘work-based training. 13% said their main activity was education/study and 13% were looking for a job/education place. The remaining 5% of responses were scattered across the range of other activities (Table A.6).
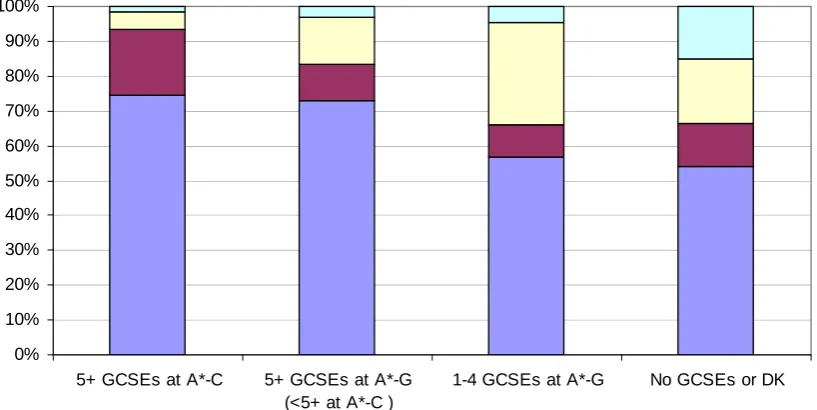
There were no significant differences in main activity status of LAP participants according to gender or age. However activity status of participants was linked to GCSE attainment at school: those with 5 or more GCSES were more likely to be in paid work (Figure 2.3).
12
17
Figure 2.3 Main activity (at time of interview) by GCSE attainment (at school)
0% 10% 20% 30% 40% 50% 60% 70% 80% 90% 100%
5+ GCSEs at A*-C 5+ GCSEs at A*-G
(<5+ at A*-C )
1-4 GCSEs at A*-G No GCSEs or DK
Paid work/work-based training Education/Study Looking for work/study Other
Base = All participants (JWT sample): N=493
Participation in AA
5% of LAP participants (and a similar proportion of non-participants) said they had also taken part in the Activity Agreement scheme13. This indicates a fairly small level of overlap between the JWT and NEET groups.
2.7 Job characteristics
Most participants reported job characteristics which are consistent with their age and experience14:
•
Nearly all were employees, only 4% were self employed.•
71% had permanent contracts, but 29% were in temporary or fixed term contracts.•
Most (86%) were not part of formal government training schemes, although 9% said they were in an Apprenticeship.•
69% were working full-time, 31% were working part-time.•
Just over half (59%) worked for small firms (less then 25 employees); 36% worked for companies employing 25-499 staff and only 5% for firms with 500 employees or more.•
Only 11% had responsibility for supervising others (Table A.7).
13
Note: figures are based on the simple survey question “did you agree to take part in an Activity Agreement”, not the more complex and restricted definition of AA participation used in the AA survey analysis.
14
18
Differences in job characteristics according to personal characteristics (gender, age, GCSE achievement) were explored. The only significant difference was that girls were more likely than boys to be working part-time.
2.8 Activities since school
Respondents were asked whether they had undertaken a range of activities at any time since school. Of LAP participants:
•
Nearly all (99%) of respondents had been in paid work and 94% had undertaken some sort of job search activity;•
11% had taken part in voluntary work, and;•
18% had done personal development courses (Table A.8).It was common for participants to have had several jobs since leaving school. Whilst 39% had had only one job since school, a further 34% had had 2 jobs, 18% had had 3 jobs and 8% had had 4 or more jobs. This fits with wider evidence of a considerable churn in labour market participation for those in JWT jobs (Table A.8).
2.9 Comparison with non-participants
Overall, participants showed few striking differences from those in those in the wider “jobs without training” population who did not take part in LAP. Statistically significant differences were found in 3 areas:
•
Gender: participants were more likely than the wider JWT population to be female (46% of participants were female compared to 37% of non-participants). Girls were typically under-represented in the JWT population (that is overall there were more boys than girls in jobs without training), so it is potentially a significant finding that girls were actually more likely than boys to take part in LAP (Table A.1).•
Age: participants were in general younger than the wider population, more likely to be 17 (40% compared to 28% for non-participants) and less likely to be 19 (4% compared to 14%) (Table A.1).The process evaluation and other research found that young people in the JWT group are extremely difficult to track since destination data on the JWT group has been historically poor (Maguire et al 2008). One potential explanation for greater participation in the younger age groups is that was generally easier for Connexions advisers to make contact with those who had left school more recently.•
Apprenticeships: participants were more likely than non-participants to be part of a recognised apprenticeship scheme15.
15
19
2.10 Conclusions
20
3
PARTICIPANTS’ EXPERIENCES OF LAP
3.1 Key Findings
•
At the time of the survey interview, participants were at different stages regarding their process through LAP:-
Most young people interviewed started their Learning Agreement between July 2006 and December 2007.-
65% had left LAP while 34% were still on the programme (1% were unsure of their status). Most of those who had left LAP had done so during 2007. Average duration on the programme was 4 months, with only 12% reporting spending less than 1 month on LAP and 6% more than one year.•
Most common reasons for taking part in LAP were the personal support and advice offered together with the opportunity to combine work and study-
Participants had heard about LAP in different ways – 36% by phone, 35% during a visit to / from Connexions and 23% by letter.-
The most commonly given reasons for taking part in LAP were help with education, training or qualifications (48%), being able to combine work and study (31%) and help finding a job or furthering their career (19%).-
The most commonly mentioned advantages to LAP were the opportunity to gain qualifications and skills (37%) followed by being combine study with a job (27%) and the opportunity to gain more confidence/experience (18%).•
There was only moderate qualification progression under LAP:-
Many LAP participants studied for qualifications that were not at a higher level than those they already held. However, 39% of participants whose highest prior qualification was at Level 1 and 15% of those whose highest prior qualification was at Level 2 did appear to study at a higher qualification level under LAP.•
Not all of those who had left LAP had successfully achieved qualifications:-
26% of respondents had left LAP without doing any studying. This was usually due to problems finding/arranging a course or delay in the course starting.-
16% of respondents had started studying but left LAP before completing a qualification. This was mostly because of problems with the course. (There was also evidence that a variety of personal circumstances may have caused participants to change their plans).-
26% of participants were still studying for their qualification at the time of the research.21
•
Most LAP agreements (82%) covered just one course. Most of these were at Level 2 or lower.-
A wide variety of types of courses were included in LAP - the most common being NVQs (41%). 36% of courses were reported to be Level 1 and 37% were Level 2 (9% were a higher level and for 19% the participant was not sure of the level).-
Most courses took place at a college or training provider. However, 24% were delivered at the participants’ workplaces.-
Courses were typically short (53% lasted less than 6 months).•
For most, contact with Personal Advisers was frequent and appreciated;-
35% had contact by telephone or in a face-to-face meeting at least once a week and a further 45% at least once a month. Those with more frequent contact with their PA were more likely to report that it was “very useful”.•
Employers also played a key role:-
77% of participants reported that their employer was aware of LAP and, of these, 69% reported they felt their employer was supportive.-
Those participants whose employers did not know about LAP or did not offer much support were less likely than those with good support to have completed a qualification.3.2 Introduction
The LAP pilots were designed to encourage young people in jobs without training to undertake nationally accredited learning alongside their job by supporting them in three ways: regular meetings with a Personal Adviser, courses tailored to their needs and interests and (in 2 out of 3 variants) a financial incentive. This chapter describes participants’
experiences of the first 2 of these facets of the LAP, as well as providing a more general picture of their involvement with the scheme. Experiences of receiving LAP payment as a financial incentive are explored in the next chapter.
As illustrated in Chapter 2 and the other strands of the evaluation, young people who
participated in LAP varied considerably in their personal and social characteristics, as well as in their current jobs and other activities. Where possible this chapter explores the extent to which pathways through the LAP programme varied according to the personal characteristics of the participant.
22
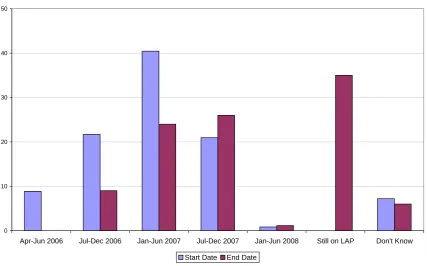
[image:29.595.78.506.268.534.2]3.3 Starting and Ending a Learning Agreement
Figure 3.1 shows the dates at which those interviewed started, and in some cases ended, their participation in LAP:
•
Most young people interviewed had started their Learning Agreement between July 2006 and December 2007.•
At the time of the survey interview, 66% of those interviewed had ended their involvement in LAP, 34% were still on LAP.•
Most of those who had already left their Learning Agreement had done so during 2007 (24% in the first 6 months of the year, 26% in the second half of the year) (Table A.9).Figure 3.1 LAP Start and End Dates
0 10 20 30 40 50
Apr-Jun 2006 Jul-Dec 2006 Jan-Jun 2007 Jul-Dec 2007 Jan-Jun 2008 Still on LAP Don't Know Start Date End Date
Base = All participants (JWT sample): N=493 Source: Table A.9
23
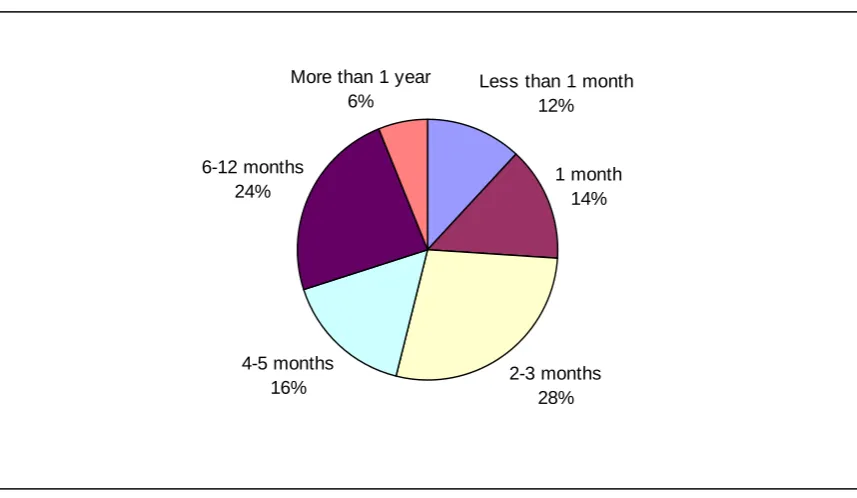
Length of time on LAP
[image:30.595.76.505.180.429.2]Those who had left LAP varied greatly in the time they had spent on LAP. Average duration was 4 months, but 12% of those who had finished reported spending less than 1 month on the programme, whilst 6% reported durations of more than one year. The majority were spread fairly evenly between these extremes (Figure 3.2 and Table A.10).
Figure 3.2 Length of time on LAP (banded)
Less than 1 month 12%
1 month 14%
2-3 months 28% 4-5 months
16% 6-12 months
24%
More than 1 year 6%
Base = All participants (JWT sample) who had finished LAP: N=286 Source: Table A.10
3.4 Deciding to take part in LAP
How first heard of LAP
Findings from the process evaluation suggest that most referrals to LAP came via direct contact between Connexions and the young person. Survey findings support this: 36% of participants had first heard about LAP via a telephone call from Connexions, 26% during a visit to a Connexions office and 9% during a visit by Connexions to their workplace. Just under a quarter (23%) had received a letter. There were no clear differences by variant or area (Table A.11).
Motivations for taking part in LAP
Participants in the main survey were asked why they had decided to take part in LAP. This was an open question and respondents were not given any prompts for answers.
Spontaneous answers were coded to a pre-determined code frame by the interviewer (or editor in the office).
24
The offer of payment appeared to have a marginal effect on decisions to take part,
mentioned by 17% of participants in Variant 1 (bonus payment only) and Variant 2 (bonus and wage compensation) areas.
Participants in the follow-up study were read a list of reasons for taking part and asked whether each had importance in persuading them to take part in LAP. This alternative question design led to higher response across all items (Figure 3.3). The most popular reasons for taking part in LAP appear to relate to the opportunity to study (96%), particularly flexibly (95%) and alongside work (86%). The one-to-one careers/education advice was also valued by 86% (Table A.13).
Interestingly, the chance to change job was important to more participants (78%) than help in the job they were already doing (68%). The overlap between those percentages, however, indicates that many must have responded positively to both options indicating that they hoped LAP would both help in their current job and assist a change of job/career. Bonus payments were factor rated important by the lowest proportion of participants (56% of those in payment areas) (Table A.13).
Follow-up respondents were also asked which of the items was most important in encouraging them to take part in LAP (Figure 3.3). Again, the chance to gain/improve qualifications was the most common reason given for taking part in LAP (Table A.13).
In a separate question, just over half (54%) of follow-up respondents reported that they had already been thinking about studying for a qualification before signing up for LAP. However, of those who gave studying for a qualification as the most important reason for taking part, only just over half (57%) had previously been thinking of taking a qualification. This indicates that LAP may have inspired many participants to re-engage with education/training as well as having providing a vehicle for some of those who already aspired to do so.
Figure 3.3 Motivation to take part (Follow-Up)
Multi-code / Column Percentages
All~
Most important Important in persuading YP to take part
Chance to gain / improve qualifications 96 49
Flexible study 95 9
Chance to study whilst working 86 15
One-to-one careers advice 86 3
Chance to change job 77 11
Help finding course / college 70 3 Helped in job already doing 68 1 Help persuading employer to allow study 67 2
Bonus payments (Payment areas only*) 62 8
Weighted base 142 141
Unweighted base 197 195
Base = All Follow UP Participants (1-3 missing cases, Don’t know) *Unweighted Base = 172
25
3.5 LAP status at time of interview
Participants varied in how much progress they had made on their Learning Agreement at the time of interview:
65% of participants had finished LAP:
•
26% had left LAP without ever doing any studying as part of the scheme.•
39% had undertaken some studying as part of LAP:o 23% had completed a qualification
o 16% had started studying but left LAP before completing a qualification (Table A.14).
34% were still participating in LAP:
•
26% of were currently studying for a qualification•
8% said they were not currently studying: (Table A.14).Taken together these figures suggest that at least two thirds of young people who join the programme do some studying16 on it. The proportion who achieve a qualification will lie somewhere between a third and a half17.
There were no statistically significant differences between the status at time of interview of participants of the different variants and areas.
Reasons for not studying
The findings of the process strand of the LAP evaluation suggest that, for some young people, the experience of LAP may have been negatively affected by a lack of capacity and resources among providers, particularly in their ability to offer the greater degree of flexibility and diversity required to meet their needs (Maguire et al, 2008).
Respondents in the quantitative study who had not successfully studied for a qualification were asked why they had not studied or not completed the course18. Although the numbers are relatively low, the responses do appear to indicate experiences of problems with
provision:
16
The lowest estimate of the proportion studying would be 65%, comprising the 39% who had done some studying before leaving the programme and the 26% who were still studying. The highest estimate of the proportion studying would be the 73%, which would follow if all those who were still on the programme and had not yet studied, ultimately did some study.
17
The lowest estimate of the proportion obtaining a qualification through the programme would be 23%, comprising only those who had already achieved a qualification. This proportion would rise to 49% if all those currently studying also achieved a qualification and to 57% if the group who were on the programme but not currently studying also achieved a qualification.
18
26
•
For 26% of respondents who left LAP without starting a course, the main reasons related to “problems finding or arranging a course” (12%) or the delay in the course starting (8% said they were “waiting for course to start”, 5% said they were “waiting for Connexions to arrange a course”).•
For 16% of respondents who left LAP before finishing qualifications, the most common reason was that they did not enjoy (or there were problems with) the course (29%), followed by either their job ending (10%) or not having enough time to study (10%).•
Of the 8% respondents who were still on LAP but had not yet started studying, more than half were waiting for a course to start or for Connexions to arrange a course (Table A.15).Very few young people reported that problems with their employer or transport problems had prevented them studying. None spontaneously mentioned that lack of money offered had been a factor.However, the level of ‘other’ answers to all 3 questions was relatively high, indicating that there was a variety of other, unknown, personal circumstances that caused participants change their plans (Table A.15).
3.6 Studying for qualifications
Qualifications studied during LAP
Most LAP agreements appeared to have covered just one qualification/course: 82% of LAP participants who studied for qualifications had only undertaken one qualification at the time of interview. 11% said they had taken 2 courses, 5% reported 3 courses and 1% reported 4 separate courses (Table A.16).
There appear to be differences by variant19, with those whose employers were receiving wage compensation more likely to take 2 or more courses. However, most of these participants were in one area (Greater Manchester), so it is not clear whether these differences were caused by the difference in payment regime or by other differences between the individual areas involved, perhaps linked to take-up of courses linked to Apprenticeships (Table A.16).
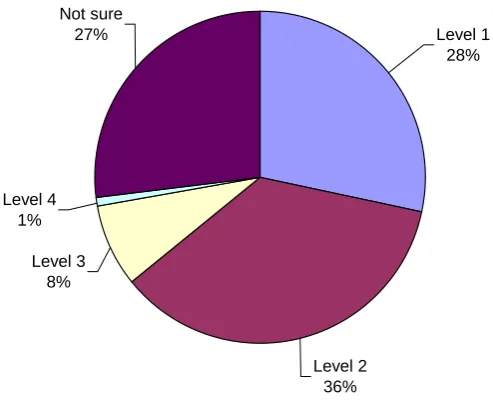
Figure 3.4 shows the highest level of qualification taken by each participant as part of LAP. Where participants knew the level, most courses were reported to be Level 2 or lower (Table A.16). 36% of courses were at Level 2 and 28% were at Level 1.
19
27
Figure 3.4 Level of highest qualification taken as part of LAP
Level 2 36% Level 3
8% Level 4
1%
Not sure
27% Level 1
28%
Base = All participants (JWT sample) who had taken course as part of LAP: N=327 Source: Table A.16
Information was also collected about qualifications that participants held prior to starting LAP. Overall, 45% of participants were at Level 1, 38% were at Level 2, 14% were at Level 3 and 5% gave qualification information which could not be classified. This shows that qualifications studied on LAP were slightly higher on aggregate than the highest qualifications that
participants already held.
When qualifications studied as part of LAP are cross-tabulated with prior qualifications, a picture of moderate qualification progression is revealed (Table A.18).
• 39% of participants with prior Level 1 qualifications who studied on LAP reported studying at a higher level. 35% reported studying another qualification at Level 1.
• Only 15% of participants with prior Level 2 qualifications who studied on LAP reported studying at a higher level. 36% reported studying another Level 2 qualification and 24% a Level 1 qualification.
• None of the minority of participants with prior Level 3, who studied on LAP, reported studying at a higher level. These participants’ LAP qualifications ranged from Levels 1 to 3 and a third were not classified by level.
28
Details of courses taken
A wide variety of courses were studied as part of LAP:
•
41% of courses were NVQs;•
14% were City and Guilds, 4% were BTEC, and 4% GNVQ;•
5% were GCSE, 1% A-Levels and 1% AS-levels (Table A.20). There was considerable variation in the level of course undertaken:•
36% were reported to be Level 1, mostly NVQ’s, City and Guilds, GNVQ or key skills•
37% - Level 2: mostly NVQ, GCSE or City and Guilds•
8% - Level 3: mostly NVQ, A2/AS or ‘other’ courses•
1% - Level 4, degree or higher level courses (Table A.17).For the remaining 19% of courses, participants were not sure of the level (Table A.17).
The Level 1 courses were mostly reported to be NVQ’s, City and Guilds, GNVQ or key skills; Level 2, mostly NVQ, GCSE or City and Guilds; and Level 3, mostly NVQ, A2/AS or ‘other’ courses (Table A.16).
The teaching for most courses took place at a college or training provider, most commonly Further Education Colleges (34% of courses), private training providers (18%) and Sixth Form/City Technology Colleges or schools (8%) (Table A.17).
24% of courses were provided at the participant’s work place (Table A.17). These were mostly NVQ courses (77%).
29
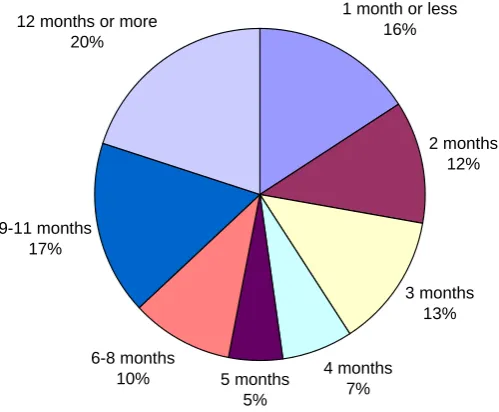
Figure 3.5 Length of course
1 month or less 16%
2 months 12%
3 months 13%
4 months 7% 5 months
5% 6-8 months
10% 9-11 months
17%
12 months or more 20%
Base= All courses taken as part of LAP (N=353) Source: Table A.17
There appear to be considerable differences between areas in types of course provision20. From the quantitative information available from the survey it is difficult to distinguish clear patterns, except that differences appear to occur on an area by area basis, rather than by variant.
Qualification achievement
Survey interviews were conducted at a time when many participants were still engaged with study that was associated with their participation on LAP. Consequently, only about 30% of participants who reported studying for a qualification as part of LAP had completed it by the time of the interview.
Where qualifications were completed, they were generally passed: 89% of course completers achieved their qualification, 7% did not pass and 3% gave an answer which could not be classified.
Among course completers, the level of progression in qualification levels compared with prior qualifications was in line with the findings for all courses studied under LAP. That is, there was a moderate amount of progression with those participants whose highest prior
qualification was at Level 1 being most likely to show progression (Table A.19).
20
30
3.7 Contact with Personal Advisers
The majority (95%) of those interviewed reported that they had been assigned a Personal Adviser21. Overall, of these, over a third (35%) had some contact with their PA, either by telephone or face to face, at least once a week. A further 45% reported contact at least once a month (Table A.21).
There were no significant differences in amount of contact according to gender, age or GCSE achievement.
Both face-to-face and telephone contact occurred regularly, with telephone contact being slightly more frequent (Figures 3.6 and 3.7):
•
18% reported a face-to-face meeting with their adviser at least once a week, with a further 48% reporting contact at least than once a month but less than once a week;•
29% had spoken to their PA on the telephone at least once a week, with another 39% reporting contact at least once a month but less than once a week (Table A.21).Figure 3.6 Face to face meetings with PA
At least once a month
48% Less often
30%
Never met with PA 3%
Don't know 1.0%
At least once a week
18%
Base = All participants (JWT sample): N=481 (24 cases missing – not aware of being assigned PA) Source: Table A.21
21
31
Figure 3.7 Telephone contact with PA
At least once a month
39% Less often
27%
Never 5%
Don't know 0%
At least once a week
29%
Base = All participants (JWT sample): N=493 (24 cases missing - not aware of being assigned PA) Source: Table A.21
32
Figure 3.8 Approximate length of time spent talking to PA at each meeting (Follow-Up Survey)
1.5hrs or more 12%
45 min to 1 hr 35%
30 min 26%
15-20 min 11% Less than 15 min
16%
Base = Follow-Up Survey: all participants (missing 9 cases) (N=190) Source: Table A.22
Follow-up participants were also asked whether their PA had done a range of things during their time on LAP:
•
Most participants had received a full range of support from their PA including completing a Learning Agreement (78%), talking about choice of courses (80%), future careers (84%) or finding place on a suitable course (85%).•
PAs had also provided more general advice (87%) as well as support with study skills (69%).•
70% had received actual help with applying for a course, but only 30% had actually been accompanied by their PA when visiting a college or training provider (Table A.22).•
67% said their PA had spoken to their employer whilst they were on LAP (14% once, 51% more than once).Usefulness of contact
Most participants in the main survey appreciated their contact with a PA: 45% said it was “very useful” and a further 37% “fairly useful” (Table A.19). Respondents to the follow-up survey were generally more positive about their PA with 59% responding that contact had been “very helpful” and 36% “fairly helpful” (Table A.22).
33
compared to only 1% of those with contact less than once a week but more than once a month (Table A.23).
The process and programme theory evaluation demonstrated that LAP advisers had been important in retaining young people on LAP (Maguire et al 2008 and Johnson et al, 2007). However there is no evidence from the quantitative study to suggest that there was a relationship between the amount of contact with a PA reported by the young person and whether they successfully completed a qualification.
Appreciation of the PA’s support by LAP participants was lower than for AA participants, 63% of whom said that it was “very helpful” while a further 28% said that it was “fairly helpful”. However the wider evaluation has demonstrated that the role of the PA on the LAP very different to AA, particularly because LAP participants were in work and often required less intensive support than those on the AA (where 82% of participants met their PA at least once a week).
3.8 Employer Engagement
Three quarters (77%) of LAP participants in the main survey reported that their employer was aware of their involvement in LAP, suggesting that in 23% of cases the participant did not think their employer was aware of LAP. This is higher than official MI figures which indicated that 16% of LAP agreements were not signed by the employer. The difference may be recall (some participants may have forgotten that their employer was aware) or in interpretation (an employer signing the LAP agreement when the participant started the programme is different from the young person believing their employer had an on-going awareness of their
participation in the scheme).
Overall, where respondents said their employer was aware of their involveme