S. NO TITLE
PAGE
NO
1 INTRODUCTION 1
2 AIM AND OBJECTIVES 5
3 REVIEW OF LITERATURE 6
4 MATERIALS AND METHODS 30
5 RESULTS 34
6 DISCUSSION 52
7 SUMMARY 59
8 CONCLUSION 60
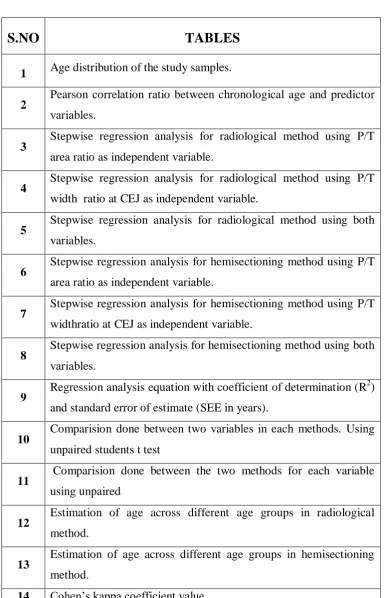
S.NO
TABLES
1 Age distribution of the study samples.
2 Pearson correlation ratio between chronological age and predictor variables.
3
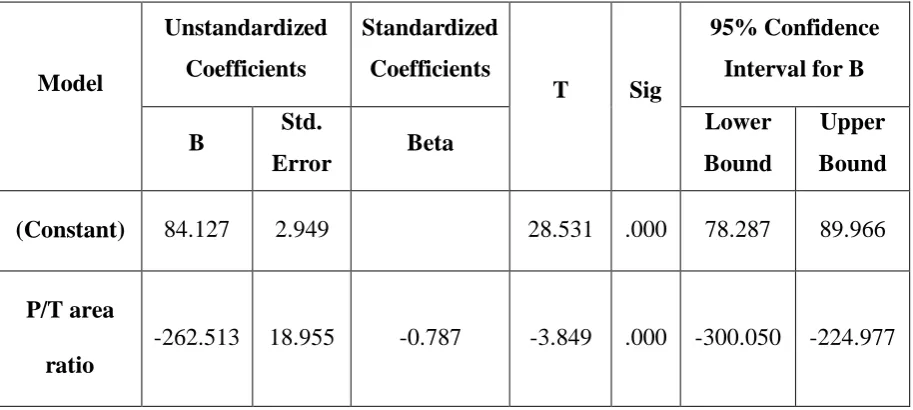
Stepwise regression analysis for radiological method using P/T
area ratio as independent variable.
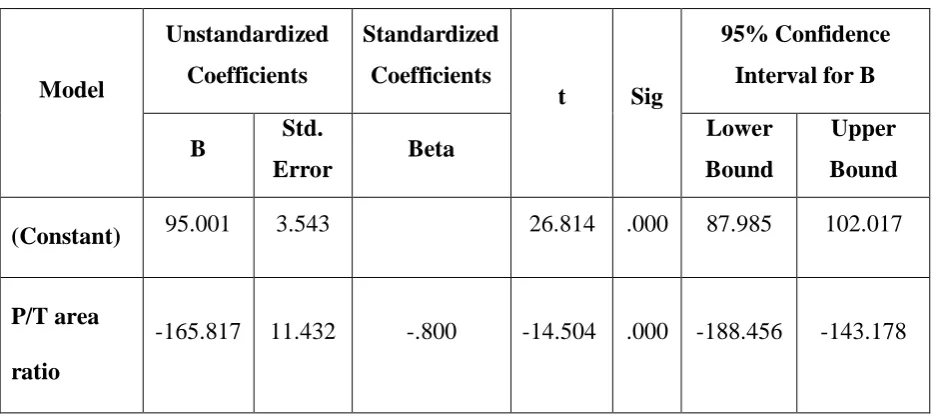
4 Stepwise regression analysis for radiological method using P/T width ratio at CEJ as independent variable.
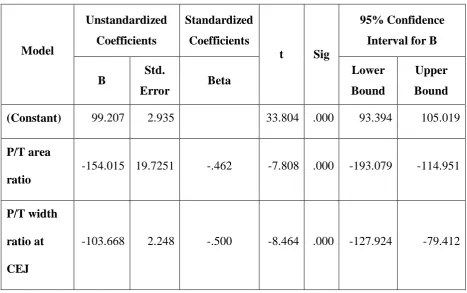
5 Stepwise regression analysis for radiological method using both variables.
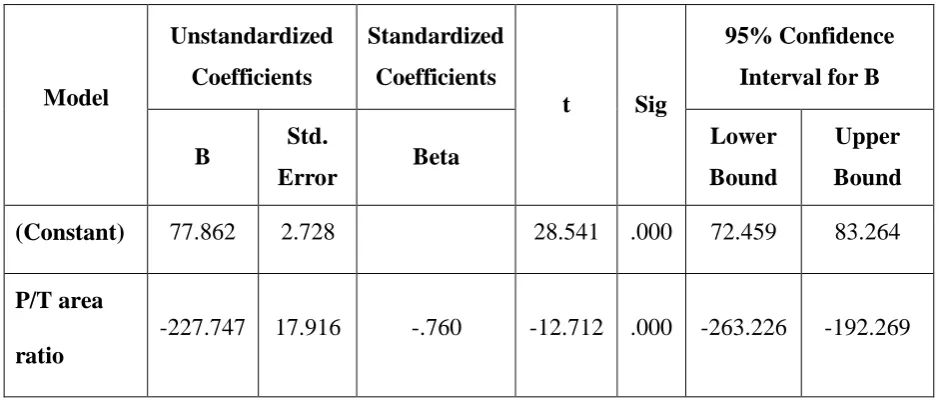
6 Stepwise regression analysis for hemisectioning method using P/T area ratio as independent variable.
7 Stepwise regression analysis for hemisectioning method using P/T widthratio at CEJ as independent variable.
8 Stepwise regression analysis for hemisectioning method using both variables.
9 Regression analysis equation with coefficient of determination (R 2
)
and standard error of estimate (SEE in years).
10 Comparision done between two variables in each methods. Using unpaired students t test
11 Comparision done between the two methods for each variable using unpaired
12 Estimation of age across different age groups in radiological method.
13 Estimation of age across different age groups in hemisectioning method.
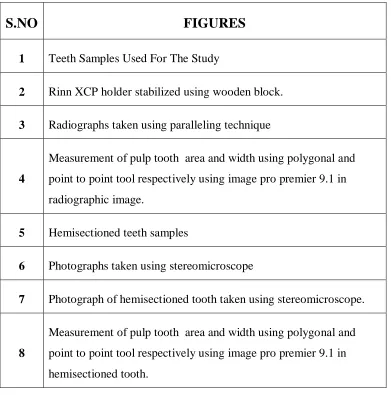
[image:10.595.124.512.97.696.2]S.NO
FIGURES
1 Teeth Samples Used For The Study
2 Rinn XCP holder stabilized using wooden block.
3 Radiographs taken using paralleling technique
4
Measurement of pulp tooth area and width using polygonal and
point to point tool respectively using image pro premier 9.1 in
radiographic image.
5 Hemisectioned teeth samples
6 Photographs taken using stereomicroscope
7 Photograph of hemisectioned tooth taken using stereomicroscope.
8
Measurement of pulp tooth area and width using polygonal and
point to point tool respectively using image pro premier 9.1 in
[image:11.612.113.504.110.505.2]S.NO
GRAPHS
1
Plots of observed age against the predicted age using the regression model for
P/T area ratio.
2 Plots of observed age against the predicted age using the regression model for P/T width ratio at CEJ.
3 Plots of observed age against the predicted age using the regression model for P/T area ratio.
P/ T Pulp/Tooth.
CEJ Cemento Enamel Junction.
SEE Standard Error of Estimate
r Correlation Coefficient
R2 Coefficient of determination
P/R Pulp Root length
P/T Pulp Tooth length
T/R Tooth Root length
RVG Radiovisiography
IOPA Intra Oral Periapical Radiograph
CBCT Cone Beam Computed Tomography
PCTHR Pulp Chamber Crown Coot Trunk height
Ratios
1
INTRODUCTION
The moral and professional responsibility of a dental surgeon to society is not
only to perform in examination, investigation, diagnosis and treatment of diseases in
oral and maxillofacial region, but also to assist in other community services and legal
disputes. A dental surgeon can be an authoritative person in presenting evidence
related to medico-legal identification of a person in interrogation. Forensic
odontology mainly involves the collection, management, interpretation, evaluation,
and presentation of dental evidence for criminal or civil legal proceedings. It is an
interdisciplinary field between forensic medicine and dentistry.1
The word “Forensic” is derived from the Latin word forensis, which means
„before the forum‟. According to Jones, the forum was a public square where trials
and debates took place and consequently served as a court of law. “Odontology”
refers to the study of teeth. Federation Dentaire Internationale (FDI) defines Forensic
odontology as “The branch of dentistry which, in the interest of justice, deals with the
proper handling and examination of dental evidence, and with proper evaluation and
presentation of dental findings”.2
Forensic odontology is the most unexplored and intriguing branch of forensic
sciences. The main purpose of forensic dentistry is to recognize deceased individuals,
for whom other clues of biometric identification (e.g., fingerprints, face, etc.) may not
be accessible. The data collected from morphology of skull, jaws, odontometric
analysis, palatal rugae pattern, DNA analysis of oral and paraoral tissues etc. may
2
crimes, fires, motor vehicle accidents and work place accidents, is mutilated to such
an extent that identification by a family member is neither reliable nor desirable.
Persons who have been deceased for some time prior to discovery and those found in
water also present unpleasant and difficult in visual identifications.4
Physical features like ethnic characteristics which includes both inherited and
acquired characteristics like surgical scars, previous fracture, dental restorations are
prone to change overtime and is not reliable. Dental characteristics are shown to
withstand time and extreme physical conditions offers a reliable method of personal
identification.
The use of dentition for age estimation appears to dated back from the
beginning of the nineteenth century. In 1889, Laccasagne was the first to utilize
changes in the teeth of adults to estimate age. Later, Bodecker, in 1925, pointed out
that few morphological changes in teeth could be related to increasing age.5
Though bones are hard, the enamel of the teeth are the hardest structures in the
body and the fourth hardest structure in the universe by its homogenous content of
calcium apatite crystals. The tooth resist heat, fine chemicals, toxins and microbial
attack, hence damage to tooth is not instantaneous.6
Knowing your age is a basic human right and having it recorded gives identity
to the individual. (UNICEF,1989). If the age can be accurately estimated it will
significantly narrow the field of possible identities that will have to be compared to
the remains in order to establish a positive identification. Hence the importance of age
3
adopted by anthropologists, archaeologists and forensic scientists. Chronological age
is noted from the registration of birth date and it is referred throughout an individual‟s
life.7
In case of living individual such as refugees and adopted children who have no
acceptable identification documents, confirmation of chronological age is required in
order to avail the civil rights and social benefits. Ante mortem age estimation can be
done by processing radiographs of long bones and teeth. Post-mortem age estimation
involves analyzing the remains of bones and teeth directly and also by using
radiographs.8
Age related changes in dentition are divided into three catergories, they are
formative, degenerative and histological. Formative changes are subdivided into four
stages that includes the beginning of mineralization, the completion of the crown, the
eruption of the crown into the oral cavity and completion of the root. Degenerative
changes includes change in color, attrition and periodontal attachment level. They
provide obvious results or changes which help in visualization, visually collecting
data and age estimation. Histological methods needs preparation of teeth structures
for detailed microscopic examination, they are secondary dentin deposition,
cementum apposition and dentin translucency.8
Age estimation in children and adolescents usually depends on the time of
emergence of the tooth in the oral cavity and the tooth calcification, for adults it is
volume assessment of teeth first using Pulp-to-tooth ratio method by Kvaal and
Coronal pulp cavity index and then second method is Development of third molar.
4
proved that dental age relates more closely to chronological age than skeletal, somatic
or sexual maturity indicators.10
Teeth shows many regressive changes with advancing age and various studies
have been done to estimate the age of an individual using these methods. One such
factor is Secondary dentine deposition that have been regarded as a valuable age
factor with advancing age, it is deposited along the wall of the dental pulp chamber
leading to a reduction in the size of the pulp cavity. Estimation of age using secondary
dentine is done qualitatively on ground sections of teeth by employing
Gustafson‟s (0–3) scoring system and quantitatively in the form of micrometric
measurements suggested by Kedici et al.11
Up to now many studies have been available in literature on age estimation
using radiographs including both periapical and orthopantomography. Secondary
dentin deposition have been studied extensively using various parameters in
radiographic method. Dentin deposition was also studied by ground sectioning of the
teeth which may sometimes lead to the breakage of dentin particles during the
procedure. There are however a number of inherent drawback to the use of these
techniques. But there is only single study available in the literature using
hemisectioning method. As there is always a need for a accurate age estimation
technique in forensic odontology, this study was done to compare the radiological and
5
AIM OF THE STUDY
To estimate and compare the age using digital intraoral periapical radiographs
and longitudinal hemi section of tooth.
OBJECTIVES OF THE STUDY
1. To estimate the age by measuring the P/T area ratio and P/T width ratio at CEJ
from digital intra-oral radiograph.
2. To estimate the age by measuring the P/T area ratio and P/T width ratio at CEJ
from longitudinal hemisection section.
6
REVIEW OF LITERATURE
Review of literature is discussed under the following headings:
1. Kvaal‟s method
2. Camerier method
3. Kvaal‟s and camerier method
4. Histological method
5. Cone beam computed tomography method
6. Age estimation using combination of methods
KVAAL’S METHOD
Kvaal’s et al., 1995 found a nondestructive method which could be used to estimate the chronological age of an adult from measurements of the size of the pulp
on full mouth dental radiographs. The radiographs of six types of teeth from each jaw
were measured: maxillary central, lateral incisors and second premolars, and
mandibular lateral incisors, canines and first premolars were taken. To compensate for
differences in magnification and angulation on the radiographs, the following ratios
were calculated: P/R length, P/T length, T/R length and P/R width at three different
levels. He observed that the coefficient of determination (R2) for the estimation was
strongest when the ratios of all the six teeth were included (R2 = 0.76) and weakest
when measurements from the mandibular canines alone were include (R2= 0.56). He
also concluded that the width ratio for all teeth, except the maxillary central incisors,
is found to have a stronger correlation with age than the length ratio.12
7
than did the computer-assisted measurements. Lengths and widths of tooth and pulp
were measured both manually and with computer assistance on periapical radiographs
from six teeth in 40 patient. They concluded that a software program with automatic
tracing ability could minimize bias in film density and observer which in the future
could produce an objective approach for age estimation based on dental morphology
as viewed in radiographs.13
Bosman et al., 2004 gave the idea that there is no significant difference on applying the regression formula from kvaal‟s original technique on standard
long-cone periapical radiographs on data obtained from OPGs. Especially, in those
conditions where either all six teeth or all three mandibular teeth participated in the
age calculation no significant difference was found between the real age of the
individual and the calculated age based on the orthopantomograph. He also detailed
that the SEE values from original technique and OPG were relatively comparable.14
Paewinsky et al., 2005 suggested that the P/T width at CEJ correlated best with age in all six teeth except for the mandibular first premolars where the best
correlation was found at level B (mid root level ). The width ratios of the pulp cavity
showed significant correlation to the chronological age and the coefficient of
determination (R2) was highest in the upper lateral incisors (R2=0.913) when an
exponential or a logistic regression model, was constructed. At the same distance with
a linear regression model the coefficient of determination (R2) reached 0.839. The
coefficients of determination varied depending on the regression model used and the
best correlations were obtained from the exponential and the logistic function. The
highest combined linear correlation coefficient was also observed in the maxillary
8
ratios from all teeth were combined, a linear correlation coefficient r = -0.95 with a
standard deviation of 5.6 years could be determined.15
Meinl et al., 2006 reported that there is underestimation of age with Kvaal‟s formula and overestimation of age with Paewinsky formula when he substituted the
values from OPGs of 44 Austrian individuals aged between 13 and 24 years in their
equations. From the results of this study, it can be concluded that the regression
equations reported in Paewinsky and Kvaal cannot be applied to a young sample
(13.03–24.61 years). Kvaal‟s formula showed mean underestimation of 31.44 years
when applied for single teeth, 38.21 years if done for three maxillary teeth. The use
of the formula for three mandibular teeth led to a mean underestimation of 47.10
years, with all six teeth from both jaws the calculation resulted in a mean
underestimation of 46.04 years. The use of these formulas led to age estimations that
are far away from the real chronological age.16
Landa et al., 2008 showed that the method reported by Kvaal et al., cannot be applied to direct digital OPGs as the values analyzed on digital images were so
distant from the real ages. He used OPGs of 100 patients aged between 14 and 60
years from a private radiology department in Bilbao. They found difficulty in
identifying the reference points in the image when viewed directly on the monitor.
The reproducibility of the kvaal‟s method in OPG showed very low correlation
between the parameters measured and real age. He reported that this method must be
discouraged as being a reliable one to estimate age on a direct digital OPG samples.17
Sharma et al., 2010 aimed at evaluating the feasibility of the kvaal‟s technique in Indian population using digital long-cone intraoral periapical radiographs
9
Kvaal‟s. They concluded that the coefficient of determination (R2
) was the strongest
(0.198) for the mandibular first premolar and lowest when lower 3 teeth were used
together indicating that age can be estimated better with lower premolars. No
significant difference was observed between the estimated age and the actual age for
all (P>0.05) except in mandibular lateral incisor and maxillary lateral incisor, where a
significant difference was observed.18
Mala et al., 2012 studied the application of Kvaal‟s technique in digital Panoramic radiograph using 6 teeth, 3 maxillary and 3 mandibular teeth. He found out
that upper second premolar tooth acts as a good predictor of age, when taking “M”
(mean of all ratio‟s) and “W-L” (the difference between the mean of 2 width ratios
and the mean of 2 length ratios) as the first and second predictors respectively. They
also observed that the coefficient of determination R2 was higher (0.076) in upper
three teeth taken together compared to lower three teeth (0.049). In upper teeth “M”
was found to be a significant predictor whereas in lower teeth, “W-L” was found to be
the significant predictor.19
Talreja et al., 2012 analyzed the sample of 100 digital radiographs in Indian population and aimed at evaluating the versatility of Kvaal‟s technique. They reported
that Kvaal‟s age estimation formulae produced vast age estimation errors in the Indian
sample. They stated that a number of factors may be contributing to the large errors,
including sample composition of the original study, differences in methodology,
observer differences and most probably the variation in the rate of secondary dentinal
deposition in the Indian sample owed to environmental and genetic effects. The
India-specific age estimation equations reduced the error rates (in terms of SEE), with
10
method. They also observed that the errors were still relatively large and higher than
those obtained in European samples. Therefore, the variables used herein did not
account for much of the variation, probably because the rate of secondary dentine
deposition in Indians is not regular as age progresses. These reasons may preclude the
routine use of this method in the estimation of Indian adult type.20
Erbudak et al., 2012 tested Kvaal‟s et al., technique of age estimation methods on Turkish individuals. The correlation between chronological and estimated
ages was examined and the feasibility of length and width measurements of pulp
cavity was evaluated for age estimation. Age was calculated using the linear
regression models presented by Kvaal et al., and Paewinsky et al. He concluded that
there was high differences on observing the values between chronological and
estimated ages. Measurement ratios showed no significant or weak correlation with
age. The linear regression models were derived using variables that were significantly
correlated with age. The determination coefficients of the models varied from 0.035 to
0.345. In conclusion, a difference of more than 12 years in the chronological and
estimated ages derived using regression models in literature was found on panoramic
radiographs of Turkish individuals. The length and width of the pulp cavity, measured
according to the method of Kvaal et al., using panoramic radiographs, were
insufficient to precisely estimate the age of Turkish individuals.21
Agarwal et al., 2012 proved maxillary central incisor to be a significant indicator for measuring chronological age. The study was done in 50 subjects
between 20-70 years of age using IOPA‟s and measurements made were for lengths
of tooth, pulp, root and width of root and pulp at three different points. Linear
11
calculated. He found that P/T width at A (CEJ ) and B (Midpoint between CEJ and
midroot) showed minimal SD with age. Maximum difference was seen for root length
variable (-1.035 ± 1.86 years), no statistically significant difference was found
between the estimated age and the actual chronological age the P value was >0.05,
indicating significantly positive result.22
Limdiwala et al., 2013 determined that kvaal‟s criteria showed the accurate and precise measurements of age with the difference of 8.3 years which is within the
acceptable limit. They included 150 radiographs with 100 in group A, without any
pathology were selected based on kvaal‟s selection criteria and 50 in group B those
radiographs were not according to the criteria (Non-ideal radiographs with caries,
dental fillings, crowns and periapical pathology). Same set of teeth and parameters
were applied to all the 150 OPG as originally designed by Kvaal‟s. Kvaal‟s criteria of
selecting the radiographs showed a better correlation with age than the radiographs
selecting without the criteria.23
Patil et al., 2014 intended at evaluating the accuracy of age estimation formula of Kvaal‟s and coauthors developed for Norwegian population in Indian
samples. Digitalized IOPA of maxillary central incisors from 100 samples between
the age group of 20 and 50 years were chosen for the study. Modified Kvaal‟s
formula, Age = 33.5 -18.6 (M) -3.49 (W - L) was developed and applied to sample
Indian population. Standard error of estimated age by modified Kvaal‟s formula (±6.5
years) was less when compared to standard error of estimated age of Kvaal and
coauthors formula in Norwegian population (±9.5 years). Formula which was derived
from Norwegian population (Caucasian) is not applicable to other population.
12
Rajpal et al., 2016 reported that Kvaal‟s method is a reliable method to estimate age in both younger and older populations. With a few modifications of
Kvaal‟s method, we could estimate age with a SEE of ± 6.4-7.8 years in a sample of
the Indian population. He concluded that the ratios X1, X2, and X3, width
measurements are good indicators of age, while X4 length measurements is not
correlated with age estimation in above population. He conveyed that the X1 showed
the strongest correlation compared to the width ratios as depicted in the study
conducted by Kvaal‟s et al.25
Mittal et al., 2016 aimed at testing the validity of regression equations as given by Kvaal et al., in OPG of Indian samples beyond 25 years of age. He indicated
that the width ratios were better correlated than length ratios and “M” (mean value of
all ratios) and “W ~ L” (difference between “W” and “L”) were the best predictors for
age estimation. Age could be estimated with greater accuracy by taking three
mandibular teeth together followed by mandibular first premolar and maxillary
second premolar. The least accuracy was shown by the mandibular lateral incisor
taken individually. He also concluded that the applicability of Kvaal‟s equation was
invalid in the study population. The results of the study give inference for the
feasibility of this technique by calculation of regression equations on digital
panoramic radiographs. However, it negates the applicability of same regression
equations as given by Kvaal et al., on the study population. The results of the study
give an inference for the feasibility of this technique by calculation of regression
equations on digital panoramic radiographs. However, it negates the applicability of
13 CAMERIER METHOD
Camerier et al., 2004 studied OPGs collected from the sample of 312 Italian white Caucasian patients (135 men, 177 women) aged between 14 and 24 years. He
aimed at assessing adult age based on the relationship between age and measurement
of the P/T area ratio on second molar teeth and also to improve the precision and
reliability of age estimations. They also considered the gender and the maturation
stages of third molar teeth. These results were exploited to establish a threshold value
to assign an individual to juvenile or adult age. A cut-off value of RA = 0.088 was
applied if Tm = 0 and RA = 0.097 if Tm = 1. The sensitivity of this test was 91% and
its specificity was 94.5%. The proportion of individuals with correct classifications
was 92%.27
Camerier et al., 2006 showed that P/T ratio of upper canine teeth can also be used in determining age at death in skeletal remains for the first time. Age estimation
was very precise in eight mummies aged less than 72 years. He concluded that this
method can be used to provide age estimation of old subjects who died over 50 years,
with great reliability.28
Camerier et al., 2007 conducted an in vitro study on 57 male and 43 female skeletons of Caucasian origin, aged between 20 and 79 years where a total of 200
X-rays were analyzed to test the accuracy of age evaluation by combined analysis of
labio-lingual and mesial peri-apical X-rays of lower and upper canines. The results
obtained with single canines were similar to those obtained with labio-lingual X-rays.
Instead, age-at-death estimates obtained with the P/T area ratio on both canines and
both labio-lingual and mesial projections were significantly better than those
labio-14
lingual X-rays. If only one canine is available, the small difference between the
estimates according to labio-lingual X-rays, and both types of X-rays mean that only
the labio-lingual projection is required. This model showed a high degree of accuracy
with the mean prediction error of just 2.8 years.29
Camerier et al., 2007 assembled a total of 200 peri-apical X-rays of upper and lower canines from 57 male and 43 female skeletons of Caucasian origin, aged
between 20 and 79 years. For each skeleton, dental maturity was evaluated by
measuring the P/T area ratio on upper and lower canines. These two variables
explained 92.5% of variations in estimated chronological age and the residual
standard error was 4.06 years. Better results were obtained when using both the
canines than those obtained using only one canine.30
Camerier et al., 2009 applied the P/T area ratio of upper and lower canines using peri-apical X-ray images as an age indicator in a Portuguese samples and
compared it with Italian samples done in previous studies. Comparisons between the
equation referring to the Portuguese sample and the equivalent linear equations
proposed by Cameriere et al., for the Italian sample did not reveal significant
differences between the linear models, suggesting that a common regression model
could be applied for both samples.31
Singaraju et al., 2009 assessed the chronological age based on the relationship between age and measurement of the P/T area ratio on right maxillary
canine, using 200 orthopantomographs between the age group of 18 and 72 years .
Sample was distributed into three different age groups 18-30, 31 – 50, 51- 70 years.
The observed correlation coefficients „r‟ were 0.89, 0.97, and 0.96. Student‟s t test
15
Also estimated age and chronological age showed that the two variables are linearly
related to each other with correlation coefficient 0.99. He confirmed the fact that
width of pulp is a better indicator of the age and also found that the gender had no
significant influence on age.8
Babshet et al., 2010 conducted a study to test one of camerier formulas on an Indian sample and ascertain whether the original formula predicted age accurately or
if population-specific equation improved age assessment. Intraoral periapical digital
radiographs of mandibular canines were obtained from 143 individuals (aged 20–70
years). The Indian formula derived (age = 64.413 (195.265 PTR), mandibular canines
gave sub-optimal prediction in Indians and inferior results compared to the camerier‟s
formula . Although the Indian formula showed no recognisable improvement in age
assessment, it is recommended that the population-specific equation be used since this
produces more „stable‟ age estimates as it takes into account the low correlation
between secondary dentine deposition and age in Indians. An approach to enhance
age prediction may be to use multiple teeth and future studies could include additional
teeth, e.g. mandibular lateral incisor and premolars, and develop multiple regression
models.32
Luca et al., 2010 applied Cameriere‟s method on a large sample of historical subjects from several cemeteries in Spain and Italy. Age estimations of canines were
compared with the mean ranges of age obtained from other commonly applied
anthropological methods such as tooth wear changes in the pubic symphysis or the
metamorphosis of the auricular surface of the ilium. Tests on these Middle Aged
16
reliable tool in determining age at death in skeletal remains of archaeological
context.33
Zaher et al., 2010 used 144 periapical radiographs of maxillary (central & lateral) incisors (both sexes) aged 12 to 60 in Egyptians population. He concluded
that P/T area ratios of incisors are reliable for estimation of age among Egyptians in
forensic work. Results showed a correlation r ¼ 0.23 & P ¼ 0.006 for maxillary
central incisors and r ¼ 0.2 & P ¼ 0.05 for maxillary lateral incisors.34
Babshet et al., 2011 evaluated the P/T area ratio of three mandibular teeth and revealed that the lateral incisor had the highest correlation to age when used
alone followed by the first premolar and canine. The use of these teeth in various
combinations did not result in recognizably higher correlation. They also stated that
there were little practical differences in the accuracy of age estimates irrespective of
whether single or multiple teeth were used, with S.E.E.s ranging between 12.1 and
13.1 years. He explained that these high errors are in contrast to previous studies and
may be explained on account of the low-to moderate age correlation of PTR in our
Indian sample, as well as evaluation of a living subjects in the present study.35
Jeevan et al., 2011 confirms that upper canines seem to be the ideal candidates for age estimation using the AR method in both deceased and living
subjects. The present study also demonstrated that this method gives a more stable age
estimate in younger age‟s up to 45 years. They studied 456 canines in an Indian
sample using radiovisiography technique. Linear regression equations were derived
for upper canine, lower canine and both using the AR to estimate chronological age.
Upper canine equations gave the precise results with mean error ranging from 4.28
17
Camerier et al., 2011 examined the relationship between age and age-related changes in the P/T area ratio in monoradicular teeth with the exception of canines by
orthopantomography. A total of 606 OPGs of Spanish white Caucasian patients (289
women and 317 men) aged between 18 and 75 years from Bilbao
and Granada (Spain) were analysed. Regression analysis of age of monoradicular
teeth indicated that the lower premolars were closely correlated with age. An
ANCOVA did not show significant differences between men and women. Multiple
regression analysis, with age as dependent variable and P/T area ratio as predictor,
yielded several formulae. R2 ranged from 0.69 to 0.75 for a single lower premolar
tooth and from 0.79 to 0.86 for multiple lower premolar teeth. Depending on the
available number of premolar teeth, the mean of the absolute values of residual
standard error, at 95% confidence interval, ranged between 4.34 and 6.02 years,
showing that the P/T area ratio is a useful variable for assessing age with reasonable
accuracy.37
Camerier et al., 2013 analysed apposition of secondary dentine deposition since 2004 and have published many papers on it. He studied upper and lower incisors
to examine the application of P/T area ratio as an indicator of age. The samples of 116
individuals, 62 men and 54 women, aged between 18 and 74 years were studied. The
results demonstrated that the variability in age explained by the P/T area ratio in
incisors was affected by sex and also more accurate estimations were obtained by
analysing upper lateral incisors. Lower laterals showed (R2 ¼ 0.513), a standard
estimate error of 10.9 years while upper incisors showed 6.64 years. These results
showed that, although incisors are less reliable than canines or lower premolars, they
18
Joseph et al., 2013 measured pulp to tooth area mandibular premolars using the radiovisuographic images (RVG‟s) from 120 subjects and derived the regression
formula Age = 89.778-379.020 (AR) with a mean absolute error (MAE) of 5.38
years, specific for South Indian population and concluded that this method of age
estimation provided a fairly accurate and reliable results.39
Camerier et al., 2014 proposed a segmentation algorithm for use with peri-apical x-ray images of canines, using Matlab code for the automatic evaluation of the
ratio of tooth and pulp areas, to assess age using Cameriere's formula. He found out
that these preliminary results are consistent with those obtained by a skilled operator,
and yet demand considerably less time. The advantage of using this algorithm is that
reproducibility of the result.40
Afify et al., 2014 evaluated the P/T area ratio of three mandibular teeth revealing that the 2nd premolar (r = -0.947) had the highest correlation to age when
used alone, followed by the canine (r = -0.941).and 1st premolar (r =-0.914) The use
of these teeth in combinations slightly increases the correlation. The standard errors of
estimates (SEE) of the regression analyses for the individual tooth and teeth
combinations were found to be ranged from ± 4.10 to 5.66 years. Standard errors of
estimates and little difference in SEEs (± 4.10 to 5.66 years) between the various
linear and multiple regression equations were suitable for forensic application among
Egyptian population.41
Azevedo et al., 2014 developed a specific formula to estimate age in a Brazilian adult population and compared the original formula of Camerier to this
Brazilian formula. He measured P/T area from canines and showed Brazilian formula
19
in the periapical radiographs of the group aged 20-29 years and in the elderly groups
(60-69 and 70-79 years). The best results were found in the groups aged 30-39, 40-49,
and 50-59 years.42
Kumar et al., 2016 measured P/T ratio from second molars of 400 digitised IOPA and observed that there was high differences between estimated and
chronological age of 12 years which was not in acceptable range. They also showed
that gender have an effect on the morphological variable.43
Basoya et al., 2016 aimed to compare the accuracy of age prediction in three computer- aided softwares like Adobe Photoshop , Auto CAD and image J in
periapical radiographs of maxillary central incisors taken using (RVG). There was
no statistical significant difference in age calculated by Adobe Photoshop p= 0.432
and Auto CAD p= 0.004; though there was significant statistical difference in age
calculated by Image J, p<0.001. It was concluded that P/T area ratios of maxillary
central incisor are reliable for estimation of age and AutoCAD gave the most accurate
results.44
KVAAL’S AND CAMERIER METHOD
Camerier et al., 2004 measured P/T area and Kvaal‟s measurements of length and width of P/T ratio in 100 maxillary right canine of Caucasian patients
using digitized OPG of age between 18 to 72 years. He found out that P/T area
correlated best with age (R2 = 0.85) followed by P/R width at mid-root level. Width
is a better indicator of age than length was also reported. The variable p ( P/R ratio)
had very poor correlation with age and was therefore excluded from further statistical
20
the AR and c variables explained 84.9% (R2 = 0.849). The gender did not influence
the regression model used to estimate chronological age. It can be concluded that the
RIC technique can produce reliable and reproducible intra-observer measurements.45
Juneja et al., 2014 studied on Karnataka population using maxillary canines 200 OPG with age between 18-72 years. He measured variables p, r, a , b, c and AR
in all the OPGs. All morphological variables were statistically analyzed and found
that area AR (r = -0.974) and P/T width (b) yielded significantly to the fit. The ratios
between length measurements correlated worst with age among them the variable „r‟
(P value 0.140) in particular had poor correlation. They derived a regression formula
Age = 87.305-480.455(AR ) + 48.108 (b) with the 2 variables. This formula showed
a SEE of 3.0186 years, 96% of total variance (R2 = 0.960) with the median of the
residuals (observed age minus predicted age) of 0.1614 years. There was no
signifcant difference between chronological and estimated age for any of the age
groups (P value > 0.05) thus signifying that the derived formula is appropriate for all
the selected age groups.46
HISTOLOGICAL METHOD
Debta et al., 2010 stated that measuring amount of secondary dentin seems to be reliable and rapid method in forensic odontology. They evaluated the change in
pulp width at the level of CEJ and its correlation to different age groups. Ground
section of 100 extracted maxillary first premolars were done up to the midpulpal area
in labiolingual plane. The correlation of different age group with reduction in ratio of
score of pulp width (SPC) and score of tooth width (STC ) at CEJ was found . All
21
Leica Qwin software. Pearson correlation between SPC/STC ratio with different age
group was found to be statistically significant.47
Bhaskar et al., 2013 aimed to measure the deposition of the secondary dentin deposition in dried ground sections of teeth and correlate this with the known age of
the individual. They found that mean calculated age was slightly higher than actual
age but this difference was not significant. They used 200 single and double rooted
teeth. Cases for the study were divided into different age groups and maximum
number of cases in the study belonged to age group of 25 to 30 years, next being 35 to
40 years.48
Metzger et al., 1980 has made a slight modification in the criteria for using ground sections for age estimation using Gustafson's method . Out of six parameters
two of these changes, transparency of radicular dentin and secondary dentin, have the
highest correlation with age. The evaluation of these parameters only from thin
(0.25-mm) ground sections may lead to an artificially high "secondary dentin value." These
artifacts may be caused by the attempt to include the whole pulp chamber and root
canal in a 0.25-mm-thick ground section and by an accidental overgrinding of the
apical area of the root, respectively. A modification of the data-collecting method is
suggested to make possible the use of thick (1.0-mm) ground sections for the
evaluation of most of the aging criteria, thereby eliminating the possible inaccuracies
in the preparation and evaluation of the thin (0.25-mm) ground sections.49
Shrigiriwar et al., 2013 applied six parameters of Gustafson like attrition, periodontosis, secondary dentin deposition, root translucency, cementum apposition
22
16.03 from which age was estimated. The average age difference between known and
estimated age in this study was found to be ± 4.43 years.50
Solheim 1992 estimated the amount of secondary dentin in a tooth according to various scoring systems, and the Pearson correlation coefficient with age has been
found to be approximately 0.6. He used 1000 teeth, with exclusion of molars. The
teeth were prepared according to the half tooth technique. In addition, the area of the
coronal pulp and the widths of the root and pulp chamber were measured in a
stereomicroscope at the CEJ and at three other defined points along the root. The
Pearson correlation coefficient between age and secondary dentin varied in different
types of teeth. Of the scoring systems, scores according to Johanson were most
strongly correlated with age (r = 0.59 to 0.74). Correlation between age and the
coronal pulp area varied from -0.47 to -0.72, and the range between age and ratio
between pulp- and tooth width at the CEJ was from -0.46 to -0.77. Correlations
between age and ratio between sum of pulp widths and the sum of tooth widths for all
four such measurements ranged from -0.58 to -0.81. Multiple regression analyses
showed that by combining several types of measurements, the correlation with age
was increased. A tendency was also observed towards reduced speed of secondary
dentin formation in the elderly and in women.51
Bajpai et al., 2016 applied Gustafson‟s formula to 228 teeth. The results showed strong correlation (0.92; p<0.001) between chronological and estimated age
by using both formulae. We found the mean error of ± 5.47 by using newly derived
and formula and ± 6.35 by Gustafson's formula. As a result of our study it was found
23
formula in Indian population. A positive correlation between age and total scores of
physiological changes also revealed.52
Singh et al., 2014 aimed to evaluate the results and to check the reliability of modified Gustafson‟s method for determing age. Degree of attrition, root
translucency, secondary dentin deposition, cementum apposition, and root resorption
were measured. A linear regression formula was obtained using different statistical
equations in a sample of 70 patients. The mean sage difference was this ±2.64 years
and was statistically significant.5
CONE BEAM COMPUTED TOMOGRAPHY METHOD
Star et al., 2010 determined to evaluate a human dental age estimation method based on the ratio between the volume of the pulp and the volume of its
corresponding tooth calculated on clinically taken cone beam computed tomography
(CBCT) images from monoradicular teeth. On the 3D images of 111 clinically
obtained CBCT images of 57 female and 54 male patients ranging in age between 10
and 65 years the pulp–tooth volume ratio of 64 incisors, 32 canines, and 15 premolars
was calculated with Simplant Pro software. A linear regression model was fit with age
as dependent variable and ratio as predictor, allowing for interactions of specific
gender or tooth type. The obtained pulp–tooth volume ratios were the strongest
related to age on incisors.53
Maret et al., 2011 have stated that using CBCT , quantitative volumetric measurement of various parts of each tooth can be useful to determine significant
variables for dental age estimation in living subjects and multiple regression analysis
24
data can be helpful to study other aspects of dental morphology in greater depth,
especially dental growth. He also included in this hypothesis that CBCT needs
integration with a larger network system. Quantitative measurements include the
volume of each component of all teeth, especially enamel, dentin, pulp cavity, crown
and root, and ratios of these different parts. Quantitative measurements of the alveolar
bone and surrounding cortical bone could also be included in the analysis as, in
combination with other variables, these measurements could contribute interesting
information that would help to estimate the age of a living subject. The accuracy of
age estimation equations for each tooth would be assessed using the coefficient of
determination (R2).54
Jagannathan et al., 2011 stated that computed tomography can be used to measure P/T ratio volumes and is a useful indicator of age. Volumetric reconstruction
of scanned images of mandibular canines from 140 individuals (aged 10 - 70 years)
was used and he tested his method in 48 samples and showed that mean absolute
errors of 8.54 years in Indian samples.55
Porto et al., 2015 studied the the usefulness of some morphometric parameters of the teeth in 5 different age groups through images of Cone Beam CT.
118 upper central incisors clinically acquired of 60 women and 58 men aged between
22 and 70 years were selected. The pulp cavity volume and the pulp cavity/tooth
volume ratio showed significant differences between age groups (p < 0.001). Linear
regression analysis showed a coefficient of determination of 0.21 which suggests that
there is a weak correlation between the pulp cavity/tooth volume ratio and age.56
25
reliable indicator of age of adults and CBCT is an easy and conservative approach that
allows accurate calculation of tooth volumes. This method also shows the inter –
examiner agreement of ICC 0.99 and stated that is is reproducible. Highest accuracy
was seen between age group 30 to 59 years.57
Penaloza et al., 2016 aimed at applying Kvaal‟s et al., method on CBCT images from a malaysian population.. Sample consisted of 55 males and 46 females,
with a median age of 31 years. Sagittal and coronal views of the teeth were obtained,
Kvaal‟s P/T area ratio was calculated in both buccolingual and mesiodistal aspects for
each tooth. The SEE of ± 10.58 years from a combination of measurements.
Mesiodistal measurements of central incisor at CEJ showed SEE of ± 12.84 years. He
concluded that the original technique of using radiographs was more accurate than
using CBCT and also it is time consuming.58
Arpita Rai et al., 2016 estimated age based on P/T ratio of the maxillary canines and measured in three planes obtained from CBCT image data. He included
sixty subjects aged 20–85 years in the study and assessed each tooth for mid-sagittal
section ,mid-coronal section and three axial sections cementoenamel junction (CEJ),
one-fourth root level from CEJ, and mid-root. He concluded that PTR in axial plane
at CEJ had significant age correlation (r = 0.32; P < 0.05) and this is probably
because of clearer demarcation of P/T outline at this level.59
Penaloza et al., 2016 aimed to test the variability of the volume measurements using three different segmentation methods in pulp volume reconstruction with a
sample of 21 dental CBCT,s from upper canine and first molars. The reported mean
absolute error using automatic segmentation of the first molar‟s pulp chamber is 6.26
26
of ± 11.45 years and manual segmentation of P/T, has a prediction interval of ± 12
years it is possible to observe that the use of CBCT and dental structures volume
reconstruction, do not improve the final results for adult age estimation when
compared to kvaal‟s method and camerier method in radiographs.60
Alsoleihat et al., 2017 concluded that MD pulp-to-tooth ratio taken at the neck of lower molar is not a reliable predictor of chronological age in adults, possibly
due to the large variation in the timing of development. The coefficients of
determination (R squared= 13.0 %) for the regression equation is very low and means
that only 13 % of the variation image can be explained by the MD pulp-to-tooth ratio
taken at the neck of the tooth.61
Biuki et al., 2017 evaluated the correlation between chronological age and pulp to tooth volume ratios in anterior teeth with the use of the CBCT technique and
to determine a regression model to estimate human age. They found out that pulp to
tooth volume ratios had a stronger correlation in males than females and also of all
the anterior teeth they found out that maxillary central incisor and canines had a better
correlation. The results of the present study showed that it is advisable to use the
mean of all the ratios of anterior teeth in forensics to estimate age.62
AGE ESTIMATION USING PULP AREA
Ravindra et al., 2015 analysed total pulp area in maxillary central incisor involving 308 subjects of both genders with the age range of 9-68 years. He
concluded that the right maxillary central males (32.50, 32.87 mm2) had more pulp
area when compared with females (28.82, 30.05 mm). The mean pulp size on the right
27
found to be significant (t = -2.549, P = 0.011). Pearson correlation „r‟ for males was -
0.588 which was significant for apical, middle, coronal and total area with „P‟ value
of 0.01. Moreover same was seen with females (r = -0.452).63
Indira et al., 2015 showed that a gradual reduction in pulp size was observed with respect to the total pulp length and cervical pulp width with an increase
in age and this showed a significant correlation with the chronological age. The
correlation between total pulp length and age was r value was -0.241 at P = 0.016 and
cervical pulp width with age was -0.392 at P < 0.0001. He analysed in Intraoral
periapical radiographs taken using paralleling cone technique involving 100 subjects
inclusive of both the genders aged between 16 and 50 years.64
AGE ESTIMATION USING COMBINATION OF METHODS
Ajmal et al., 2001 determined age using three methods namely, Johanson method, Kashyap and KoteswarRao method and Average stage of attrition method
(ASA). They included 100 patients from the age range of 21-60 years. ASA method
was found to be the best method. When range of errors was compared ASA method is
found to be more reliable than kashyap method which showed incorrect results.65
Ubelaker et al., 2008 estimated adult age using three different methods such as Bang and Ramm, Lamendin and Prince and Ubelaker. They used 100 intact single
rooted teeth and observed root translucency, root length and the extent of
periodontosis. Of the three methods the prince and Ubelaker method offered most
accurate results. A new regression equation, specifically for Peruvian samples has
28
Dumpala et al., 2013 aimed to compare the age estimated using OPGs and hand wrist radiographs with the chronological age of the patients. Dental age was
calculated using P/T area ratio of right mandibular canine in digital
orthopantamographs (OPGs) in 30 patients and had a better correlation with
chronological age when compared with the skeletal age using Bjork Grave and Brown
method. Comparision between chronological and dental age indicates that there was
no significant differance (0.65) and with skeletal age there was a significant
difference (0.04).67
Khorate et al., 2013 estimated age based on tooth development. The panoramic radiographs of 500 healthy Goan, Indian children (250 boys and 250 girls)
aged between 4 and 22.1 years were selected. Modified Demirjian‟s method
(1973/2004).Acharya AB formula (2011), DrAjit D. Dinkar (1984) regression
equation, Foti and coworkers (2003) formula (clinical and radiological) were applied
for estimation of age. The result of our study has shown that DrAjit D. Dinkar method
is more accurate followed by Acharya Indian-specific formula.68
Shrestha et al., 2014 Age estimation in this study was done by two established radiological methods like (Tooth Coronal index (TCI) and Kvaal‟s
method) and two histological techniques (Kashyaps and Koteswara modifcation of
Gustafson‟s method and secondary dentine method). TCI method was found to be the
best radiologic and secondary dentin estimation was found to be the best histological
techniques. Morphological parameters such as attrition, histological parameters such
as secondary dentin, root transparency and cementum apposition were assessed from
ground sections. In the Kvaals method only the pulp width at the CEJ parameter was
29
Bajpai et al., 2015 evaluated age using three different factors like Secondary dentin deposition, root translucency, and cementum apposition in a combination. He
used 95 extracted teeth and grinded the teeth until the thickness of 1-mm, on this
thickness root translucency was noted, teeth were further undergone grinding up to
0.25 mm thickness afterward they were viewed under microscope for secondary
dentin deposition and cementum apposition. By using the combination of these three
factors for age estimation they got a mean error of ±4.51.70
Shruthi et al., 2015 compared and evaluated the accuracy of age estimation using translucent dentin and cemental annulations. The overall mean difference
between chronological age and estimated age using translucent dentin in 150 teeth
was 5.6 with a standard deviation (SD) ± 4.2 years. The overall mean difference
between chronological age and estimated age using cemental annulations in 150 teeth
was 2 with a SD ± 5.6 years. It was found that cemental annulations ( r = 0.97, S.E =
4) method was marginally better than translucent dentin (r = 0.98, S.E = 3.6 ) as the
mean error obtained was comparatively less than that of the translucent dentin
method.71
Supreet Jain et al., 2017 aimed to evaluate reliability and accuracy of dental age assessment through two different methods for adults i.e. tooth coronal index (TCI)
and P/T ratio the pulp chamber crown root trunk height ratios (PCTHR) using digital
panoramic radiographs. PCTHR showed slightly higher negative correlation and has
been proved as a better tool for age estimation than TCI. Negative linear correlation
was observed between the PCTRH and the chronological age of mandibular first
molar (r = 0.921) and second molar (r = 0.901). Correlation of TCI with age was
30
MATERIALS AND METHODS
SAMPLE SOURCE
Specimens for the study were collected from Department of Oral and
Maxillofacial Surgery, Vivekananda Dental College for Women, Tiruchengode.
INCLUSION CRITERIA
1. Age range 20 – 70 years
2. Mandibular premolars with fully formed roots.
3. Teeth without any trauma.
EXCLUSION CRITERIA
1. Tooth with any pathology, such as caries or periodontitis or periapical
lesions, which would alter the surface area of the tooth.
2. Teeth with developmental dental anomalies.
3. Teeth with any prosthetic fittings or restoration.
4. Teeth with extreme root curvature at mid root level.
5. Fractured teeth
METHODOLOGY
The total sample of 120 mandibular premolars was collected and were divided
into 5 groups. First group included teeth samples from the patients in the age group
of twenty to thirty years, thirty one to forty as second group, forty one to fifty as
third group, fifty one to sixty as fourth group, sixty one to seventy as fifth group
31
Two methods namely radiographic and hemisectioning, were used to estimate
age using two parameter namely P/T area ratio and P/T width ratio at CEJ.
Radiographic method
Digital Intra Oral Periapical radiographs of extracted mandibular premolars
were taken using paralleling radiographic technique. The base of the plastic ring was
fixed on the wooden block to stabilize the holder (rinn XCP) vertically. The sensor
was stabilised using a piece of wax. Teeth were placed labiolingually such that the
distal surface lies on the radiographic sensor. Digital intraoral periapical radiographs
(AMS X- Ray machine) were acquired using Sirona RVG machine with the exposure
of 65 KVp and 8 mA for 0.2 s. Sirona software was used to record the images. The
images were stored as high resolution JPEG images in the desktop monitor named
with the same sample numbers. These images were then stored separately for further
analysis.
Hemisectioning method
After recording the radiographic images, midline of the teeth were marked
using a marker. A line was drawn from the cusp tip to the root tip on the labial and
lingual surface to mark the midline. Then the distal surface of the teeth was stuck to
the wooden block using cyanoacrylate. The samples were grounded till the point
marked using the cast trimmer. Then fine grinding was done using the wheel stone
attached to the lathe. The photos of all the samples were taken using the
stereomicroscope under 6.5x magnification. Reflected light was used to record the
32 Measurement procedure
Radiographic and hemisectioned teeth images were imported to image
analysis pro premier software version 9.1. Point to point tool was used to draw a line
to measure the width of the tooth and pulp at the level of CEJ. To measure the area
twenty points were marked on the periphery of tooth surface and ten points on the
outline of the pulp although few points were added in some cases for accurate
measurements using the polygonal tool. Both two parameters were measured for each
sample and data was transferred to Microsoft office 2010 Excel spread sheet
(Microsoft Corp., Redmond, WA, USA) and Ratio’s were calculated. The results
obtained were submitted for statistical study. Intra observer reliability was checked by
cohen’s Kappa statistics in randomly selected 30 samples from after a period of 30
days. The Kappa Co-efficient value for intra examiner variability was 0.84 and this
confirms the degree of conformity in judgements made at two point of time is reliable.
STATISTICAL ANALYSIS
The data was collected and entered in MS office excel spread sheet and
subjected to statistical analysis. Statistical analysis was performed using statistical
package for social science (SPSS) software version16, 2010 program. To test for
normality of the data distribution Kolmogorov-Smirnov test and Shapiro-Wilk test
was performed.
Both descriptive and inferential statistics was performed.
Descriptive statistics
Frequency, Mean, standard deviation, confidence interval and ratio was
33 Inferential statistics
1. Cohen's kappa statistics(κ) was used to check for the intra observer reliability.
2. Pearson correlation coefficients were used to find out the correlation.
3. Linear regression analysis was performed among the measured parameters to
generate regression equation. A stepwise linear regression procedure was
followed to take in to consideration of only the significant parameters that can
influence the age.
Linear regression models were developed by using the equation
Y = a + bX
Y = Dependent variable – Chronological age.
X = Independent variable – P/T area ratio and P/T ratio at CEJ.
b = The slope of the line.
a = Is the y intercept.
4. Students T test was performed to compare the estimated age and chronological
age.
5. Cohen’s kappa statistics was done to find out the reliability between
34
RESULTS
The aim of the present study was to estimate and compare the age using digital
intraoral periapical radiographs and longitudinal hemisection of tooth. This study
included 120 mandibular premolars with equal distribution of 24 samples in all age
groups ranging from 20 to 70 years and the mean age was found to be 45.07 years.
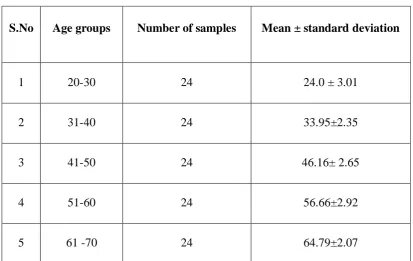
[image:47.595.109.523.323.584.2]The mean age and standard deviation for each group is shown in table 1.
Table 1: Age distribution of the study samples.
S.No Age groups Number of samples Mean ± standard deviation
1 20-30 24 24.0 ± 3.01
2 31-40 24 33.95±2.35
3 41-50 24 46.16± 2.65
4 51-60 24 56.66±2.92
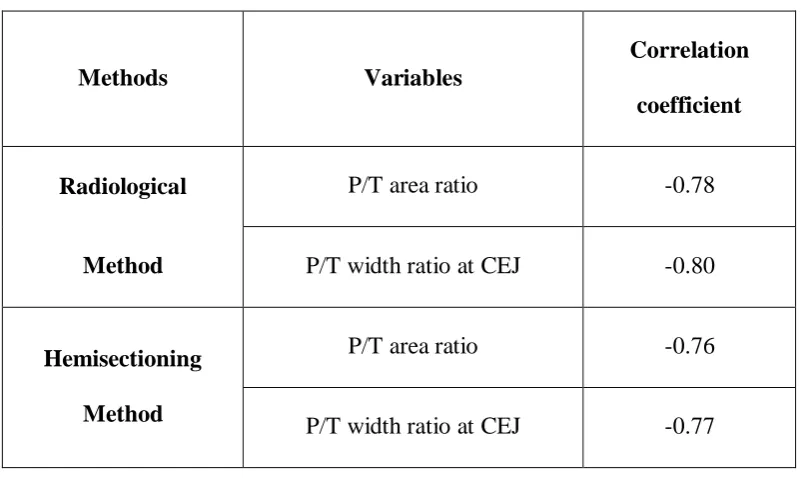
35 variables.
Methods Variables
Correlation coefficient
Radiological
Method
P/T area ratio -0.78
P/T width ratio at CEJ -0.80
Hemisectioning Method
P/T area ratio -0.76
P/T width ratio at CEJ -0.77
Pearson correlation coefficient was used to find out the correlation. On
comparing the correlation coefficient between the variables, the P/T width ratio at
CEJ have shown higher correlation than P/T area ratio in both the methods. On
comparing the correlation coefficient between the methods. Radiological method
[image:48.595.116.517.133.372.2]36
linear regression analysis was done to derive the equation for each predictor variable
[image:49.595.112.569.258.463.2]separately and combining both the variables in each method.
Table 3: Stepwise regression analysis for radiological method using P/T area ratio as independent variable.
Model
Unstandardized Coefficients
Standardized Coefficients
T Sig
95% Confidence Interval for B
B Std.
Error Beta
Lower Bound
Upper Bound
(Constant) 84.127 2.949 28.531 .000 78.287 89.966
P/T area ratio
-262.513 18.955 -0.787 -3.849 .000 -300.050 -224.977
A simple linear regression was calculated to predict chronological age based
on P/T area ratio. A significant regression equation was found (F(1, 118 ) = 191.796,
p ,< 0.00 ), with an R2 of 0.619. The regression equation is
37
38
Table 4: Stepwise regression analysis for radiological method using P/T width ratio at CEJ as independent variable.
Model
Unstandardized Coefficients
Standardized Coefficients
t Sig
95% Confidence Interval for B
B Std.
Error Beta
Lower Bound
Upper Bound
(Constant) 95.001 3.543 26.814 .000 87.985 102.017
P/T area ratio
-165.817 11.432 -.800 -14.504 .000 -188.456 -143.178
A simple linear regression was calculated to predict chronological age based
on P/T area ratio. A significant regression equation was found (f (1, 118) = 191.796, p
<0.00, with an R2 of 0.641.The regression equation is
39
Graph 2: Plots of observed age against the predicted age using the regression model for P/T width ratio at CEJ.
40
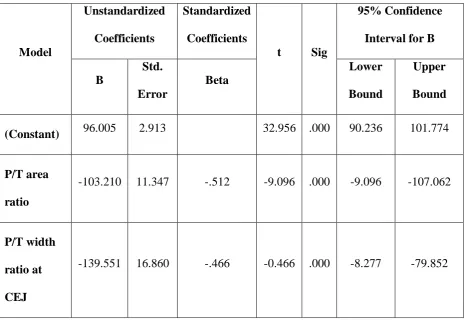
Table 5: Stepwise regression analysis for radiological method using both variables.
Model
Unstandardized Coefficients
Standardized Coefficients
t Sig
95% Confidence Interval for B
B Std.
Error Beta
Lower Bound
Upper Bound (Constant) 99.207 2.935 33.804 .000 93.394 105.019
P/T area ratio
-154.015 19.7251 -.462 -7.808 .000 -193.079 -114.951
P/T width ratio at CEJ
-103.668 2.248 -.500 -8.464 .000 -127.924 -79.412
A simple linear regression was calculated to predict chronological age based
on P/T area ratio and P/T width ratio. A significant regression equation was found
(f (1, 118) = 191.796, (p 0.00 <), with an R2 0.764. The regression equation is
41
Table 6: Stepwise regression analysis for hemisectioning method using P/T area ratio as independent variable.
Model
Unstandardized Coefficients
Standardized Coefficients
t Sig
95% Confidence Interval for B
B Std.
Error Beta
Lower Bound
Upper Bound (Constant) 77.862 2.728 28.541 .000 72.459 83.264
P/T area ratio
-227.747 17.916 -.760 -12.712 .000 -263.226 -192.269
A simple linear regression was calculated to predict chronological age based
on P/T area ratio. A significant regression equation was found (f (1, 118) = 161.593,
(p < 0.00), with an R2 of 0.578. The regression equation is
42
43
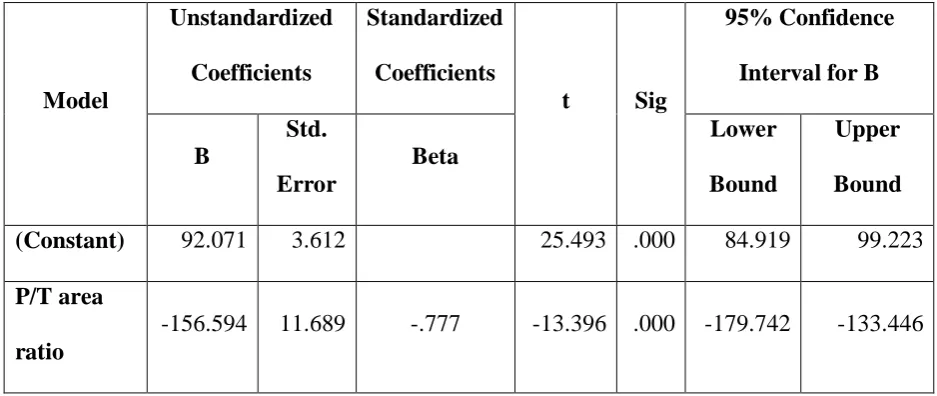
Table 7: Stepwise regression analysis for hemisectioning method using P/T width ratio at CEJ as independent variable.
Model
Unstandardized Coefficients
Standardized Coefficients
t Sig
95% Confidence Interval for B
B
Std. Error
Beta
Lower Bound
Upper Bound (Constant) 92.071 3.612 25.493 .000 84.919 99.223 P/T area
ratio
-156.594 11.689 -.777 -13.396 .000 -179.742 -133.446
A simple linear regression was calculated to predict chronological age based on P/T
area ratio. A significant regression equation was found (f (1, 118) = 179.461, (p
<0.00), with an R2 of 0.603. The regression equation is
44