Office of the Children’s Commissioner
An adequate standard of living
A child-rights-based quantitative analysis
of tax and social security policy changes
in the Autumn Statement 2013 and the
Budget 2014
Howard Reed and Diane Elson, Landman Economics
Contents
About the Office of the Children’s Commissioner………..3
Acknowledgments………...5
Executive summary……….6
1. Resourcing for children’s rights: States’ obligations……….…..12
2. Methodology used in this report……….16
3. Impact of individual measures………21
4. Cumulative impact of tax and transfer measures on household disposable income………..……..36
Conclusion……….48
References………..…..52
Appendix 1……….54
About the Office of the Children’s
Commissioner
The Office of the Children’s Commissioner (OCC) is a national public sector organisation led by the Children’s Commissioner for England, Dr Maggie Atkinson. We promote and protect children’s rights in accordance with the United Nations Convention on the Rights of the Child and, as appropriate, other human rights legislation and conventions.
We do this by listening to what children and young people say about things that affect them and encouraging adults making decisions to take their views and interests into account.
We publish evidence, including that which we collect directly from children and young people, bringing matters that affect their rights to the attention of Parliament, the media, children and young people themselves, and society at large. We also provide advice on children’s rights to policy-makers,
practitioners and others.
The post of Children’s Commissioner for England was established by the Children Act 2004. The Act makes us responsible for working on behalf of all children in England and in particular, those whose voices are least likely to be heard. It says we must speak for wider groups of children on the issues that are not-devolved to regional Governments. These include immigration, for the whole of the UK, and youth justice, for England and Wales.
The Children and Families Act 2014 changed the Children’s Commissioner’s remit and role. It provided the legal mandate for the Commissioner and those who work in support of her remit at the Office of the Children’s Commissioner to promote and protect children’s rights. In particular, we are expected to focus on the rights of children within the new section 8A of the Children Act 2004, or other groups of children whom we consider are at particular risk of having their rights infringed. This includes those who are in or leaving care or living away from home, and those receiving social care services. The Actl also allows us to provide advice and assistance to and to represent these children.
Our vision
A society where children and young people’s rights are realised, where their views shape decisions made about their lives and they respect the rights of others.
Our mission
This report is © The Office of the Children’s Commissioner 2014
Please reference this report as follows:
Acknowledgments
The authors would like to thank Mousa Haddad, David Hounsell, Louise King, Aoife Nolan and Samantha White, for comments and suggestions on an earlier draft of the report. We would also like to thank Sally Ireland and Vikki Julian at the Office for the Children’s Commissioner for their helpful
suggestions and feedback at various stages of drafting.
This report uses data from the following data sources: the Family Resources Survey 2011−12 and the Living Costs and Food Survey 2011. All data are Crown Copyright and are provided by the UK Data Service at the University of Essex (http://ukdataservice.ac.uk).
About the authors
Howard Reed is director of the economic research consultancy Landman Economics which he founded in 2008. Landman Economics specialises in complex econometric research including microsimulation modelling and policy evaluation, as well as analysis of and commentary on a wide range of
economic policy issues including tax and benefit policy, labour markets and training, macroeconomics and health economics. Recent clients for work by Landman Economics include the TUC, the Social Mobility and Child Poverty Commission, the Equality and Human Rights Commission, Save the Children, Action for Children, UNISON, Action on Smoking and Health (ASH), Oxfam, the Crown Estate and the Child Poverty Action Group.
Prior to founding Landman Economics in 2008, Howard’s previous jobs included Chief Economist and Director of Research at the Institute for Public Policy Research (2004-08) and Senior Research Economist and Programme Director at the Institute for Fiscal Studies with special responsibility for
programming the IFS’s tax-benefit model TAXBEN (1995-2004).
Executive summary
Landman Economics has been commissioned by the Office of the Children’s Commissioner (OCC) to undertake a quantitative analysis of tax and social security measures announced in the 2013 Autumn Statement and the 2014 Budget and their impact on children’s human rights, as defined by the UN Convention on the Rights of the Child (UNCRC).
The analysis involves using a combination of existing and published information and new quantitative research to assess the likely impact on children’s rights in England of certain UK public taxation and spending measures announced in the period November 2013 to April 2014.
The Budget measures covered include changes in taxes, welfare benefits and certain public expenditure measures. The analysis is undertaken within an assessment framework based on articles from the UNCRC. This analysis extends the previous analysis by Landman Economics of measures between 2010 and 2013 published by the OCC in June 2013.1
The assessment of quantitative impacts is one of the three components of the method of Child Rights Impact Assessment (CRIA) proposed by the Office of the Children’s Commissioner. The other two components are qualitative impacts, to be assessed in consultation with children and young people (Robinson ET AL, 2014), and legal analysis (Office of the Children’s Commissioner, 2012a). This report is therefore not a full CRIA, but is published as a background document to the CRIA (Office of the Children’s Commissioner, 2014).
The structure of the report is as follows:
Section 1 explains states’ obligations under the UN Convention on the Rights of the Child and how they relate to Budget measures.
Section 2 gives a summary of the methodology used in this report (more detail can be found in the appendices accompanying the report).
Section 3 assesses the specific impact of tax and welfare measures announced in the 2014 Budget and the 2013 Autumn Statement.
Section 4 presents analysis of the overall impact of the changes to taxes, benefits and tax credits introduced in the 2010-15 Parliament (including Universal Credit), showing in particular what impact the new announcements in the 2013 Autumn Statement and 2014 Budget have on the overall distributional impacts of all tax and social security
measures introduced in the current Parliament, plus announcements scheduled to take effect after 2015.
1 H Reed, D Elson and S Himmelweit (2013), An Adequate Standard of Living: A Child Rights Based
Section 5 offers conclusions.
Section 1 explains that the UNCRC, ratified by the UK in 1991, protects a range of rights – including civil and political rights and social, economic and cultural rights. States Parties must respect, protect and fulfil the UNCRC rights and this requires the allocation of resources. Economic, social and cultural rights must be progressively realised, to the maximum extent possible and paying special attention to the most disadvantaged groups. Irrespective of their resources, States must not discriminate in the enjoyment of these rights and must take immediate steps towards their realisation. These obligations extend to macro-economic policy and require that ‘children, in particular marginalised and disadvantaged groups of children, are protected from the adverse effects of economic policies or financial downturns.’2 Section 2 sets out the methodology of this report, namely that of impact assessment, allowing prediction of the likely impact of policies and the consideration of mitigating action or changes to decisions which have an adverse impact on children’s rights. This report uses microsimulation
modelling to analyse the cumulative impact of changes to taxes and benefits and funding for public services on the incomes3 of a range of different
households, with and without children, in England. It also uses the same model to analyse the impact of a range of individual measures.4
This analysis is supplemented with descriptive statistics on aspects of
changes to funding for services which cannot be modelled in the same way. A microsimulation model of direct and indirect taxes and transfer payments (such as benefits, tax credits and the Universal Credit) which uses data from the UK Family Resources Survey and Living Costs and Food Survey is used to model the distributional impacts of changes to the tax and welfare systems. Full details of the model specification and the data used, as well as all the reforms modelled, can be found in Appendix B of this report. The report is informed by the key principles of the UNCRC and considers quantifiable impacts of the measures on UNCRC rights. It should be noted that it is not possible to include data not covered by household surveys in our analysis, for example looked after children in residential facilities or Traveller children on halting sites.
Section 3 of the report looks at the distributional impact of specific changes to the income tax system, Universal Credit, and other child relevant measures (such as Tax Free Childcare and Free School Meals) announced in the 2013 Autumn Statement and/or the 2014 Budget. The quantifiable impact of the measures in terms of gains or losses in average household income is
presented by household type (e.g. lone parent, couple pensioner etc) and for all households with children, by income decile, in order to determine whether
22
For more details, see UN Committee on the Rights of the Child, General Comment No On General Measures for the Implementation of the Convention on the Rights of the Child (2003), para 51.
3
Public services are treated as providing an additional income for those who use them
4
the measure is discriminatory and/or the degree to which it is progressive and pays particular attention to the most disadvantaged groups.
The income tax measures modelled in this way result in gains to around 75% of households with children, although for around 10% of households with children the total gain from the reform is less than £1 per week. On average the measures increase the incomes of lone parents and couples with children, and such an increase may have a positive impact on children’s rights,
depending on how their parents spend the extra income. However, the increase in household income is not well-targeted from a child rights point of view. Lone parents gain less than almost all other household types. In addition the gains are lowest in percentage terms for the households with incomes in the lowest 20%, and mainly accrue to households in the middle of the income distribution.
The childcare subsidy measures have the potential to have positive impact on children’s rights, especially to life and to ‘develop to the maximum extent possible’ (Article 6 UNCRC); to care (Article 18 (2)); and to education (Article 28 and 29). However, the realisation of these rights also depends on the supply of high quality childcare. These measures do nothing to address the deficit in high quality childcare, and may drive up the price of childcare. Moreover, they are not well targeted to address the rights of the most
deprived children. Most of the gains from the Tax Free Child Care scheme, in particular, go to better off households.
The freeze in Universal Credit work allowances results in average losses to all types of household with children, with lone parents losing most on average. Households with children in the lowest 40 percent of the income distribution lose a lot more in percentage terms than higher deciles. This measure reduces assistance to parents in the performance of their child-rearing
responsibilities and is a setback for children’s rights to social security (Art 26) and to an adequate standard of living (Art 27). It does not comply with the requirement for States, whatever their economic circumstances, to pay special attention to the most disadvantaged groups’, and is retrogressive.
The extension of free school meals to all children in Reception and Years 1 and 2 result in average gains for households with children in all income
deciles, with some of the greatest percentage gains in the lowest deciles. This measure has a positive impact on children’s rights, especially the right to life and to develop to the maximum available extent (Article 6 UNCRC); to enjoy the highest attainable standard of health (Article 24); and to an adequate standard of living (Article 27). Although it is a universal measure, it is well-targeted, as the net income gain is higher for households in the bottom five deciles than in the top five deciles. It ensures an end to discriminattion
against those children who enjoy this entitlement (in compliance with Article 2 UNCRC).
increase the disposable income of households including households with children and thus might be thought to have a positive impact on children’s rights, especially the right to an adequate standard of living (Art 27 UNCRC). But it is important to look beyond the impact on disposable income to
influences on behaviour: reductions in alcohol duties and a freeze on fuel duty may have negative impacts on, for example, children’s rights to the highest attainable standard of health (Article 24).
The cap on the amount spent on most welfare (social security benefits, tax credits and Universal Credit – with some exclusions, in particular the State Pension) expenditure in the Annually Managed Expenditure accounts/[1, which has been set at the level of the Office for Budget Responsibility's forecasts for in-scope welfare spending over the next four fiscal years, is arbitrary and is not related to the allocations that are needed to ensure the enjoyment of economic and social rights. If spending on in-scope welfare exceeds the cap (plus a forecast error margin of 2 percent) then the Government has to either (a) cut spending, or (b) have a vote in Parliament to raise the cap. The
spending cap does not, in itself, mandate any further reductions in spending in its current form. However, the cap reinforces the idea that 'welfare' spending is bad in itself, undermining children’s rights to social security (Art 26). A policy of setting an arbitrary cap on social security spending, irrespective of need, is at odds with the obligation to fulfil children’s rights.
Section 4 looks at the distributional impact of the complete set of tax, benefit and tax credit measures announced between 2010 and 2015 (including Universal Credit). The measures are divided into three different components: changes to transfer payments (benefits, tax credits and Universal Credit, which is assumed to be rolled out fully in the analysis); changes to direct taxes (income tax and National Insurance Contributions); and changes to indirect taxes. For each component, the distributional impact is modelled in two stages: reforms announced between the June 2010 Budget and the 2013 Budget (inclusive), as well as preannounced reforms from the previous
Government; and reforms announced after the 2013 Budget, up to and including the 2014 Budget.
Measures announced up to and including the 2013 Budget resulted in average annual cash losses of around £2,000 for lone parent families
(around 8% of net income), around £2,000 for couples with children (over 4% of net income) and around £2,800 for multiple benefit units with children (around 6% of net income). The changes announced in the 2013 Autumn Statement and 2014 Budget make very little average impact compared to the reforms up to 2013, but have a small positive impact for all types of household with children. For lone parents this is marginal.
For all households with children examined by income decile, measures
announced up to and including the 2013 Budget resulted in losses of between approximately £1,700 and £2,100 for all deciles save the 10th (highest) decile where losses were over £3000. In percentage terms, however, the measures
[1]
were regressive, with the greatest losses for the poorest decile (over 10% of average household income) and the smallest for the richest decile (over 3% of average household income). The 2013 Autumn Statement and 2014 Budget measures resulted in no further change for households in the first and second decile but small further losses from the third decile upwards, both in cash terms and as a percentage of average income.
The cumulative impacts were also analysed by number and age of children in the household, and according to whether households had one or more
disabled children. The analysis found that households with 3 or more
children; with older (as opposed to younger) children; or with a disabled child lose more than their comparators. There is also some variation in losses according to the ethnicity of the adults in the household.
Overall, comparing 2015 with 2010, there is negative impact on incomes of families with children. This has been somewhat mitigated by the measures considered in this report, but it remains substantial. Moreover, this mitigation in the negative impact on disposable income has to be considered in the light of the incentives for behaviour detrimental to children’s rights implied by some of the measures, and the likelihood of further cuts to social security benefits and substantial and continuing cuts to the income in kind that families with children get from provision of public services, unless policies are changed. Families with children are harder hit than working age families without children, with lone parent families hardest hit of all groups in percentage terms. Thus there is no evidence that ‘children… are protected from the adverse effects of economic policies or financial downturn’.
Children in low income families are at highest risk of not enjoying the right to an adequate standard of living and the cumulative impact of the measures on family income is proportionately greater for lower income families than for higher income families (Figure4.4), in disregard of the injunction of the Committee on the Rights of the Child that:
Whatever their economic circumstances, States are required to
undertake all possible measures towards the realization of the rights of the child, paying special attention to the most disadvantaged groups.
The higher proportionate loss of income for households with disabled children is higher than those with non-disabled children (Figure 8) calls into question the rights of children to enjoy an adequate standard of living without
discrimination on grounds of disability, as required by Article 2 UNCRC; and also the right of disabled children to special care and assistance (Article 23 UNCRC).
Among the individual measures, there are clear instances of retrogressive measures, such as the three-year nominal freeze in the value of the work allowances for Universal Credit that was announced in the 2013 Autumn Statement. This measure reduces assistance to parents in the performance of their child-rearing responsibilities (thus calling into question compliance with Art18 (2) UNCRC). Furthermore, this measure is also a setback for children’s rights to social security (Art 26 UNCRC) and to an adequate standard of living (Art 27). But it should be noted that delays with the roll-out of Universal Credit means that this has not yet come into force for families with children.
There are some measures in Budget 2014 that have some mitigating impact, but these measures are, with the exception of the extension of free school meals, not well targeted, as the benefits are not distributed ‘with special attention to the most disadvantaged groups’ of children.
The evidence demonstrates that the tax/tax credit and social security measures will have a larger cumulative negative impact on working age families with children than on those without children, suggesting that they not been designed with the best interests of the child as a primary consideration (Article 3); and that the statement from the Committee on the Rights of the Child that children should be protected from the adverse impacts of economic policies5 has been ignored. The evidence also suggests that the government has not complied with the obligation to undertake measures to implement children’s rights using the maximum available resources (Article 4 UNCRC).
The fiscal consolidation strategy of the UK government relies
disproportionately on expenditure cuts, which are expected to produce about 80-85% of the planned reduction in the budget deficit, while increases in tax revenues are expected to produce 15-20%.6 The Autumn Statement 2013 and the Budget 2014 included several measures that in fact reduce tax revenues. The reductions in real value of excise taxes on alcohol and fuel and the
reductions of the obligations of energy companies to invest in sustainable energy give incentives for behaviour that is detrimental to children’s rights, especially in the longer run. These tax measures reduce, rather than maximise, the resources available for realization of children’s rights.
The tax and social security measures analysed in this report also have to be seen in the light of cuts to the funding for public services relevant to a wide range of children’s rights. Yet further cuts seem likely in the future, including in interpersonal services, such as education, care, social protection and
recreation, which are so crucial to the realisation of the full range of children’s rights under the UN Convention on the Rights of the Child.
5
Committee on the Rights of the Child, General Comment No 5. On General Measures for the Implementation of the Convention on the Rights of the Child (2003), para 51.
6
1.
Resourcing for children’s rights: States’
obligations
This report addresses the rights set out in the UNCRC (See Appendix A for the text) to which the UK is party. Some of these rights include:
Article 2: The right to enjoy all human rights, without discrimination
Article 3: That the best interests of the child must be a primary consideration
Article 6: The right to life and to develop ‘to the maximum extent possible’
Article 9: The right for children not to be separated from their parents against their will
Article 12: The right for children to participate and express their views
Article 16: The right to private and family life
Article 18: The right to care
Article 19: The right to protection from child maltreatment
Article 23: The right for disabled children to enjoy a ‘full and decent life’, and their right to special care and assistance
Article 24:The right to enjoy ‘the highest attainable standard of health’
Article 26: The right to benefit from social security
Article 27: The right to a standard of living adequate for the child’s development
Article 28 and 29: The right to education
Article 31: The right to rest and leisure
Having ratified this international treaty in 1991, the UK State has taken on a variety of obligations. The UN Committee on the Rights of the Child (CRC) has clarified, in a series of General Comments , that States have three types of obligations in relation to the UNCRC rights: to respect, protect and fulfil. For example, General Comment No. 15 (2013) on the right of the child to the highest attainable standard of health (Article 24) specifies in paragraph 71 that:
States have three types of obligations relating to human rights, including children’s right to health: to respect the freedoms and the entitlements, to protect both freedoms and entitlements against third parties or against social or environmental threats, and to fulfil the entitlements through facilitation or direct provision.
All three obligations require the State to allocate resources to meet them, although the obligation to fulfil tends to be most resource dependent . The issue of resources is covered in the UNCRC in Article 4:
rights, States Parties shall undertake such measures to the maximum extent of their available resources and, where needed, within the framework of international co-operation.
The CRC has clarified this further in General Comment No. 5. General measures of implementation of the Convention on the Rights of the Child (2003), paragraphs 7 and 8:
The second sentence of Article 4 reflects a realistic acceptance that lack of resources - financial and other resources − can hamper the full implementation of economic, social and cultural rights in some States; this introduces the concept of ‘progressive realisation’ of such rights: States need to be able to demonstrate that they have implemented ‘to the maximum extent of their available resources’ and, where
necessary, have sought international cooperation ….
The sentence is similar to the wording used in the International Covenant on Economic, Social and Cultural Rights, and the Committee entirely concurs with the Committee on Economic, Social and Cultural Rights in asserting that:
…even where the available resources are demonstrably inadequate, the obligation remains for a State party to strive to ensure the widest possible enjoyment of the relevant rights under the prevailing
circumstances ….Whatever their economic circumstances, States are required to undertake all possible measures towards the realisation of the rights of the child, paying special attention to the most
disadvantaged groups.
In 2007, the CRC held a Day of General Discussion on the topic ‘Resources for the Rights of the Child − Responsibility of States: Investments for the Implementation of Economic, Social and Cultural Rights of Children and International Cooperation’. The recommendations that emerged from this discussion made it clear that resources includes financial, human,
technological, organisational, natural and informational; and includes systematic support for parents and families, as well as directly to children (paragraph 25) The Committee recommended that ‘progressive realisation be understood as imposing an immediate obligation for States Parties to the Convention to undertake targeted measures to move as expeditiously and effectively as possible towards the full realisation of economic, social and cultural rights of children’ (paragraph 47). Moreover, ‘the obligation not to take any retrogressive steps that could hamper the enjoyment of economic, social and cultural rights is considered to be inherent in the obligation towards progressive realisation of those rights’ (paragraph 47). The Committee also underlined that ‘there are obligations requiring immediate implementation, irrespective of the level of available resources: i.e. the obligation to guarantee non-discrimination in the enjoyment of these rights and the obligation to take immediate steps towards their realisation’ (paragraph 47).
Core obligations are intended to ensure, at the very least, the minimum conditions under which one can live in dignity. The Committee on Economic, Social and Cultural Rights (CESCR) has systematically underlined this obligation of States, to guarantee at all times, the minimum level of protection (the minimum core content) in the
provision of: essential foodstuffs, equal access to primary health care, basic shelter and housing, social security or social assistance
coverage, family protection, and basic education. All States, regardless of their level of development, are required to take immediate action to implement these obligations, as a matter of priority. Where the
available resources are demonstrably inadequate, the State concerned is still required to strive to ensure the widest possible enjoyment of the relevant rights under the prevailing circumstances. Thus, complying with obligations relating to the core of a right should not be dependent on the availability of resources (paragraph 48).
The Committee made a number of recommendations for managing
government budgets so as realise children’s rights (paragraph 34) and also recommended that ‘the macroeconomic framework of growth targets should be harmonised with a human development framework based on the
Convention on the Rights of the Child and the principles of non-discrimination, best interests of the child, participation, universality and accountability’
(paragraph 31.)
Mr Kamal Siddiqui, a member of the Committee on Economic, Social and Cultural Rights, and the keynote speaker for the day commented, inter alia, on the factors which may affect the availability of resources, emphasising the ‘strength and efficacy of the taxation system, including whether there is a progressive tax policy’.
The inclusion of taxation in the discussion of ‘maximum available resources’ is supported by Elson, Balakrishnan, and Heintz (2013) who also argue that other dimensions of public finance besides expenditure and taxation are also important in securing maximum available resources, including: monetary policy, financial regulation and government borrowing.
This interpretation – which links ‘maximum available resources’ to macro-economic policy – is in line with the CRC’s position, set out in General Comment No. 15 (2013) on the right of the child to the highest attainable standard of health, in paragraph 105:
States should continually assess the impact of macro-economic policy decisions on children’s right to health, particularly children in vulnerable situations, prevent any decisions that may compromise children’s rights, and to apply the best interests principle when making such decisions.
The concern with overall economic policies is also present in General Comment No 5. On General Measures for the Implementation of the
2. Methodology used in this report
The CRC has made specific reference to analysis of Government budgets in General Comment No. 5 (2003) General measures of implementation of the Convention on the Rights of the Child (Articles 4, 42 and 44, paragraph 6), which in paragraph 45, calls for child impact assessment and child impact evaluation in relation to budgets:
Ensuring that the best interests of the child are a primary consideration in all actions concerning children (art. 3 (1)), and that all the provisions of the Convention are respected in legislation and policy development and delivery at all levels of government, demands a continuous
process of child impact assessment (predicting the impact of any proposed law, policy or budgetary allocation which affects children and the enjoyment of their rights) and child impact evaluation (evaluating the actual impact of implementation). This process needs to be built into government at all levels and as early as possible in the
development of policy.
In addition, in paragraph 51, the General Comment calls for analysis of the proportion of resources allocated to children:
In its reporting guidelines and in the consideration of States parties’ reports, the Committee has paid much attention to the identification and analysis of resources for children in national and other budgets. No State can tell whether it is fulfilling children’s economic, social and cultural rights ‘to the maximum extent of … available resources’, as it is required to do under Article 4, unless it can identify the proportion of national and other budgets allocated to the social sector and, within that, to children, both directly and indirectly. Some States have claimed it is not possible to analyse national budgets in this way. But others have done it and publish annual ‘children’s budgets’. The Committee needs to know what steps are taken at all levels of Government to ensure that economic and social planning and decision-making and budgetary decisions are made with the best interests of children as a primary consideration and that children, including in particular
marginalised and disadvantaged groups of children, are protected from the adverse effects of economic policies or financial downturns.
Efforts to identify the share of the budget allocated to children have been made in a number of countries, and a toolkit has been produced on how to do this (Save the Children and HAQ Child Rights Centre, 2010). A good
to identify the percentage of each of its budgetary lines that are considered to be allocated to children, suggesting that 28% of expenditure in 2007−8, 2008−9 and 2009−10 was allocated to children and young people, who comprise 21.6% of the population (p.9).
The report also notes that lack of data on users of services meant that often estimates were made of the share of spend going to children on the
assumption that their share was equal to their share of the population. It is much easier to identify the share of expenditure on services that go only to children and young people than their share of expenditure on services that go to adults too, such as housing, transport and economic development. In addition, this approach does not examine the distribution of expenditure between different groups of children. Moreover, expenditure budgeted to services is not always spent, for instance if grants arrive too late for voluntary organisations to use them. A further problem is the need for benchmarks to identify the adequacy of the share – is 28% too little or too much? We do not attempt to produce such a report for England, since our remit is to focus on the UK Budget, including taxes and welfare benefits, as well as public services. Instead we take up another approach mentioned in General Comment, that of impact assessment. An impact assessment allows prediction of the likely impact of policies and the consideration of mitigating action or changes to decisions which have an adverse impact on children’s rights. Ideally this should be followed by impact evaluation, but that is not yet possible, as some of the measures introduced have only recently been
implemented, or are yet to be brought in.
The OCC has proposed a model for Child Rights Impact Assessments that provides more detail about the kind of analysis to be undertaken, identifying three components: assessment of quantitative impacts, assessment of
qualitative impacts, and legal analysis (Office of the Children’s Commissioner, 2012a). The Office has also produced an assessment of the impact on
children’s rights of the Welfare Reform Bill (Office of the Children’s Commissioner, 2012b). This discusses the likely impact of individual
measures, such as the benefit cap, making reference to existing quantitative evidence, including research by the Institute for Fiscal Studies (IFS) on the impact on the numbers of children living in poverty. However, it does not include any analysis of cumulative impact, or detailed quantitative analysis of impact of measures on the incomes of different kinds of family.
An impact analysis with more similarities to that presented in this report was commissioned by the Northern Ireland Commissioner for Children and Young People on the impact of welfare reform on the rights of children in Northern Ireland (Horgan and Monteith, 2012). This refers to quantitative analysis of the impact of tax and benefit changes on the incomes of households in Northern Ireland conducted by the IFS (Browne, 2010). The IFS uses a microsimulation model to examine the impact of changes introduced in the 2010 Welfare Reform Act (NI), the Budget of June 2010 and the Autumn 2010 Spending Review. The average impact in Northern Ireland was compared to other regions; and the impact on households in Northern Ireland was
(Joyce, 2012) that uses the same model to analyse the impact of tax and benefit measures to be introduced in 2012−13 on the income of households across UK, including by family type, comparing those with and without children. The Northern Ireland report also considers the impact of individual measures, but it does not use a microsimulation model to do this.
The impact assessment in this report also uses microsimulation modelling to analyse the cumulative impact of changes to taxes and benefits and funding for public services on the incomes of a range of different households, with and without children, in England. It also uses the same model to analyse the impact of a range of individual measures. This analysis is supplemented with descriptive statistics on aspects of changes to funding for services which cannot be modelled in the same way.
A microsimulation model of direct and indirect taxes and transfer payments (such as benefits, tax credits and the Universal Credit) which uses data from the UK Family Resources Survey and Living Costs and Food Survey is used to model the distributional impacts of changes to the tax and welfare systems. The model is comparable in functionality to other tax and transfer
microsimulation models in existence in the UK (such as the Institute for Fiscal Studies’ TAXBEN model and the University of Essex’s EUROMOD). The model is capable of modelling all the changes to the income tax and National Insurance systems over the 2010−15 period, plus the changes to indirect taxes (e.g. the increase in VAT from 17.5% to 20% and most (although not all) of the benefit and tax credit changes during 2010−15, as well as Universal Credit. Full details of the model specification and the data used, as well as all the reforms modelled, can be found in Appendix B of this report.
Last year's report (OCC, 2013) also featured an analysis of the impact of changes to spending on ‘in-kind’ public services (such as health, education, social care and transport) on household living standards, using a model originally developed by Landman Economics for the TUC for analysis of the distributional impact of the 2010 Spending Review and has been regularly revised and updated since then. This report does not contain an updated version of the in-kind public spending analysis, mainly because the spending plans for 2015−16 laid out in the 2013 Spending Review made only minor changes to the assumed spending plans for 2015−16 laid out in the 2013 OCC report.
This report is informed by the key principles emphasised by the Committee on the Rights of the Child:
Indivisibility and interdependence of children’s rights: civil, political, economic, social and cultural. All are included in the Convention on the Rights of the Child.
Non-discrimination. Article 2 of the convention states that:
discrimination of any kind, irrespective of the child's or his or her parent's or legal guardian's race, colour, sex, language, religion, political or other opinion, national, ethnic or social origin, property, disability, birth or other status.
This is an immediate obligation, irrespective of resource availability.
Best interests of the child as a primary consideration. Article 3 of the Convention states that:
In all actions concerning children, whether undertaken by public or private social welfare institutions, courts of law, administrative
authorities or legislative bodies, the best interests of the child shall be a primary consideration.
The child’s right to life, survival and development, as identified in Article 6, including the physical, mental, moral, spiritual and social dimensions of their development. This Article covers civil and political rights, as well as economic and social rights.
The right of the child to be heard. Article 12 highlights the importance of children’s participation, providing for children to express their views and to have such views seriously taken into account, according to age and
maturity.
However, the methods of analysis, data sources, and level of government considered (national rather than local) limits the extent to which these
principles can be put into practice. It is easier to show the quantitative impact of UK budgets on economic and social rights, such as Article 26 of the
UNCRC, the right to social security, and Article 27, the right to an adequate standard of living, than on civil and political rights, such as Article 8, the right of the child to preserve his or her identity. The Child Rights Impact
Assessment of Welfare Reform in Northern Ireland notes that ‘the most relevant articles for this CRIA are Articles 2, 3, 4, 6, 12, 16, 19, 23, 24, 26, 27 and 28’ (p.7). The Child Rights Impact Assessment for England of the Welfare Reforms Bill notes that ‘the key UNCRC rights engaged by the Bill are Articles 2, 3, 6, 9, 12,16,19, 23,24, 26, 27 and 28’. This report will similarly identify which UNCRC rights are key with respect to the impacts of the particular measures analysed.
Non-discrimination plays a major role in the following analysis, with
households disaggregated into sub-groups so as to identify any differential impact. However, we are not able to include children who are not covered by household surveys. Thus it is not possible to identify a specific impact on children who are looked after in local authority residential facilities or who are held in secure facilities, because the data we will use is derived from
household surveys and does not cover people who live in institutions.
The report does consider inter alia the implications of the child’s best interests being a primary consideration and the impacts on the child’s rights to life, survival and development. Moreover, we recognise that the violation of rights will generally have deeper and more long-lasting physical and psychological effects for children than for adults due to their lower level of physical and mental development. The CRC has drawn attention to this:
Childhood is a unique period of physical, mental emotional and spiritual development and violations of children’s rights …may have life-long, irreversible and even trans-generational consequences.
With respect to the participation of children in budget decisions, this is much easier to envisage at local level, with respect to allocations of funding to local services, than at national level with respect to say, decisions on the level of VAT or the design of welfare reform, which require not only experiential knowledge but also a degree of expertise. The report of the Welsh Assembly Children and Young People’s Committee discusses the scope for participatory budgeting at local level, including children and young people. We do not include in our report an analysis of to what extent children were involved in the decisions whose impacts it assesses, as that would require access to Government papers that we do not have. But what we know from the investigation of the Equality and Human Rights Commission into decision making in the Autumn 2010 Spending Review suggests that decision making on UK fiscal policy is concentrated in a very few hands, even within
Government (EHRC, 2012) and we would be very surprised if there had been any involvement of young people below age 18 in the decisions whose impact we discuss. It is much more feasible to give children the right to be heard in making impact assessments.
Consultations with children are an integral part of the impact assessment model proposed by the Office of the Children’s Commissioner. It is beyond the scope of this report to include qualitative research with children on their
experiences of the impact of the fiscal measures, but this has been carried out for the OCC by the University of Brighton in their report Identifying and
3. Impact of individual measures
This section of the report looks at the distributional impact of specific changes to the income tax system, Universal Credit, and other child relevant measures (such as Tax Free Childcare and Free School Meals) announced in the 2013 Autumn Statement and/or the 2014 Budget.
3.1 Income tax measures
Five changes to the income tax system were announced in the 2013 Autumn Statement and the 2014 Budget:
1. An increase in the personal allowance for income tax from £10,000 to £10,500 in April 2015. This is estimated to cost the Exchequer around £1.4 billion in 2015−16.
2. The introduction of a transferable tax allowance for married couples and civil partners from April 2015. For eligible couples where one partner earns below the income tax personal allowance, this measure allows the couple to transfer up to £1,000 of that partner's unused personal allowance to the other partner (provided that the other partner's gross income is below the higher rate threshold for income tax). This measure is worth a maximum of £200 per couple (the £1,000 value of the allowance multiplied by the income tax basic rate of 20%). This is estimated to cost the Exchequer around £500 million in 2015−16.
3. The reduction in the 10% rate of income tax on interest from savings for low-income savers to zero, and the increase in the amount of savings taxed at this rate from £2,880 to £5,000 from April 2015. This zero rate only applies to individuals with total taxable income of less than £5,000 in the 2015−16 tax year; individuals with taxable income of more than £5,000 will be taxed at 20% on all taxable income. This measure is estimated to cost the Exchequer around £300 million by 2016−17.
4. The tax-free savings limit for Individual Savings Accounts (ISAs) has been increased from £11,880 to £15,000 from July 2014.
5. For individuals who are about to receive benefits from a private pension, the requirement to use 75% of their pension savings to buy an annuity has been abolished, and income drawn down from the pension pot will now be taxed at the individual's marginal rate rather than a rate of 55%.
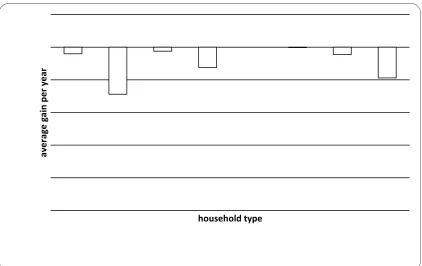
Figure 1 shows the impact of the personal allowance increase, transferable tax allowances and the reductions in savings tax for the year 2015−16 by household type in cash terms (number of pounds gained per year in each group) at April 2014 prices. This analysis divides the FRS household sample into eight types
single adults with no children
lone parents
couples with no children
couples with children
single pensioners
couple pensioners
multiple benefit unit households without children (a multiple benefit unit household is one that contains more than one FRS benefit unit7)
[image:22.595.89.514.330.610.2] multiple benefit unit households with children.
Figure 1: Average cash gains from income tax reforms by household type
Figure 1 shows that the personal allowance increase has the biggest cash impact for all household types except for couple pensioners, for whom the biggest impact comes from the transferable allowance. This is mainly because couple pensioners are more likely to have one partner with an income above the personal allowance (but below the higher rate threshold) and the other partner below the personal allowance than any other group. The transferable
7
A benefit unit in the FRS is a single adult or a (married or cohabiting) couple with any dependent children. So for example, an adult couple living with their parents or two or more single people sharing an address would constitute a multiple benefit unit household in the FRS.
av
e
rag
e
g
ai
n
p
e
r
ye
ar
household type
allowance is of no benefit to single households, lone parents or couples who are not married or civil partners. Its impact on couples with and without children is roughly equal in cash terms, but only 18% of families with children benefit from the measure, as opposed to 31% of married couples, 64% of whom do not have children (Women’s Budget Group, 2012). The reductions in savings taxation have a relatively minor impact for all groups except for
couple pensioners.
Figure 2 shows the distributional impact of these changes as a percentage of net household income. The biggest percentage gains are for couple
[image:23.595.91.513.312.592.2]pensioners, followed by couples with no children and multiple benefit units with no children. The smallest percentage gains are for lone parents, who benefit relatively little from the personal allowance increase as most lone parents have gross incomes of less than £10,000 per year.
Figure 2: Average percentage gains from income tax reforms by household type
Figure 3 shows the impact of the income tax changes in percentage terms for families with children by net household income decile8. Note that these are the average percentage gains across all households in each decile (rather than the percentage gain across just those households who gain from the policy).The impact of the personal allowance changes is highest in
percentage terms in the 6th, 7th and 8th deciles of household income. The
8
Note that the deciles are defined across all households rather than across households with children only. There are relatively few households with children in the bottom decile because tax credits (in cases where the household is eligible for them) and child benefit provide sufficient income in most cases to lift families out of the very bottom part of the net income distribution.
av
e
rag
e
g
ai
n
p
e
r
ye
ar
household type
impacts of the changes to savings tax are relatively small in percentage terms and uneven distributionally, with the largest percentage gains in the middle and top of the income distribution.
Figure 3: Average percentage gains from income tax reforms by household income decile
Around 75% of households with children gain from the income tax reforms, although for around 10% of households with children the total gain from the reform is less than £1 per week. On average the measures increase the incomes of lone parents and couples with children, and such an increase may have a positive impact on children’s rights, depending on how their parents spend the extra income. For instance, it could have a positive impact on the right of the child to an adequate standard of living (Article 27);to life and to ‘develop to the maximum extent possible’ (Article 6);to enjoy the highest attainable standard of health (Article 24) ; and to rest and leisure (Article 31). However, the extra income is not labelled as being for children (unlike
increase in child benefit or child related tax credits) which may mean that it is not so likely to be spent on children as increases in benefits that are
specifically child- related.
Moreover, the increase in household income is not well-targeted from a child rights point of view. The gains in cash terms and in percentage terms go more to couples without children ( including both working age and pension age couples) than with children; and lone parents gain less than other groups, with the exception of single pensioners. In addition the gains are lowest in
percentage terms for the households in the lowest quintile, and mainly accrue to households in the middle of the income distribution. Finally, the income tax measures will cost £2.8 billion annually that might have been better spent on welfare benefit measures and public services directly linked to children. It
av
e
rag
e
g
ai
n
p
e
r
ye
ar
decile
does not appear that the budget is allocating the ‘maximum available resources’ to realise children’s rights.
Turning to the impact of the other income tax changes, the increase in the ISA limit from £11,880 to £15,000 will mainly affect only the richest households, as to take advantage of the increased limit, a one-adult household needs to have more than £11,880 of disposable income to save per year, while a two-adult household would need to have more than £23,760 of disposable income. Statistics from HMRC show that in 2011−12 (the latest tax year for which statistics are available), only 771,000 adults – around 1.5% of the UK adult population − saved the full amount into a stocks and shares ISA (which in that year was £10,680); presumably even fewer adults would have been in a position to save the full £15,000 if the higher limit had been in place back in 2011/12.9 The changes to pension taxation will mainly affect households approaching retirement in the short term, the majority of which do not have children aged under 16 (or under 19 and in full-time education) in the household.
3.2 Childcare subsidy measures
This section shows the impact of two measures announced in the 2014 Budget which will provide increased support for childcare costs for families with children:
The Tax Free Childcare initiative, which provides a childcare subsidy payment to families with children who are not claiming Universal Credit, has been increased from £6,000 to £10,000 per child. The scheme is also being rolled out more quickly than originally intended (in the revised timetable, it will be rolled out to all eligible families with children under 12 within the first year of the scheme's operation).
The increase in the percentage of childcare costs eligible for payment under Universal Credit from 70% to 85% of costs, which was previously only available to Universal Credit claimants with gross incomes above the Income Tax personal allowance, is now being extended to all Universal Credit claimants.
Figure 4 shows the distributional impact of these two policy measures as a percentage of net income, for households with children only, by income decile. The scale for the graph has been chosen to match Figure 3 above, to give an impression of the size of the distributional impacts of these policies relative to the income tax changes.
9
Figures taken from HMRC ISA Statistics, Table 9.7, available at:
Figure 4: Average percentage gains from childcare subsidy measures by household income decile
Figure 4 shows that the increased generosity of the Tax Free Childcare scheme is distributionally regressive, with most of the gains going to
households in the upper income deciles (in cash terms, over half the gains from the measure go to households in the top income decile). This makes sense given that the only families who can afford to spend between £6,000 and £10,000 per child on childcare are those with high incomes. The
increased generosity of Universal Credit has the biggest positive impacts in the 6th and 7th deciles of the income distribution, because families claiming Universal Credit who are in the middle of the income distribution are much more likely to be in work and using paid childcare than families lower down the income distribution.
Figure 5 shows the percentage impacts of the increased childcare subsidies by family type. Lone parents gain relatively little from Tax Free Childcare but a relatively large amount from the Universal Credit changes. For couples with children, the gains are equally split between Tax Free Childcare and Universal Credit (although as shown above, the distributional impact of each of these policies by income decile is very different).
av
e
rag
e
g
ai
n
p
e
r
ye
ar
decile
Figure 5: Average percentage gains from childcare subsidy measures by household type
The childcare subsidy measures have the potential to have positive impact on children’s rights, especially to life and to ‘develop to the maximum extent possible’ (Article 6); to care (Article 18 (2)); and to education (Articles 28 and 29). However, as noted in our analysis of the 2013 Budget (Reed et al, 2013), the realisation of these rights also depends on the supply of high quality
childcare. States are obliged to ensure the development of institutions, facilities and services for the care of children (Article 18 (2)). Standards of quality of provision are addressed in Articles 3 and 29.
These measures do nothing to address the deficit in high quality childcare, and may drive up the price of childcare. Moreover, they are not well targeted to address the rights of the most deprived children. Ofsted inspections in 2012 found that only 64% of nurseries and child-minders in the most deprived areas were judged ‘good’ or ‘outstanding’ compared to 79% in the country as a whole. The Tax Free Child Care scheme is highly regressive with most of the gains going to the better off households (Ibid.). Reallocating the additional money spent on this scheme (around £600 million by 2016−17)10
to childcare provision targeted to more deprived children, such as Sure Start centres, would be more in line with the requirement for States to pay special attention to the most disadvantaged groups as advised by the Committee on the Rights
10
See HM Treasury (2014), pp56-57. This net cost comprises additional spending of £745 million on Tax Free Childcare minus a reduction in spending of £145 million on the previous Employer-Supported Childcare Scheme which is being closed to new entrants when the Tax Free Childcare scheme launches in Summer 2015.
av
e
rag
e
g
ai
n
p
e
r
ye
ar
household type
of the Child in General Comment No. 5.
3.3 Freeze in Universal Credit work allowances
A three-year nominal freeze in the value of the work allowances for Universal Credit was announced in the 2013 Autumn Statement. These are the amounts which families claiming Universal Credit are allowed to earn before being subject to the 65% taper on net earnings. The freeze in the work allowances is forecast to save the Exchequer £300m by 2016−17. Figure 6 shows the impact of the three-year freeze in work allowances by 2016−17 relative to a situation in which the previously announced uprating rules (1% nominal for April 2013, April 2014 and April 2015 and then CPI for April 2016) had
remained in place, and assuming that all households have been moved over to the Universal Credit system by April 2016. (Note that in reality, full
[image:28.595.91.514.341.607.2]migration of the existing benefit and tax credit caseload onto Universal Credit will not occur until 2017 at the earliest).
Figure 6: Average percentage losses from freeze in Universal Credit work allowances by household type
Figure 6 illustrates that lone parents lose most on average from the freeze in Universal Credit work allowances, followed by couples with children. This is not surprising given that these groups have more generous work allowances than families without children.
Figure 7 shows the percentage impact of the freeze in Universal Credit work allowances for households with children by net income decile. The impact of this measure is regressive, with the lowest 40% of the income distribution losing a lot more in percentage terms than higher deciles. This measure will
av
e
rag
e
g
ai
n
p
e
r
ye
ar
also have an adverse impact on the incentive to work for Universal Credit claimants as it reduces net income for working families with gross incomes above the disregard level while leaving income unchanged for non-working families.
[image:29.595.89.514.261.545.2]The freeze in the work allowances has been justified on the grounds of reducing the deficit, but given that the cuts to income tax analysed in Section 3.1 will cost the Exchequer a total of around £2.8 billion11 by 2016−17, relative to a saving of around £300 million from freezing the work allowances for three years, it is difficult to interpret the overall package of reforms in 2014−15 as one which prioritises deficit reduction.
Figure 7: Average percentage losses from freeze in Universal Credit work allowances by household income decile
This measure reduces assistance to parents in the performance of their child-rearing responsibilities (thus calling into question compliance with Article 18(2)). Furthermore, it is a setback for children’s rights to social security (Article 26) and to an adequate standard of living (Article 27). It does not comply with the requirement for States, whatever their economic
circumstances, to pay special attention to the most disadvantaged groups’ , as advised by the Committee on the Rights of the Child in General Comment No. 5. It is a retrogressive measure. It is hard to see why this measure was introduced as it also has an adverse impact on work incentives, contradicting the Government’s policy objective of improving work incentives. It should be noted that the delays in rolling out the Universal Credit system mean that this measure has yet to come into force for households with children.
11
Based on policy costings in 2013 Autumn Statement and 2014 Budget documentation.
av
e
rag
e
g
ai
n
p
e
r
ye
ar
3.4 Free School Meals: Extension to all Reception, Year 1 and Year 2 schoolchildren
The 2013 Autumn Statement announced the roll-out of free school meals to all schoolchildren in Reception and Years 1 and 2 of primary school from September 2014, a policy which is costed at £740 million for 2015-16 (including £590m of revenue funding, and £150m of capital funding).
Previously, only children in families in receipt of certain means-tested benefits (Income Support, income-based Jobseekers Allowance, income-related Employment and Support Allowance and the guarantee element of Pension Credit) as well as children in families in receipt of Child Tax credit (but not Working Tax Credit) were eligible for Free School Meals. The extension of Free School Meals could thus be expected to mainly benefit middle and higher-income families on the grounds that most low-income families were already entitled due to receiving the relevant means-tested benefits and/or tax credits.
Figure 8: Average cash gain from extension of Free School Meals to all children in Years 1 and 2 by family income decile
Figure 9: Average percentage net income gain from extension of Free School Meals to all children in Years 1 and 2 by family income decile
This measure has a positive impact on children’s rights, especially the right to life and to develop to the maximum available extent (Article 6); to enjoy the highest attainable standard of health (Art icle 24); and to an adequate standard of living (Article 27). Although it is a universal measure, it is well-targeted, as the net income gain is higher for households in the bottom five deciles than in the top five deciles. It ensures an end to discriminattion against those children who enjoy this entitlement (in compliance with Article 2). It is a good example of how a universal entitlement can be a well targeted measure, if the target is realising the rights of children.
ch
an
ge
in
n
e
t
in
co
m
e
(£,
an
n
u
al
)
decile
ch
an
ge
in
n
e
t
in
co
m
e
(%
)
[image:31.595.90.453.399.621.2]3.5 Indirect tax and energy bill measures
The 2013 Autumn Statement announced that the planned fuel duty increase scheduled for September 2014 would be cancelled, at a cost of £750 million in 2015−16 the Exchequer.12
This is the latest in a series of cancellations of fuel duty increases since 2010. Additional real-terms reductions in excise duties on beer, cider, spirits and wine were announced in the 2014 Budget. The 2013 Autumn Statement also announced measures to reduce domestic energy bills by, on average, £50 per household:
Suppliers will deliver £12 rebates to all domestic electricity accounts for the next two years. This will cost Government at least £600m in total
Reform of the Energy Company Obligation (ECO) saving, on average, £30-£35
Voluntary action by the electricity distribution network companies to reduce network costs in 2014-15 (savings on average £5)
A consequential VAT saving of £2.
The 2013 Autumn Statement also announced that the Government was consulting on a package of measures which it was claimed would reduce household domestic energy bills by scaling back the Energy Company Obligation (ECO) scheme which reduces the fuel usage of poor households, which HM Treasury calculated would be worth around £50 per household on average. This section assesses the distributional impact of these measures, using information on spending patterns for households of different types and by household net income from the 2011 Living Costs and Food Survey.13 Figure 10 shows the distributional impact of the indirect tax and energy bill measures by household type. Overall, single pensioners gain the most in percentage terms from the changes, and this result is driven mainly by the energy bill measures (energy bills for single pensioners are a higher
proportion of net income than for any other household type on average). The cancellation of the fuel duty increase has a slightly bigger impact for couples with children and multiple benefit unit households than for other household types.
It should be noted that Figure 10 shows the maximum potential short-run impact of the energy bill measures, based on the assumption that energy
12
See details at HM Treasury (2013), p7. 13
companies pass on to consumers all of the cost reduction from the removal of obligations to invest in sustainable energy, rather than increasing their profits. Also in the long run, reduced investment in renewable energy could lead to the imposition of higher costs on households due to the dangerous impacts of climate change (Stern and Dietz, 2014).
Figure 10: Impact of indirect tax and energy bill measures as a percentage of net income by household type
Figure 11 shows the distributional impact of the indirect tax measures by household income decile (for households with children only). Overall the impacts are slightly progressive, with lower income households gaining slightly more as a percentage of net income than higher income households. However, the impact of the fuel duty and alcohol duty reductions will be uneven within each decile. Households who do not drive a car will not benefit from the fuel duty reductions; likewise, households who do not drink alcohol will not benefit from the reductions in alcohol duties. Analysis of the 2011 Living Costs and Food Survey shows that car ownership and alcohol
consumption are strongly negatively related to income. 95% of households in the top net income decile own at least one car or van, compared with only 39% of households in the lowest income decile. Meanwhile, 58 percent of households in the lowest decile spent nothing at all on alcohol in the two-week diary period covered by the LCF, compared with only 14 percent of
households in the top decile.
av
e
rag
e
g
ai
n
household type
Figure 11: Impact of indirect tax and energy bill measures as a percentage of net income by household income decile
These measures do increase the disposable income of households including households with children and thus might be thought to have a positive impact on children’s rights, especially the right to an adequate standard of living (Art 27 UNCRC). But it is important to look beyond the impact on disposable income to influences on behaviour. Real terms reduction in duties on alcohol may influence behaviour in ways that undermine children’s rights. For
instance, cheaper alcohol may encourage more alcohol consumption, both by adults and children, in ways that undermine the right to life and development to the maximum extent possible (Article 6) and to the highest attainable standard of health (Article 24). Cheaper petrol and diesel may encourage more intensive use of petrol and diesel in ways that contribute to harmful climate change; and the loosening of obligations on energy companies to invest in sustainable energy may do the same (Stern and Drietz, 2014). Harmful climate change threatens children’s rights to life and development to maximum extent possible (Article 6) and to highest attainable standard of health (Article 24), if not for this generation of children, then for the next. We may question whether these measures are in the best interests of children, as required by Article 3.
3.6 The cap on AME welfare spending
The 2014 Budget announced a cap on the amount spent on most welfare (social security benefits, tax credits and Universal Credit) expenditure in the Annually Managed Expenditure accounts. The only items of social security expenditure not included in the cap are Jobseekers Allowance (JSA) (and the equivalent spending for Universal Credit claimants in the full conditionality group who are not currently in work), Housing Benefit for JSA claimants (and
av
e
rag
e
g
ai
n
decile