0022-538X/09/$12.00 doi:10.1128/JVI.01022-09
Copyright © 2009, American Society for Microbiology. All Rights Reserved.
Quantifying Differences in the Tempo of Human Immunodeficiency
Virus Type 1 Subtype Evolution
䌤
Ana B. Abecasis,
1,2* Anne-Mieke Vandamme,
2and Philippe Lemey
2Instituto Gulbenkian de Cieˆncia, Oeiras, Portugal,1and Laboratory for Clinical and Epidemiological Virology,
Rega Institute for Medical Research, Katholieke Universiteit Leuven, Leuven, Belgium2
Received 20 May 2009/Accepted 24 September 2009
Human immunodeficiency virus type 1 (HIV-1) genetic diversity, due to its high evolutionary rate, has long been identified as a main cause of problems in the development of an efficient HIV-1 vaccine. However, little is known about differences in evolutionary rate between different subtypes. In this study, we collected repre-sentative samples of the main epidemic subtypes and circulating recombinant forms (CRFs), namely, sub-subtype A1, sub-subtypes B, C, D, and G, and CRFs 01_AE and 02_AG. We analyzed separate data sets forpoland
env. We performed a Bayesian Markov chain Monte Carlo relaxed-clock phylogenetic analysis and applied a codon model to the resulting phylogenetic trees to estimate nonsynonymous (dN) and synonymous (dS) rates along each and every branch. We found important differences in the evolutionary rates of the different subtypes. These are due to differences not only in the dN rate but also in the dS rate, varying in roughly similar ways, indicating that these differences are caused by both different selective pressures (for dN rate) and the replication dynamics (for dS rate) (i.e., mutation rate or generation time) of the strains. CRF02_AG and subtype G had higher rates, while subtype D had lower dN and dS rates than the other subtypes. The dN/dS ratio estimates were also different, especially for theenvgene, with subtype G showing the lowest dN/dS ratio of all subtypes.
Human immunodeficiency virus type 1 (HIV-1) strains are classified into three different groups (M, N, and O) that arose from separate cross-species transmissions. While group N and O infections are largely restricted to Central Africa (essentially Cameroon), the worldwide pandemic is caused only by HIV-1 group M strains. Group M is further classified into nine dif-ferent subtypes (A, B, C, D, F, G, H, J, and K), which in the cases of subtypes A and F can be divided further into sub-subtypes. Forty-three circulating recombinant forms (CRFs) have been reported to be circulating worldwide (25; Los Alamos National Laboratory Database [http://www.hiv.lanl.gov/content /index]).
Since subtypes at least partly originated from founder effects (22), it is not surprising that HIV-1 genetic forms show differ-ent geographical distributions. Subtype B initially generated the epidemic in North America, subsequently spread to Eu-rope, and is still the predominant subtype in these regions (10, 24). However, the largest number of HIV-1 infections can be attributed to subtype C (⬃50%), with most of them occurring in southern Africa and India. CRF01_AE prevails mostly in Asia, while subtypes D, G, and CRF02_AG cause the largest numbers of infections in North and West Africa. In West Central Africa, the geographic region where the HIV-1 pan-demic originated, most genetic forms of HIV-1 can be found (11, 12; http://www.hiv.lanl.gov/content/index).
HIV-1 is a lentivirus characterized by an extremely high degree of genetic diversity. This is the result of an extremely
high mutation rate, caused by (i) the high error rate of reverse transcriptase (RT) (⬃0.2 error per genome per replication cycle), (ii) the high replication rate (viral generation time of 2.5 days, producing 1010to 1012virions per day), (iii) a high re-combination rate of⬃42.4% in one round of replication with markers spaced 1 kb apart, (iv) large viral populations, (v) considerable natural selection from the immune system, and (vi) drug pressure (19, 22, 23).
The mutation rates of genes that encode structural enzymes, such as protease, RT, and integrase, are expected to present an evolutionary rate that reflects the errors generated during re-verse transcription, functional constraints, and cellular immune selective pressure. Although drug selective pressure causes resistance mutations to be fixed rapidly in these genomic re-gions, this effect should be mostly absent in the viral evolution-ary history of drug-naïve patients.
On the other hand, the evolutionary rate ofenv, which is the main target of the host immune system, is expected to also present the effect of the humoral immune response.
Although evolutionary rates will reflect selective pressure to some extent, a more direct measure of selective pressure is the ratio of nonsynonymous substitutions (dN) to synonymous sub-stitutions (dS). This measure has been used previously to com-pare the evolution of different HIV-1 lineages. Different levels of selective pressure were found between subtypes, but these were not consistent between different regions ofenv(4). HIV-2 was found to be under less selective pressure than HIV-1 (4). Absolute dS and dN rates combine the information on mu-tation rates as well as selective pressure. While synonymous changes reflect mutation rates and generation times, nonsyn-onymous changes are also affected by (immune) selective pres-sure. When this new approach was applied to HIV-1 evolution, Lemey et al. found that dS rates predict disease progression for
* Corresponding author. Mailing address: Instituto Gulbenkian de Cieˆncia, Rua da Quinta Grande 6, P-2780-156 Oeiras, Portugal. Phone: 32-16332160. Fax: 32-16332131. E-mail: ana.abecasis@gmail .com.
䌤Published ahead of print on 30 September 2009.
12917
on November 8, 2019 by guest
http://jvi.asm.org/
HIV-1, and this may also be extrapolated to differences be-tween HIV-1 and HIV-2 (15).
In this paper, we compare the evolutionary dynamics of different HIV-1 subtypes at the population level in an attempt to understand how the dN and dS rates contribute to the differences in their evolutionary rates. A better characteriza-tion of these factors should improve our understanding of the genetic diversity of HIV and contribute to better vaccination strategies and potentially a better understanding of differences between subtypes in the development of resistance under drug selective pressure.
MATERIALS AND METHODS
Data collection and subtyping.Sequences were collected from the Los Alamos HIV-1 database. Data sets for seven different subtypes/CRFs were obtained, representative of CRF01_AE, CRF02_AG, subtype A1, subtype B, subtype C, subtype D, and subtype G. These lineages represent the most important epi-demic strains. For the remaining subtypes, not enough data were found in public databases. For each subtype, two data sets were collected, one for thepolgene (bp 2,500 to 3,300 of the HXB2 sequence) and another for theenvgene (bp 6,500 to 7,500 of the HXB2 sequence). There were not enough publicly available sequences to form a representative sample ofgag. Additionally, because a con-siderable number of full-genome subtype B and C sequences are publicly avail-able, we analyzed two data sets for these subtypes, derived from full-genome sequences. These data sets allowed us to exclude the effect of sampling bias because we could compare the results from thepolandenvgenomic regions originating from the same full-genome sequences, as opposed to the previously described data sets, wherepolandenvwere sampled independently from each other. The selection of the data set for every subtype aimed at the widest range of collection years and geographic distribution of the samples. In this way, we attempted to avoid a limitation of our sample to certain local epidemics and host factors not representative of that subtype. Furthermore, previous studies have shown the importance of the range of sampling times for the estimation of evolutionary parameters. A short interval of sampling times naturally provides less information about the average rate during that interval than does a long interval (30). Sequences sampled from the same individuals and sequences with drug resistance mutations inpolwere excluded from the data sets.
The subtype assigned to each sequence by the Los Alamos database was confirmed using the REGA subtyping tool v2 (REGAst) (5). REGAst analyzes the phylogenetic signal of each sequence by using quartet puzzling (29) and performs a phylogenetic analysis combining neighbor-joining phylogenetic tree construction using PAUP (32) and the bootscanning analysis method (28). Se-quences that were not unambiguously classified by REGAst or that were as-signed to a different subtype from the one specified in the Los Alamos database were removed from the data set.
The alignments of all the data sets were generated with Clustal X (33). When editing the alignment, we kept the coding information for each sequence, using the HXB2 coding sequence for the same genomic region as a reference. Inser-tions relative to the HXB2 reference, as well as ambiguous and gapped regions, were removed from the alignment (1).
Estimation of phylogenetic trees.We used Bayesian Markov chain Monte Carlo (MCMC) analysis, as implemented in BEAST (8), to estimate the phylo-genetic trees that best describe the evolutionary history of each data set. We used the HKY85 nucleotide substitution model, with four-category gamma-distrib-uted rate variation among sites and two partitions in the codon positions (first plus second codons and third codon), which has previously been shown to be the best-performing nucleotide model for most virus data sets (31). A relaxed clock with an uncorrelated log normally distributed prior allowed us to get a posterior distribution of trees, with branch lengths in time units and substitution rate units (6). A Bayesian skyline plot (BSP) population growth model with 10 grouped intervals—intervals are separated by coalescent events—was used (9). Since it allows the effective population size to vary between coalescent events, this model avoids making restrictive prior assumptions on the demographic history by fitting a wide range of demographic scenarios to the data (9). MCMC analysis was run long enough for convergence to be obtained, typically for 100⫻106generations.
To analyze convergence and stability, we used Tracer v1.3 software (http://tree .bio.ed.ac.uk/software/tracer/), which allowed us to visualize the posterior distri-bution for each parameter and provided an estimate of the effective sample size, a measure of the number of “effectively independent” samples in each run, as defined by Drummond et al. (7).
The most recent dating of the origin of HIV-1 group M refers to 1908 (1884– 1921) (35). We used this date as a calibrator for our results (as opposed to specifying a prior)—the age for the root height of our analyzed subtypes should always be younger than the origin of group M. However, since subtype D results presented a date for the root height that was older than group M, the analysis was performed by specifying a normal prior for the tMRCA (time of the most recent common ancestor) of subtype D as 1950, with a standard deviation of 5 years (95% confidence interval [CI],⬃1940 to 1960), consistent with previous dating studies (14, 27, 35, 36). Since convergence was still not achieved for thepoldata set, we used the less parameter-rich exponential-growth demographic model in addition to the previously used BSP model.
Estimation of dS and dN rates.Lemey et al. recently developed a method to estimate absolute dS and dN rates in a Bayesian framework (15). In this method, the contributions of dN and dS rates to the overall substitution rate are estimated based on the posterior substitution rates estimated by MCMC analysis. Their estimation is performed using a local codon model, as implemented in HYPHY (15, 21). We used the MG94xHKY85 codon model (20), an extension of the classical MG94 model with estimation of equilibrium codon frequencies, using nucleotide frequencies specific to each codon position. This method was applied to a sample of 200 trees taken from the posterior distribution of trees estimated with BEAST. Codon model analysis decomposes the expected number of sub-stitutions along each branch into a dS and a dN component. Based on the branch lengths in time units, substitution rates can be obtained separately for dS and dN. Given that the substitution rate for the external branches of the tree is an accumulation of substitutions and possible deleterious mutations, we estimated the substitution rate based only on the estimate for the internal branches of the tree. This estimate resulted in a better agreement between the dS rates forpol
andenv. Since the dS rate reflects the mutation rate and generation time, but not selective pressure, we assumed that the dS estimates based onpolandenvshould be very similar.
Although average dN/dS ratios can also be obtained using this approach, the use of a local model leads to very large posterior distributions (data not shown). Despite the fact that the dN and dS rates were calculated using the local model, the values presented here were estimated based on the ratio between the global dN and dS rates of each of the 200 trees, therefore making an assumption that the dN/dS ratio is shared between branches. The presented errors of the dN/dS estimations are therefore a CI estimation, not a posterior credibility interval, as presented in the absolute rates. We report dN/dS estimates by using mean dN and dS rates for all of the branches of each tree (see Fig. 3a) and mean dN and dS rates only for the internal branches of each tree (see Fig. 3b).
Statistics.Pvalues were calculated by counting the number of times that one estimate was higher than the other for each of the 200 trees. This value, divided by 200 and multiplied by 100, is considered the probability that the two compared parameters come from different distributions and therefore are significantly different. In this analysis, we performed 36 multiple pairwise comparisons. Cor-recting for multiple testing is an important approach when multiple pairwise comparisons are performed. However, on the other hand, it also reduces the statistical power of the analysis. Therefore, while we still reportPvalues of⬍0.05 as significant in our results, we stress that in using the Bonferroni correction, only
Pvalues of⬍0.00138 should be considered significant.
RESULTS
Data sets. The curated data sets that were used for the analysis are summarized in Table 1. The data sets covered a minimum sampling time range of 11 years (subtype G) and a maximum time range of 23 years (subtype Benv) (Table 1). The samples were collected from diverse geographic regions, with the objective of covering all of the subepidemics of each subtype.
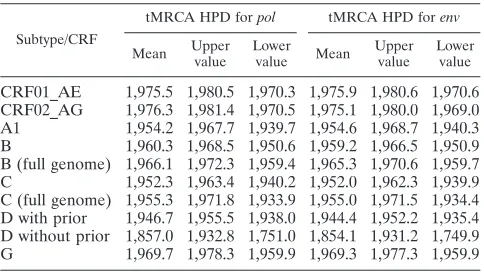
tMRCAs.The tMRCA for each subtype was estimated, and the results are summarized in Table 2. By using the BSP de-mographic model, we made no assumptions on the shape of demographic growth of the population. For thepoldata set of subtype D, convergence and stability of our run were not achieved using the BSP demographic model. Since the expo-nential-growth demographic model has previously been shown to reliably explain the demographic history of HIV-1 (24, 26,
on November 8, 2019 by guest
http://jvi.asm.org/
34), we used this model as an alternative and were then able to achieve convergence and stability of that run.
Substitution rate. Since external branches of the tree present an excess mutation rate that does not necessarily re-flect the substitution rate of the virus, and consistently with the next sections (also see Materials and Methods), for our statis-tics we considered only the internal branches of the tree. When analyzing the posterior distribution of the substitution rates in the internal branches of the tree, we found particular differ-ences between different data sets. CRF02_AG had a higher mean substitution rate than all other subtypes in bothpoland env, while subtype D had lower rates inpoland inenv(along with subtype B inpol). Subtype G showed a similar pattern to that for CRF02_AG; however, probably due to the smaller number of samples and time span in this data set, the 95% CI was very broad (Fig. 1).
The differences in mean substitution rate between subtypes can be due to differences in the generation time, mutation rate, or (immune) selective pressure. While the first two factors should mostly be reflected in the dS rate, the latter should impact the dN rate. Therefore, we further explored the con-tributions of synonymous and nonsynonymous substitutions to the differences in the substitution rates.
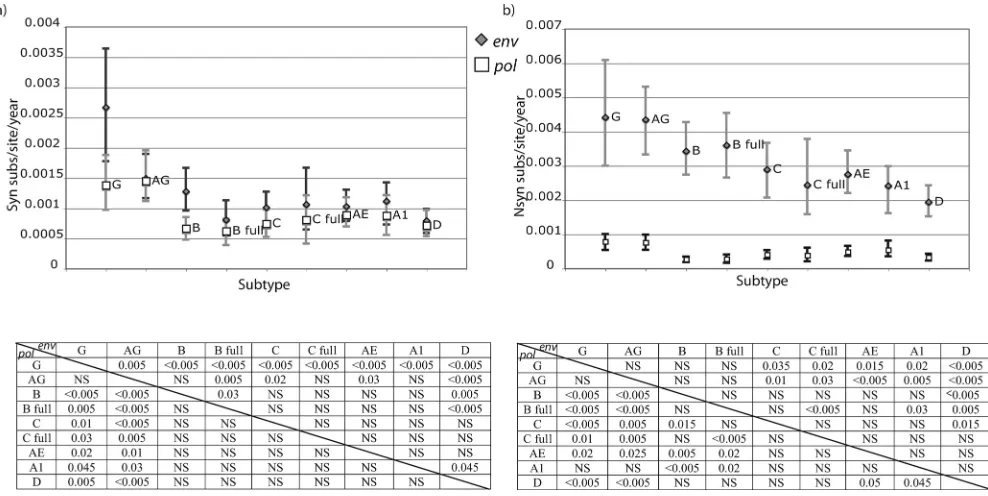
dS rates.We applied this method to our data set and ana-lyzed the dS and dN rates of each subtype forpol and env. Assuming that the dS rate is mostly a product of mutation rate and generation time, it is reasonable to assume thatpolandenv should result in similar dS rate estimates for each data set. This assumption was violated when we inferred a dS rate for all branches in the tree (data not shown). Because terminal branches, which represent both substitutions and the mutational load, may be responsible for this, we decided to summarize dN and dS rates for the internal branches. In this case, we found that the posterior distributions of the dS rates for the internal branches were approximately the same—with a slightly higher mean in env-–in most of the analyzed subtypes, except for subtypes B and G (P⬍0.005) and C (P⫽0.015) (Fig. 2a). The analysis of full-genome data sets allowed us to test the hypoth-esis that these differences were due to sampling errors between genomic regions. For subtypes B and C, we could collect such full-genome data sets since there is a reasonable number of publicly available sequences. Comparing the results of the full-genome data sets (B full and C full) with the other data sets collected independently for the two genomic regions, we found that for subtype C this difference was clearly maintained, while for subtype B the estimate for theenvdata set considerably decreased. Therefore, we suspect that our dS rate differences for subtype B may be due to sampling differences betweenpol andenv.
Comparing the dS rates across subtypes, it was evident that posterior estimates were higher for CRF02_AG inpol (P ⫽ 0.03 versus subtype A1), with a trend inenv(P⫽0.2 versus subtype B), and subtype G rates were higher than those for the other subtypes in bothpol(P⫽0.045 versus subtype A1) and env(P ⬍ 0.005 versus subtype B) (Fig. 2a). This indicates a higher mutation rate or shorter generation time for these sub-types than for the others.
[image:3.585.45.542.80.206.2]dN rates. Not surprisingly, the dN rates were found to be much higher inenvthan inpol(Fig. 2b). This can most prob-ably be attributed to the humoral immune pressure of the host, which results in a much faster accumulation of amino acid substitutions in env. CRF02_AG and subtype G presented a trend for higher dN rates than those for other subtypes (P⫽ 0.07 and 0.08, respectively, versus subtype A1 inpolandP⫽ 0.06 and 0.14, respectively, versus subtype B inenv), consistent with the dS rate estimates, probably indicating an important
TABLE 1. Data sets used in analyses ofpolandenvgenes of each of the CRFs/subtypes
Subtype/CRF
pol env
No. of
sequences Time span
a Sequence length
(nucleotides)b No. of
sequences Time span
a Sequence length
(nucleotides)b
CRF02_AG 113 1990–2005 792 62 1991–2003 843
CRF01_AE 84 1990–2006 787 95 1990–2006 825
A1 43 1985–2004 799 58 1985–2004 802
B 63 1983–2005 799 93 1982–2005 931
B (full genome) 43 1982–2005 799 43 1982–2005 931
C 83 1986–2005 799 102 1986–2005 864
C (full genome) 30 1989–2005 799 30 1989–2005 702
D 44 1985–2005 799 59 1983–2002 859
G 81 1992–2003 799 34 1992–2003 885
aYear of collection of the oldest sample to year of collection of the youngest sample. bLength in the alignment, after editing.
TABLE 2. Posterior distributions of tMRCAs for each subtype data seta
Subtype/CRF
tMRCA HPD forpol tMRCA HPD forenv
Mean Upper value
Lower value Mean
Upper value
Lower value
CRF01_AE 1,975.5 1,980.5 1,970.3 1,975.9 1,980.6 1,970.6 CRF02_AG 1,976.3 1,981.4 1,970.5 1,975.1 1,980.0 1,969.0 A1 1,954.2 1,967.7 1,939.7 1,954.6 1,968.7 1,940.3 B 1,960.3 1,968.5 1,950.6 1,959.2 1,966.5 1,950.9 B (full genome) 1,966.1 1,972.3 1,959.4 1,965.3 1,970.6 1,959.7 C 1,952.3 1,963.4 1,940.2 1,952.0 1,962.3 1,939.9 C (full genome) 1,955.3 1,971.8 1,933.9 1,955.0 1,971.5 1,934.4 D with prior 1,946.7 1,955.5 1,938.0 1,944.4 1,952.2 1,935.4 D without prior 1,857.0 1,932.8 1,751.0 1,854.1 1,931.2 1,749.9 G 1,969.7 1,978.3 1,959.9 1,969.3 1,977.3 1,959.9
a
The tMRCA was estimated using MCMC analysis, using the software BEAST. For all subtypes, the BSP method with a log normal relaxed-clock assumption was used, except for the poldata set of subtype D, where the exponential-growth demographic model was used instead of BSP. HPD, highest posterior density interval.
on November 8, 2019 by guest
http://jvi.asm.org/
[image:3.585.43.285.548.684.2]effect of mutation rate and replicative fitness on dN rates as well.
For env, subtype D presented a lower dN rate than those for all subtypes, except subtype A1 (P ⫽ 0.05 compared to CRF01_AE). Since we already found such a tendency in dS rates, we can speculate that this difference was due to a lower replicative fitness or mutation rate of subtype D (Fig. 2b).
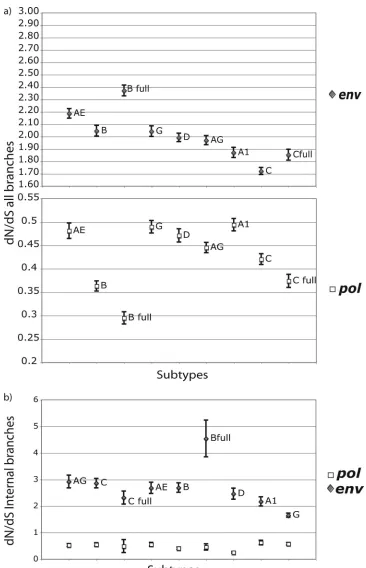
dN/dS ratio.Interestingly, the use of all branches of the tree versus using only the internal branches generated different dN/dS ratio estimates. This stresses the importance of remov-ing the terminal branches from the analysis, as we mentioned above. In Fig. 3a, we present the dN/dS ratios for subtypes when all branches of the posterior distribution of trees are included in the analysis, and in Fig. 3b, we present the dN/dS results when only internal branches are summarized. In both cases, the relative magnitudes of the dN/dS values for different subtypes vary between pol and env, indicating independent
selective pressure effects in each gene. On the other hand, the relative orders of the dN/dS ratios are different in Fig. 3a and b. As we mentioned above, the terminal branches of the tree are associated with an excess of mutations that do not neces-sarily reflect substitutions. We should stress here that the val-ues for the dN/dS ratios estimated here are not normalized for the proportions of synonymous and nonsynonymous substitu-tion sites in the data sets. Therefore, the dN/dS values are higher than those normally reported using the classical dN/dS estimation method, and importantly, a dN/dS value of 1 should not be interpreted as an expectation of neutrality. The relative orders of dN/dS ratios in the different subtypes did not reflect dS and dN rates separately. For example, despite the higher absolute dN and dS rates, subtype G presented a lower dN/dS value inenvthan those for all other subtypes (Fig. 3b). How-ever, we cannot draw any conclusions concerning the relative ordering of dN/dS rates between subtypes, since there are
FIG. 1. Total substitution rate and 95% CI for the posterior distribution estimated in the Bayesian MCMC analysis of each of the seven analyzed subtypes/CRFs forpol(white squares) andenv(gray diamonds). Only internal branches of the tree were included in this analysis. Substitution rate is presented as the number of expected substitutions per site per year. ThePvalues of significantly different distributions are presented for pairwise comparisons in the table below the plot.Pvalues for theenvdata set comparisons correspond to the upper right part of the matrix, whilepol Pvalues are presented in the lower left part of the matrix. AG, CRF02_AG; AE, CRF01_AE; A1, sub-subtype A1; B, subtype B; B full, subtype B full-genome data set; C, subtype C; C full, subtype C full-genome data set; D, subtype D; G, subtype G; NS, not significant.
on November 8, 2019 by guest
http://jvi.asm.org/
discrepancies both between the B and B full and between the C and C full data sets.
DISCUSSION
In this study, we performed a comparative analysis to inves-tigate the determinants of the rate of evolution of HIV-1 sub-types. We collected data sets representative of the geographic distribution of the most important epidemic subtypes, compris-ing sequences sampled over relatively long time intervals.
We found that the substitution rate varies between subtypes, with CRF02_AG and subtype G showing higher substitution rates in bothpolandenv.Compared to other subtypes, subtype B showed a lower substitution rate inpolthan in env. While this fact is difficult to explain, we can speculate that even though strains with drug resistance were excluded, our pol sample was derived to a greater part from patients undergoing therapy—and therefore representing viruses with lower repli-cation rates—than was the case for theenvdata set. In fact, the greatest motivation to sequence the pol region is to verify whether resistance is causing therapy failure, while the moti-vation to sequenceenvis more related to mapping the genetic variability of HIV worldwide, with samples taken less often from treated patients. However, substitution rates are influ-enced both by biological properties of the virus and by selective pressure, which we assume to be mostly immune selective pressure, with the former reflected in the dS rate and the latter in the dN rate. We estimated these parameters separately to
understand their differential contributions to the total substi-tution rate.
[image:5.585.45.539.68.316.2]dS rates were found to be similar inpolandenv, and some-times slightly elevated in the latter. This indicates that this parameter mostly reflects biological properties of the subtypes, such as mutation rate and generation time, and implicitly shows that the sample (data set) for each subtype was infor-mative—even though the sequences used were not from the same patients forpol and env, the results were similar—and that our method can efficiently separate dN and dS contribu-tions to the substitution process. However, the differences in dS rate betweenpolandenvfor subtypes B and G are intrigu-ing. It has been proposed in a previous study that the substi-tution rate of a strain is inversely proportional to the speed of transmission of the epidemic (16). Therefore, we suspect that these differences might be due to a nonrepresentative sampling of these subtypes in one or both of the genomic regions, with an overrepresentation of certain transmission groups. We tested this hypothesis by looking at two data sets that were derived from subtype B and C full-genome sequences and therefore comprisepolandenvsequences from the exact same patients. We found here that the differences betweenpol and env dS rates in subtype B were considerably decreased, indicating that especially for subtype B, there was a sampling problem affect-ing our estimations. On the other hand, for the other subtypes, we can assume that a representative sample was collected. Ideally, we should have always used sequences from the same patients for both genes. However, these are very difficult to
FIG. 2. Synonymous (a) and nonsynonymous (b) substitutions inpol(white squares) andenv(gray diamonds) for the analyzed subtypes and CRFs and 95% CI of the posterior distribution estimated in the Bayesian MCMC analysis. Only internal branches of the tree were included in this analysis. Substitution rate is presented as the number of expected substitutions per site per year (subs/site/year). ThePvalues of significantly different distributions are presented for pairwise comparisons in the table below the plot.Pvalues for theenvdata set comparisons correspond to the upper right part of the matrix, whilepol Pvalues are presented in the lower left part of the matrix. AG, CRF02_AG; AE, CRF01_AE; A1, sub-subtype A1; B, subtype B; B full, subtype B full-genome data set; C, subtype C; C full, subtype C full-genome data set; D, subtype D; G, subtype G; NS, not significant.
on November 8, 2019 by guest
http://jvi.asm.org/
obtain, as many samples sequenced inpolare not sequenced in envand vice versa. It can be speculated that some factors may have impacted the mutation rate differently inpolandenv, e.g., secondary structures or drug selective pressure. The first effect
could be expected to be consistent across most subtypes, while the latter may be more pronounced for subtype B than for other subtypes, since treatment is still predominantly a matter in developed countries affected mostly by subtype B. The fact
FIG. 3. (a) dN/dS ratios based on all branches of the tree for all subtypes/CRFs inpol(white squares) andenv(gray diamonds) and standard deviation of each estimate. (b) dN/dS ratios based only on internal branches of the tree for all subtypes/CRFs inpol(white squares) andenv(gray diamonds). dN/dS ratios were calculated from the global dN and dS absolute estimates of each of 200 analyzed trees.
on November 8, 2019 by guest
http://jvi.asm.org/
[image:6.585.108.474.64.632.2]that thepoldN rate was lower than expected according to the env results may indicate that by removing strains with drug selective pressure we have introduced a bias in our subtype B data set.
A previous study has shown that CRF02_AG has a higher replicative fitness than subtype B in vitro (18). Our result of a higher dS rate of CRF02_AG is consistent with a higher rep-licative fitness in vivo. The fact that subtype G showed similar dN and dS substitution rates to those of CRF02_AG and the fact that they are very closely related evolutionarily indicate that they have similar characteristics in vivo. It also appears from our study that the complicated and recently unraveled recombination history of these two strains did not affect the biological properties of these closely related strains (2).
Subtype D showed a tendency for lower dN and dS rates than those of other subtypes. Recent results showed a faster disease progression in subtype D infection (3, 13), in the light of which our results could be interpreted as showing that a lower evolutionary rate correlates with a higher level of virus pathogenesis. However, Lemey et al. showed that HIV-2, which is less pathogenic than HIV-1, has a lower substitution rate than HIV-1. Therefore, it may be that differences between HIV-1 and -2 are not necessarily transposable to differences between subtypes (15). These seemingly contradictory obser-vations are therefore a matter of further investigation.
The dN/dS ratio analysis revealed additional insights with respect to evolutionary patterns. For example, although this was not evident from the absolute dN and dS rates, subtype G showed a lower dN/dS ratio in env than those of all other subtypes. It is not that subtype G had a lower dN rate, but rather that the dS rate was high. While dN/dS ratios are com-monly used, it seems that measuring dN and dS rate parame-ters separately may be more informative for the biological properties of HIV-1. Indeed, taking into account the dS rate variation among genes has recently been shown to be impor-tant for comparative selective pressure analyses (17).
In conclusion, our results suggest that there are differences in the biological properties of HIV-1 subtypes, particularly in their replicative fitness and (immune) selective pressure. Fur-ther studies should be performed to better understand the impact of these differences in clinical issues such as pathogen-esis and the response to antiretrovirals.
ACKNOWLEDGMENTS
A.A. was supported by a Ph.D. grant from the Fundac¸a˜o para a Cieˆncia e Tecnologia (FCT) and by a research grant from the Instituto Gulbenkian de Ciencia (IGC). P.L. was supported by a postdoctoral fellowship from the Fund for Scientific Research (FWO) Flanders. This work was partially supported by an FWO grant (G.0513.06).
REFERENCES
1.Abecasis, A., A.-M. Vandamme, and P. Lemey.2007. Sequence alignment in HIV computational analysis, p. 2–16.InT. Leitner, B. Foley, B. Hahn, P. Marx, F. McCutchan, J. Mellors, S. Wolinsky, and B. Korber (ed.), HIV sequence compendium 2006/2007. Theoretical Biology and Biophysics Group, Los Alamos, NM.
2.Abecasis, A. B., P. Lemey, N. Vidal, T. de Oliveira, M. Peeters, R. Camacho, B. Shapiro, A. Rambaut, and A. M. Vandamme.2007. Recombination con-founds the early evolutionary history of human immunodeficiency virus type 1: subtype G is a circulating recombinant form. J. Virol.81:8543–8551. 3.Baeten, J. M., B. Chohan, L. Lavreys, V. Chohan, R. S. McClelland, L.
Certain, K. Mandaliya, W. Jaoko, and J. Overbaugh.2007. HIV-1 subtype D infection is associated with faster disease progression than subtype A in spite of similar plasma HIV-1 loads. J. Infect. Dis.195:1177–1180.
4.Choisy, M., C. H. Woelk, J. F. Guegan, and D. L. Robertson.2004. Com-parative study of adaptive molecular evolution in different human immuno-deficiency virus groups and subtypes. J. Virol.78:1962–1970.
5.de Oliveira, T., K. Deforche, S. Cassol, M. Salminen, D. Paraskevis, C. Seebregts, J. Snoeck, E. J. van Rensburg, A. M. Wensing, D. A. van de Vijver, C. A. Boucher, R. Camacho, and A. M. Vandamme.2005. An automated genotyping system for analysis of HIV-1 and other microbial sequences. Bioinformatics21:3797–3800.
6.Drummond, A. J., S. Y. Ho, M. J. Phillips, and A. Rambaut.2006. Relaxed phylogenetics and dating with confidence. PLoS Biol.4:e88.
7.Drummond, A. J., G. K. Nicholls, A. G. Rodrigo, and W. Solomon.2002. Estimating mutation parameters, population history and genealogy simulta-neously from temporally spaced sequence data. Genetics161:1307–1320. 8.Drummond, A. J., and A. Rambaut.2007. BEAST: Bayesian evolutionary
analysis by sampling trees. BMC Evol. Biol.7:214.
9.Drummond, A. J., A. Rambaut, B. Shapiro, and O. G. Pybus.2005. Bayesian coalescent inference of past population dynamics from molecular sequences. Mol. Biol. Evol.22:1185–1192.
10.Gilbert, M. T., A. Rambaut, G. Wlasiuk, T. J. Spira, A. E. Pitchenik, and M. Worobey.2007. The emergence of HIV/AIDS in the Americas and beyond. Proc. Natl. Acad. Sci. USA104:18566–18570.
11.Hemelaar, J., E. Gouws, P. D. Ghys, and S. Osmanov.2006. Global and regional distribution of HIV-1 genetic subtypes and recombinants in 2004. AIDS20:W13–W23.
12.Keele, B. F., F. Van Heuverswyn, Y. Li, E. Bailes, J. Takehisa, M. L. San-tiago, F. Bibollet-Ruche, Y. Chen, L. V. Wain, F. Liegeois, S. Loul, E. M. Ngole, Y. Bienvenue, E. Delaporte, J. F. Brookfield, P. M. Sharp, G. M. Shaw, M. Peeters, and B. H. Hahn.2006. Chimpanzee reservoirs of pan-demic and nonpanpan-demic HIV-1. Science313:523–526.
13.Kiwanuka, N., O. Laeyendecker, M. Robb, G. Kigozi, M. Arroyo, F. Mc-Cutchan, L. A. Eller, M. Eller, F. Makumbi, D. Birx, F. Wabwire-Mangen, D. Serwadda, N. K. Sewankambo, T. C. Quinn, M. Wawer, and R. Gray.2008. Effect of human immunodeficiency virus type 1 (HIV-1) subtype on disease progression in persons from Rakai, Uganda, with incident HIV-1 infection. J. Infect. Dis.197:707–713.
14.Korber, B., M. Muldoon, J. Theiler, F. Gao, R. Gupta, A. Lapedes, B. H. Hahn, S. Wolinsky, and T. Bhattacharya.2000. Timing the ancestor of the HIV-1 pandemic strains. Science288:1789–1796.
15.Lemey, P., S. L. Kosakovsky Pond, A. J. Drummond, O. G. Pybus, B. Shapiro, H. Barroso, N. Taveira, and A. Rambaut.2007. Synonymous sub-stitution rates predict HIV disease progression as a result of underlying replication dynamics. PLoS Comput. Biol.3:e29.
16.Maljkovic Berry, I., R. Ribeiro, M. Kothari, G. Athreya, M. Daniels, H. Y. Lee, W. Bruno, and T. Leitner.2007. Unequal evolutionary rates in the human immunodeficiency virus type 1 (HIV-1) pandemic: the evolutionary rate of HIV-1 slows down when the epidemic rate increases. J. Virol.81: 10625–10635.
17.Ngandu, N. K., K. Scheffler, P. Moore, Z. Woodman, D. Martin, and C. Seoighe.2008. Extensive purifying selection acting on synonymous sites in HIV-1 group M sequences. Virol. J.5:160.
18.Njai, H. F., Y. Gali, G. Vanham, C. Clybergh, W. Jennes, N. Vidal, C. Butel, E. Mpoudi-Ngolle, M. Peeters, and K. K. Arien.2006. The predominance of human immunodeficiency virus type 1 (HIV-1) circulating recombinant form 02 (CRF02_AG) in West Central Africa may be related to its replicative fitness. Retrovirology3:40.
19.Overbaugh, J., and C. R. Bangham.2001. Selection forces and constraints on retroviral sequence variation. Science292:1106–1109.
20.Pond, S. L., and S. D. Frost. 2005. A simple hierarchical approach to modeling distributions of substitution rates. Mol. Biol. Evol.22:223–234. 21.Pond, S. L., S. D. Frost, and S. V. Muse.2005. HyPhy: hypothesis testing
using phylogenies. Bioinformatics21:676–679.
22.Rambaut, A., D. Posada, K. A. Crandall, and E. C. Holmes.2004. The causes and consequences of HIV evolution. Nat. Rev. Genet.5:52–61.
23.Rhodes, T., H. Wargo, and W. S. Hu.2003. High rates of human immuno-deficiency virus type 1 recombination: near-random segregation of markers one kilobase apart in one round of viral replication. J. Virol.77:11193–11200. 24.Robbins, K. E., P. Lemey, O. G. Pybus, H. W. Jaffe, A. S. Youngpairoj, T. M. Brown, M. Salemi, A. M. Vandamme, and M. L. Kalish.2003. U.S. human immunodeficiency virus type 1 epidemic: date of origin, population history, and characterization of early strains. J. Virol.77:6359–6366.
25.Robertson, D. L., J. P. Anderson, J. A. Bradac, J. K. Carr, B. Foley, R. K. Funkhouser, F. Gao, B. H. Hahn, M. L. Kalish, C. Kuiken, G. H. Learn, T. Leitner, F. McCutchan, S. Osmanov, M. Peeters, D. Pieniazek, M. Salminen, P. M. Sharp, S. Wolinsky, and B. Korber.2000. HIV-1 nomenclature pro-posal. Science288:55–56.
26.Salemi, M., T. de Oliveira, M. A. Soares, O. Pybus, A. T. Dumans, A. M. Vandamme, A. Tanuri, S. Cassol, and W. M. Fitch.2005. Different epidemic potentials of the HIV-1B and C subtypes. J. Mol. Evol.60:598–605. 27.Salemi, M., K. Strimmer, W. W. Hall, M. Duffy, E. Delaporte, S. Mboup, M.
Peeters, and A. M. Vandamme. 2001. Dating the common ancestor of SIVcpz and HIV-1 group M and the origin of HIV-1 subtypes using a new method to uncover clock-like molecular evolution. FASEB J.15:276–278.
on November 8, 2019 by guest
http://jvi.asm.org/
28.Salminen, M. O., J. K. Carr, D. S. Burke, and F. E. McCutchan.1995. Identification of breakpoints in intergenotypic recombinants of HIV type 1 by bootscanning. AIDS Res. Hum. Retrovir.11:1423–1425.
29.Schmidt, H. A., K. Strimmer, M. Vingron, and A. von Haeseler.2002. TREE-PUZZLE: maximum likelihood phylogenetic analysis using quartets and parallel computing. Bioinformatics18:502–504.
30.Seo, T. K., J. L. Thorne, M. Hasegawa, and H. Kishino. 2002. A viral sampling design for testing the molecular clock and for estimating evolu-tionary rates and divergence times. Bioinformatics18:115–123.
31.Shapiro, B., A. Rambaut, and A. J. Drummond.2006. Choosing appropriate substitution models for the phylogenetic analysis of protein-coding se-quences. Mol. Biol. Evol.23:7–9.
32.Swofford, D.1998. PAUP* 4.0—phylogenetic analysis using parsimony (*and other methods). Sinauer Associates, Sunderland, MA.
33.Thompson, J. D., D. G. Higgins, and T. J. Gibson.1994. CLUSTAL W: improving the sensitivity of progressive multiple sequence alignment through sequence weighting, position-specific gap penalties and weight matrix choice. Nucleic Acids Res.22:4673–4680.
34.Walker, P. R., O. G. Pybus, A. Rambaut, and E. C. Holmes.2005. Compar-ative population dynamics of HIV-1 subtypes B and C: subtype-specific differences in patterns of epidemic growth. Infect. Genet. Evol.5:199–208. 35.Worobey, M., M. Gemmel, D. E. Teuwen, T. Haselkorn, K. Kunstman, M.
Bunce, J. J. Muyembe, J. M. Kabongo, R. M. Kalengayi, E. Van Marck, M. T. Gilbert, and S. M. Wolinsky.2008. Direct evidence of extensive diversity of HIV-1 in Kinshasa by 1960. Nature455:661–664.
36.Zhu, T., B. T. Korber, A. J. Nahmias, E. Hooper, P. M. Sharp, and D. D. Ho. 1998. An African HIV-1 sequence from 1959 and implications for the origin of the epidemic. Nature391:594–597.