on Enveloped Virions by Using Confocal Micro-Raman Spectroscopy
Xiaonan Lu,a,bQian Liu,cJavier A. Benavides-Montano,c,eAnthony V. Nicola,c,dD. Eric Aston,fBarbara A. Rasco,bHector C. Aguilarc,d Key Laboratory of Food Nutrition and Safety, Ministry of Education of China, Tianjin University of Science and Technology, Tianjin, Chinaa; School of Food Science,
Washington State University, Pullman, Washington, USAb; Paul G. Allen School for Global Animal Healthcand Department of Veterinary Microbiology and Pathology,d
College of Veterinary Medicine, Washington State University, Pullman, Washington, USA; Departamento de Ciencia Animal, Universidad Nacional de Colombia sede Palmira, Palmira, Valle, Colombiae; Department of Chemical Engineering and Materials Engineering, University of Idaho, Moscow, Idaho, USAf
Conformational changes in the glycoproteins of enveloped viruses are critical for membrane fusion, which enables viral entry into cells and the pathological cell-cell fusion (syncytia) associated with some viral infections. However, technological capabili-ties for identifying viral glycoproteins and their conformational changes on actual enveloped virus surfaces are generally scarce, challenging, and time-consuming. Our model, Nipah virus (NiV), is a syncytium-forming biosafety level 4 pathogen with a high mortality rate (40 to 75%) in humans. Once the NiV attachment glycoprotein (G) (NiV-G) binds the cell receptor ephrinB2 or -B3, G triggers conformational changes in the fusion glycoprotein (F) that result in membrane fusion and viral entry. We dem-onstrate that confocal micro-Raman spectroscopy can, within minutes, simultaneously identify specific G and F glycoprotein signals and receptor-induced conformational changes in NiV-F on NiV virus-like particles (VLPs). First, we identified reproduc-ible G- and F-specific Raman spectral features on NiV VLPs containing M (assembly matrix protein), G, and/or F or on NiV/ve-sicular stomatitis virus (VSV) pseudotyped virions via second-derivative transformations and principal component analysis (PCA). Statistical analyses validated our PCA models. Dynamic temperatuinduced conformational changes in F and G or re-ceptor-induced target membrane-dependent conformational changes in F were monitored in NiV pseudovirionsin situin real time by confocal micro-Raman spectroscopy. Advantageously, Raman spectroscopy can identify specific protein signals in rela-tively impure samples. Thus, this proof-of-principle technological development has implications for the rapid identification and biostability characterization of viruses in medical, veterinary, and food samples and for the analysis of virion glycoprotein con-formational changesin situduring viral entry.
C
onformational changes in the glycoproteins of enveloped vi-ruses are essential for membrane fusion, a critical step during both viral entry and the pathognomonic cell-cell fusion (syncytia) associated with many viral infections, such as those of the paramyxoviruses. However, technologies that detect glycoprotein conformational changes on actual enveloped virions are difficult and time-consuming for those viruses for which such detection is possible (1–6). Additionally, there is a great need for rapid iden-tification and characterization of virions in medical, veterinary, or food samples. Having a method with these capabilities would ad-vance the fields of virus diagnosis and analysis.Our model, Nipah virus (NiV), is an enveloped virus in the importantParamyxoviridaefamily, which comprises human and veterinary enveloped viruses such as measles virus, mumps virus, Newcastle disease virus, respiratory syncytial virus, canine distem-per virus, the metapneumoviruses, the human parainfluenza vi-ruses, Hendra virus (HeV), and NiV (6–8). NiV is an emerging zoonotic virus in theHenipavirusgenus that causes severe illness in humans, characterized by encephalitis and respiratory disease associated with syncytium formation (7,9). Although NiV causes 40 to 75% mortality in humans, there is no approved treatment; thus, NiV is classified as a biosafety level 4 agent and a priority pathogen in the NIH/NIAID agenda. Additionally, because paramyxoviruses are relatively stable in aerosols and NiV is capa-ble of animal-to-animal, animal-to-human, and human-to-hu-man transmission, NiV is considered a potential agro- and/or bio-terrorism agent (7).
Conformational changes of the viral glycoproteins are required for viral entry and cell-cell fusion. However, it is difficult to obtain
X-ray crystal structural information from intact full-length glyco-proteins because their hydrophobic transmembrane regions are embedded in a lipid membrane. Therefore, structural studies have been skewed toward ectodomain glycoprotein forms because it is relatively more straightforward to obtain structural information for them. Viral glycoprotein conformational changes have typi-cally been observed either by analysis of viral glycoprotein soluble ectodomain forms (e.g., see references10–12) or by analysis of full-length wild-type glycoproteins expressed on cell surfaces (e.g., see reference13). Although soluble ectodomains normally bind their respective cell receptors, it is often not possible to assess how accurately their structures and structural changes compare with those of their membrane-bound full-length wild-type counter-parts. Moreover, the tendency of soluble glycoprotein ectodo-mains to adopt postfusion conformations in many cases limits our ability to detect and characterize essential glycoprotein receptor-induced conformational changes (12,14). Analysis of receptor-induced conformational changes of full-length wild-type glyco-proteins embedded in cellular or viral membranes is preferred, and even for such analyses, there may be differences in the roles of the receptor-induced conformational changes in cell-cell versus
Received19 November 2012Accepted23 December 2012 Published ahead of print2 January 2013
Address correspondence to Hector C. Aguilar, [email protected].
Copyright © 2013, American Society for Microbiology. All Rights Reserved.
doi:10.1128/JVI.03220-12
on November 7, 2019 by guest
http://jvi.asm.org/
virus-cell membrane fusion. Therefore, detection of conforma-tional changes on the surface of actual viral particles is highly desirable but currently not common due to technical limitations (1–5) and to our knowledge has not been accomplished for the paramyxoviruses.
Furthermore, current available techniques for identification of viruses include transmission electron microscopy (TEM) (15), PCR (16), cell culture (17), and enzyme-linked immunosorbent assays (ELISAs) (18). However, these techniques require compli-cated and/or time-consuming methods for sample preparation and relatively large numbers of virions for identification. Raman spectroscopy is widely used for protein characterization, charac-terizing analytes by compiling vibrational properties of a wide range of functional groups together and providing information about chemical constituents of biological samples (19). Raman spectroscopy has also been employed to investigate nonviral pro-tein structural variations (20). Recently, surface-enhanced Raman scattering (SERS) spectroscopy and tip-enhanced Raman scatter-ing (TERS) spectroscopy have been employed to identify and dis-criminate different types of viruses, such as Poxviridaevirions (21), measles viruses (22), rotavirus (23), respiratory syncytial vi-ruses (24,25), tobacco mosaic virus (26), and avipoxvirus (27). Moreover, for nonenveloped viruses, Raman spectroscopy has made identification of single viral particles possible (26). How-ever, to our knowledge, the identification of the exact viral protein to which each Raman spectral signal corresponds has not been reported for viruses that contain one or multiple surface glycopro-teins, such as the paramyxoviruses.
In this study, we employed confocal micro-Raman spectros-copy to identify and characterize the individual glycoproteins on the membranes of either NiV virus-like particles (VLPs) or NiV/ vesicular stomatitis virus (VSV) pseudotyped virions. For NiV, F and G are the envelope glycoproteins essential for membrane fu-sion during both viral entry into host cells and pathognomonic cell-cell fusion (syncytium formation) following an infection (28– 31). The G glycoprotein recognizes and binds to ephrinB2 and ephrinB3 receptors on host cell membranes (32–35). We previ-ously reported the kinetics for the conformational cascade in NiV-F that starts with cell receptor binding to NiV-G, which trig-gers F from a prefusion form to a prehairpin intermediate and subsequently to a six-helix bundle conformation that mediates membrane fusion (13,36).
In the current study, we employed Raman spectroscopy, prin-cipal component (PC) analysis (PCA), and chemometric methods to successfully discriminate glycoproteins (i.e., F and G) on the membrane of NiV VLPs or NiV/VSV pseudotyped virions (19, 37). In addition, dynamic receptor- or temperature-induced con-formational changes of these glycoproteins on NiV pseudovirions were monitoredin situby using a Raman spectroscopy-based two-dimensional (2D) correlation synchronous plotting method. Our ability to produce NiV VLPs and pseudovirions that contained either none, one, or both glycoproteins allowed us to, as a proof-of-principle, both identify individual F and G spike “fingerprints” on these virus particles and demonstrate that Raman spectroscopy can be used to study receptor- and/or temperature-induced gly-coprotein conformational changes on these viral particles. Our results promise to expedite the important studies of glycoprotein conformational changes that occur during membrane fusion and viral entry on actual viral particles for the paramyxoviruses and for other enveloped virus families.
MATERIALS AND METHODS
Expression plasmids.PCDNA3.1 plasmids expressing the NiV-M (38), NiV-F, and NiV-G (39) codon-optimized genes were previously con-structed and reported to express relatively high levels of their respective proteins (29,34,38,39). The green fluorescent protein (GFP) expression plasmid was also previously reported (13,36).
Cell culture.Chinese hamster ovary (CHO) cells (CHOpgsA745) and African green monkey kidney epithelial cells (Vero) were cultivated in minimal essential medium alpha with 10% fetal bovine serum (FBS). 293T cells were cultured in Dulbecco’s modified Eagle’s medium with 10% FBS. PK13-B2 cells were selected for stable expression of ephrinB2 using G418, and a syncytium assay was used to select a PK13-B2 subclone that expressed high levels of ephrinB2.
Virion preparation and purification.NiV VLPs were produced in different cell lines, CHO, 293T, or Vero cells, as previously described (38). Briefly, cells were transfected with equal amounts of codon-optimized NiV-M, -F, and -G expressed in PCDNA3.1 expression plasmids, and viruses were purified from the viral supernatants, as described below. NiV/VSV pseudotyped virions were produced as we previously reported (28,29,34,35). Briefly, 293T cells were transfected with equal amounts of F and G expression plasmids and 24 h later were infected with VSV virions that contained theRenillaluciferase gene in place of VSV-G (VSV-rLuc). Virus supernatants were collected at 24 h posttransfection or postinfec-tion for the NiV VLPs or NiV/VSV pseudotyped virions, respectively, and viral particles were purified by ultracentrifugation through a sucrose cushion of 20% in NTE buffer (150 mM NaCl, 40 mM Tris-HCl [pH 7.5], and 1 mM EDTA [pH 8.0]) and subsequently resuspended in NTE buffer. Electron microscopy and Western blot analysis.The incorporation of M, F, and G into the virus-like particles was confirmed by electron microscopy (uranyl acetate and phosphotungstic acid staining, as de-scribed previously [38]) and by Western blot analysis using specific anti-AU1 and anti-hemagglutinin (HA) tag antibodies at 1:2,000 and 1:4,000 dilutions, respectively, as previously described (28,29).
Virus sample preparation for spectral collection.The purified viral samples were transferred from an ice bath directly onto a glass microarray slide coated with a thin film of gold (Thermo Scientific Inc., Waltham, MA). This gold-coated microarray slide has low fluorescence, providing a high signal-to-noise ratio, and is highly compatible with green laser (532.5 nm) biophotonic applications. The viral samples on the gold-coated mi-croarray slide were immediately put onto the confocal microscope stage for Raman spectral collection.
Raman instrumentation.Confocal micro-Raman spectroscopic anal-ysis was performed by using a WITec alpha300 Raman microscope (WITec, Ulm, Germany) equipped with a UHTS-300 spectrometer. The spectrometer has an entrance slit of 50m and a confocal length of 300 mm and is equipped with a 600-line/mm grating with a 532.5-nm laser power of 12-mW incident light on the viral samples. The Raman-scattered light was detected by using a 1,600- by 200-pixel charge-coupled-device (CCD) array detector. The size of each pixel was 16m by 16m. A Nikon 100⫻objective focused the laser light onto the viral samples. An integration time of 15 s (3-s integration time with 5 signal averages) was used for virus spectral collection. Thezdisplacement was controlled by a piezotransducer on the objective. WITec Control v1.5 software (WITec, Ulm, Germany) was employed over a simultaneous wave number shift range of 3,700 to 200 cm⫺1in an extended mode.
Spectral preprocessing.Raw micro-Raman spectra contain spectral interferences, including fluorescence background of the biological sam-ples, CCD background noise, Gaussian noise, and cosmic noise (40). The background correction was first performed by using a polynomial back-ground fit, as described previously by Lieber and Mahadevan-Jansen (41). This procedure can minimize the effect of different background profiles caused by fluorescence of the biological samples on gold-coated microar-ray slides and the thermal fluctuations on the CCD detector. Spectral binning (2 cm⫺1) was performed, followed by smoothing using a
Savitzky-Golay algorithm (9 point).
on November 7, 2019 by guest
http://jvi.asm.org/
Spectral reproducibility.Spectral reproducibility was determined by calculating the differentiation index (Dy1y2) value, as described in our
previous studies (19,37). LowerDy1y2values indicate greater
reproduc-ibility of the Raman spectra for biological samples (19). Generally,Dy1y2
values of⬍1,000 correspond to adequate reproducibility. The spectral reproducibility of each group (MFG, MF, MG, MPCDNA3, and PCDNA [M is matrix protein, F is fusion protein, G is attachment protein, and PCDNA is PCDNA 3.1⫹, DNA vector]) was calculated by usingDy1y2
values. The MFG, MF, MG, and MPCDNA3Dy1y2values were all⬍150,
indicating significant reproducibility of the Raman spectral features (19). Furthermore, spectra of both fresh NiV samples and frozen and then thawed NiV samples were collected (data not shown), and spectral repro-ducibility was suitable (Dy1y2value of⬍300). These data indicated that the
Raman spectral features were not affected by a single freeze-thaw cycle. Spectral selectivity.Selectivity was calculated as previously described (19). Selectivity values greater than 1 were obtained and thus were con-sidered to be significant for segregating biological samples based upon differences in their spectral features (19).
Second-derivative transformations of Raman spectra.The varia-tions between the spectral features of closely related biological samples are small, and second-derivative transformations visually separate overlap-ping bands, eliminate baseline offsets, increase the apparent spectral res-olution, and magnify minor spectral variations, making interpretation of spectral results easier (42).
Classification models.Principal component analysis (PCA) was em-ployed to establish a two-dimensional cluster model for segregation of viral glycoproteins on the basis of the identified major principal nents responsible for spectral variation, with the first principal compo-nent (PC1) contributing more than the second principal compocompo-nent (PC2), etc., to the observed differences between spectra (43). This classi-fication procedure maximizes the variance between groups and mini-mizes the variance within a group. The variance can be quantified as a Mahalanobis distance, which measures intergroup variation and is de-fined asM1,2⫽(x1⫺x2)S⫺1(x1⫺x2), whereSis the pooled estimate of
the within-group covariance matrix andx1andx2are mean vectors for the
two groups. Thus,M1,2is the distance between groups in units of
within-group standard deviations (44). The relative locations of the signals on the plot are a result of the relative concentrations of the sources of each signal (e.g., F, G, and M, in each total sample) and do not correlate with the identity of the signal. Therefore, the locations in the PCA plot will vary for the specific protein signals among viral preparations (for example, from distinct cell types). The parameter that measures the distinctiveness be-tween signals is the Mahalanobis distance bebe-tween given signal groups, as explained above.
Following this analysis, a Bayesian probability approach was employed to validate the selection of principal components using PCA for a multi-variate chemometric cluster model to discriminate glycoproteins on the NiV virions. The formula of Bayes’ rule for conditional probabilities can be expressed as
P(Bi|A)⫽ P(Bi)P(A|Bi) ⌺
k⫽1 n
P(Bk)P(A|Bk)
(i⫽1, 2, . . .,n)
whereAandBare two events (i.e.,Ais the hypothesis andBis data), and the basic principle is that a factor with a large variance has a higher prob-ability for construction of a chemometric model than a factor with a small variance (45). The application of the Bayesian probability approach to construction of chemometric cluster-based models for infrared and Ra-man spectroscopy of bacteria has been extensively demonstrated by our group and others (37,46). Additionally, Monte Carlo estimation was per-formed to determine the stability of the cluster models created by the Bayesian probability approach. In this study, random models were con-structed, and the variability of the intracluster distances was calculated. The inverse of the average variance was expressed as stability (47).
Two-dimensional correlation Raman spectroscopy. Two-dimen-sional (2D) correlation Raman spectroscopy, a cross-correlation method,
was employed to monitor dynamic behavior of glycoproteins on NiV virions, indicating the conformational changes of these glycoproteins (i.e., G and F glycoproteins) under specific perturbation and observed as changes in Raman spectral features. This correlation method can amplify minor spectral variations by dispersing the spectral data in a second di-mension (42). Two types of 2D correlation Raman spectroscopy are com-mon, synchronous and asynchronous. For synchronous spectra, the au-topeaks are derived from self-correlated dynamic Raman signals and are on-diagonal (1⫽ 2), indicating the degree of sensitivity of Raman
spec-tra under a specific external perturbation; the cross-peaks are off-diagonal (1⫽ 2) and indicate the intramolecular or intermolecular interactions
among functional groups. Autopeaks are always positive, while cross-peaks may be positive or negative (48). If the two overlapped Raman-scattered bands in one-dimensional spectra are derived from different functional groups, the variations can be shown as two clearly independent bands in the two-dimensional spectra.
The 2D correlation method described previously by Noda (48) was employed in the current study, and calculations were programmed and performed with Matlab, using the following algorithm:
⌽(v1, v2)⫽ 1 n⫺1y
T(v 1) ·y(v2)
where⌽is the 2D synchronous spectrum,1and2are two spectral
channels,yis the vector, andnis the number of signals in the original data set. The one-dimensional spectra used for the 2D correlation analysis are the averages of three replicates, with spectral collection at different loca-tions within a biological sample.
Statistical analysis of replicate samples.The experiments were per-formed for at least three independent replicate trials. Significant differ-ence (P ⬍ 0.05) was determined by one-way analysis of variance (ANOVA) following thettest in Matlab.
Validating the feasibility of the Raman spectral subtraction method. The wave number region of 1,800 cm⫺1to 650 cm⫺1(i.e., fingerprint
region) (Fig. 1C) was selected for further study because this region had the best signal reproducibility, as evidenced by the lowest Dy1y2 values
(⬍300). For example, an addition of the aliphatic band at 2,850 cm⫺1or
the division of this fingerprint region into subregions resulted in a signif-icant (P⬍0.05) increase ofDy1y2values (⬎1,000), reducing spectral
re-producibility. To compensate for potential variations in the total amount of organic matter in the various viral samples, normalization was per-formed based upon the most intensive band (in the fingerprint region) at 1,460 cm⫺1.
Bayesian probability analysis.We used Bayesian probability analysis to compare the top 10 significant features of M, F, and G expressed as principal components (PCs) determined by using a PCA model. PCs are a construct that compares the importance of certain variations in spectral features to the difference between two biochemical substances, in this case glycoproteins on the surface of the viral membrane. We found substantial agreement between the results of the two methods. The stability of the PCA model was determined by using three different Monte Carlo estima-tions, one using the 10 most significant features, a second with the 10 least significant features, and one in which all features were selected and com-pared. The highest stability of the PCA model was derived from the use of the 10 most significant features (0.58⫾0.08). A model with a slightly lower stability (0.51⫾0.1) was achieved when all features were selected, indicating the contribution of nonsignificant features and possibly inter-ference and noise. The lowest-stability model was obtained when the 10 least significant features (stability, 0.05⫾0.02) were used.
F-triggering assay.We previously reported an F-triggering assay and performed it here basically as previously described (13,36). Briefly, CHO cells cotransfected with NiV-F, NiV-G, and GFP expression plasmids were mixed with PK13 cells stably expressing ephrinB2 (PK13B2 cells) to allow NiV-G/ephrinB2 receptor binding and to synchronize the membrane fu-sion cascade at 4°C for 90 min. These cell mixtures were then incubated at 37°C, 25°C, or 4°C for 60 min in the presence or absence of a biotinylated
on November 7, 2019 by guest
http://jvi.asm.org/
HR2 NiV-F-mimicking peptide. HR2 peptide binding was detected by using the secondary fluorescent reagent neutravidin Dylight 649 (Thermo-Fisher) by flow cytometry. Live cells highly expressing GFP (well transfected) were gated to enrich the strengths of the Dylight 649 fluorescent signals. The amounts of biotinylated HR2 peptide bound to NiV-F were calculated for each temperature as the difference between the Dylight 649 fluorescence signals in the presence and absence of the bio-tinylated HR2 peptide. These differences were then normalized to the result obtained at 37°C, set at 100%.
RESULTS
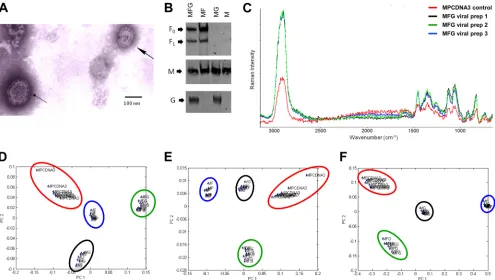
Raman spectral features of Nipah virus glycoproteins F and G on virus-like particles are reproducible.We and others previ-ously reported that NiV VLPs can be purified from supernatants of mammalian cells transiently expressing NiV-M, -F, and -G (38, 49–51). Thus, we produced and purified NiV VLPs by transfecting 293T cells with equal amounts of codon-optimized NiV-M, -F, and -G expression plasmids, just as previously reported (38). Con-ventional negative-staining transmission electron microscopy of purified NiV VLPs revealed their glycoprotein spikes (Fig. 1A). Importantly, we previously showed the functionality of these NiV VLPs in virus binding and virus-cell entry assays (38). The incor-poration of the M, F, and G proteins into the purified NiV VLPs was confirmed by Western blotting (Fig. 1B).
The Raman spectral features of three distinct NiV MFG VLP sample preparations and a negative-control sample (MPCDNA3), obtained from an identical sucrose purification of supernatants from 293T cells transfected with only the M and mock PCDNA3.1 expression plasmids, are shown inFig. 1C. Visually, the reproduc-ibility of the Raman signals appeared adequate. To statistically assess the reproducibility of the Raman spectral features of VLPs containing MFG, MF, MG, or the negative-control MPCDNA3.1 VLPs, the Raman signals were subjected to principal component analyses (PCAs) (Fig. 1D). In these analyses, the higher the repro-ducibility, the tighter the clusters of data obtained from replicate samples. PCAs revealed tight clusters for the different data groups (MFG, MF, MG, and MPCDNA3), showing that the reproducibil-ity of the Raman signals for the various samples tested was statis-tically significant. For example,Fig. 1Dreveals that the intragroup spectral variation of the MPCDNA3 bald VLP samples (compar-ison of multiple MPCDNA3.1 samples) was significantly (P⬍
0.01) smaller than the intergroup spectral variation (comparison of MPCDNA3.1 samples to MFG, MF, or MG samples). The Ma-halanobis distances computed between groups ranged from 23.07 to 44.36. Clusters with Mahalanobis interclass distance values higher than 3 are considered to be significantly different from each other (44). Therefore, the PCA model validated the feasibility of FIG 1Raman spectroscopy signals of NiV VLPs. (A) Electron micrograph of NiV VLPs obtained from 293T cells expressing NiV-M, -F, and -G glycoproteins. The NiV-F and -G spikes are marked by black arrows. (B) Western blot analysis of total proteins in NiV VLPs. Briefly, VLPs generated by 293T cells were denatured and detected with a rabbit anti-AU1 monoclonal antibody against AU1-tagged NiV-F (top), a mouse anti-flag monoclonal antibody against flag-tagged NiV-M (middle), and a mouse anti-HA monoclonal antibody against HA-flag-tagged NiV-G (bottom). One of three representative experiments is shown. (C) Raman spectral features of NiV VLPs. The spectrum in red is PCDNA3 (negative control), and spectra in black, green, and blue are three independently produced NiV VLP samples generated in 293T cells. (D to F) Principal component analysis (PCA) validates the significant variations of Raman spectra of different types of NiV VLPs (i.e., MFG, MF, MG, and M) produced in various cell lines: 293T cells (D), Vero cells (E), and CHO cells (F). The relative locations of the signals on the plot are a result of the relative concentrations of the sources of each signal (e.g., F, G, and M, in each total sample) and do not correlate with the identity of the signal. Therefore, the locations in the PCA plot will vary for the specific protein signals among viral preparations (for example, from distinct cell types). The parameter that measures the distinctiveness between signals is the Mahalanobis distance between given signal groups (explained in Materials and Methods). Data points are circled to simplify their identification. Red, MPCDNA3; blue, MF; black, MG; green, MFG.
on November 7, 2019 by guest
http://jvi.asm.org/
[image:4.585.45.540.66.346.2]Raman spectroscopy to obtain reproducible viral sample spectral features (Fig. 1D).
In addition, to assess whether the Raman spectral features of NiV VLPs were cell dependent, NiV virions were prepared and purified from two additional cell lines (Chinese hamster ovary [CHO] cells and African green monkey kidney epithelial [Vero] cells), and their corresponding Raman spectra were collected and analyzed. We observed similar overall NiV VLP Raman spectral features regardless of the cell line used to produce the VLPs, and PCA models could discriminate among different VLP samples (MFG, MF, MG, and MPCDNA3), regardless of their different cell line sources (293T cells [Fig. 1D], Vero cells [Fig. 1E], and CHO cells [Fig. 1F]). The intergroup spectral variations among MFG, MF, MG, and MPCDNA3 (computed between the centroids of groups) were significantly (P⬍0.05) larger than intragroup spec-tral variations based on the calculated Mahalanobis distance (17.52 to 52.28). These statistical analyses showed the feasibility of obtaining reproducible viral glycoprotein Raman spectra regard-less of the cell line utilized to produce the NiV VLPs.
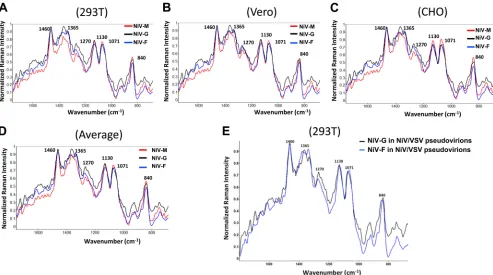
Validating the feasibility of the Raman spectral subtraction method.The wave number region of 1,800 cm⫺1to 650 cm⫺1 (i.e., fingerprint region) (Fig. 1C) was selected for further study because this region had the best signal reproducibility (see Mate-rials and Methods). Spectral subtraction was performed to obtain specific NiV protein signals (i.e., M⫽MPCDNA3⫺PCDNA3, F⫽
MF⫺MPCDNA3, and G⫽MG⫺MPCDNA3). The Raman spec-tral features of the M, F, and G proteins on NiV VLPs produced in distinct cell lines (i.e., 293T, Vero, and CHO cells) are shown inFig. 2. Additional subtraction formulas, such as F⫽MFG⫺MG or G⫽ MFG⫺MF, confirmed the data obtained with the original subtrac-tion formulas (data not shown). The spectral reproducibility of the Raman signals of the M, F, and G proteins on NiV VLPs were calcu-lated as described in Materials and Methods.Dy1y2values of⬍1,000
correspond to adequate reproducibility. The reproducibility of the specific protein signals from NiV VLPs produced in different cell cultures was significant based upon theDy1y2values obtained (⬍270)
(Fig. 2AtoC). These values indicate the feasibility of relying upon the reproducibility of Raman spectra to obtain specific signals for specific NiV VLP proteins even when these were obtained from VLP samples produced in distinct cell types. To further illustrate this conclusion, Fig. 2Dshows the average of the Raman spectral features obtained for M, F, and G from the three different cell lines, revealing an adequate spectral reproducibility (Dy1y2value of⬍650).
In addition, to discern whether the presence of core viral pro-teins or RNA would have an effect on the specific NiV-F and -G viral glycoprotein signals, we produced NiV/VSV pseudotyped virions from 293T cells, just as previously reported (28,29,34,35). We then subjected the NiV/VSV pseudovirions to Raman spectro-scopic analysis and obtained the Raman spectral features of NiV-F and -G from those pseudovirions (Fig. 2E). The reproducibility of FIG 2Raman spectral features of M, F, and G proteins on NiV VLPs cultivated in 3 different cell lines. (A to C) The Raman spectral signals for M, F, and G glycoproteins were obtained from mathematical subtraction of the respective Raman signals. For example, the F signals were obtained from subtracting the MG signals from the MFG signals and by subtracting the M signals from the MF signals. Similarly, the G signals were obtained by subtracting the MF signals from the MFG signals and by subtracting the M signals from the MG signals. Comparison of the two types of subtractions was performed and yielded nearly identical patterns (Dy1y2value of less than 300, indicating high spectral reproducibility). NiV VLPs were produced from 293T cells (A), Vero cells (B), and CHO cells (C). (D) Average of virus-like particle signals produced from three distinct cell cultures. Calculation of spectral reproducibility (Dy1y2value of⬍650) showed no significantly different signals derived from the 3 cell lines. (E) NiV-G and NiV-F signals were obtained similarly as described above for panels A to C but by subtracting NiV-G/VSV from VSV bald-particle Raman signals or NiV-F/VSV from VSV bald-particle Raman signals. At least 3 independent experiments were performed to gather each Raman spectrum.
on November 7, 2019 by guest
http://jvi.asm.org/
[image:5.585.45.538.66.341.2]the NiV-F and -G spectral features between the NiV VLPs and the NiV/VSV pseudotyped virions produced in 293T cells was pro-nounced, with aDy1y2value of⬍400. These data indicate that the
Raman spectral features of the NiV-F and -G glycoproteins are reproducible independently of the type of viral particles that con-tain them and independently of the presence of other viral pro-teins or nucleic acid in those particles.
Importantly, wavelength number differences were observed among the Raman spectral features of different viral proteins (i.e., M, F, and G) (Fig. 2). Standard band assignments (wavelength numbers) of Raman spectra for NiV structural features are listed inTable 1. These band assignments corresponded to both protein and glycan features, in agreement with those originating from the NiV M protein and the F and G glycoproteins. The differences in the M, F, and G Raman features were further analyzed to (i) con-firm whether these features could be used to reproducibly distin-guish among M, F, and G signals and (ii) study whether these signals could be used to study conformational changes in the F and G glycoproteins induced by temperature or by receptor binding to the VLPs or pseudovirions.
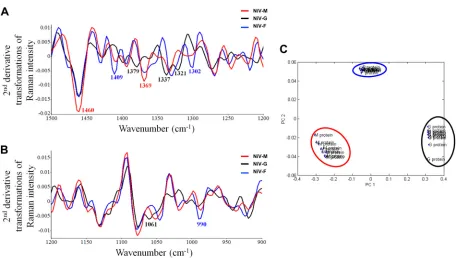
[image:6.585.41.286.80.293.2]Differentiation of Raman spectral features for specific NiV glycoproteins. Second-derivative-transformed Raman spectral features of different NiV glycoproteins are shown inFig. 3. Spec-tral selectivity was calculated before performing second-derivative transformations (see Materials and Methods), and the spectral selectivity values obtained indicated the feasibility of using sec-ond-derivative transformations for differentiating distinct pro-teins on NiV VLPs (37). Significant (P⬍0.01) band variations between the M, F, and G viral proteins are summarized inTable 1. These bands have the potential of serving as indicators for real-time monitoring of conformational changes of glycoproteins on NiV membranes. In general, the wave number region from 1,500 to 1,200 cm⫺1contained spectral features corresponding mainly to secondary structural features of proteins (Fig. 3AandTable 1), while wave numbers of 1,200 to 900 cm⫺1contained spectral fea-tures corresponding mainly to polysaccharides (Fig. 3BandTable 1). Comparison ofFig. 3BandAshows that, in general, secondary TABLE 1Assignment of Raman bands of NiV glycoproteins
Spectrum and wave
no. (cm⫺1) Assignment
Raw
840 Glucose-saccharide band
1,071 Glucose-saccharide band
1130 C-C skeletal stretch transformation
1,270 Amide III bands in protein
1,365 Tryptophan, protein
1,460 CH2/CH3deformation of proteins and saccharides
2nd derivative
990 C-C stretch of carbohydrate
1,061 C-C in-plane bending of carbohydrate 1,302 ␦(CH2) twisting or wagging of protein
1,321 ␣-Helix of amide III
1,337 Amide III and CH2wagging vibrations from glycine backbone
1,369 Protein structure
1,379 ␦CH3symmetric (lipid assignment)
1,409 sCOO⫺from proteins
1,460 CH2/CH3deformation of lipids and proteins
FIG 3Second-derivative transformation analyses of Raman spectral features reveal clear specific M, F, and G spectral peaks. (A) Second-derivative transfor-mation of Raman spectral features (1,500 to 1,200 cm⫺1) of M, F, and G proteins on NiV VLPs (from the Vero cell line). (B) Second-derivative transformation of Raman spectral features (1,200 to 900 cm⫺1) of M, F, and G proteins on NiV VLPs (from the Vero cell line). (C) A representative PCA classification model was established and cross-validated to differentiate NiV proteins (n⫽4). Data points are circled to simplify their identification. Blue, F protein; black, G protein; red, M protein.
on November 7, 2019 by guest
http://jvi.asm.org/
[image:6.585.64.521.416.674.2]protein structural variations appeared to be more important for differentiating NiV glycoproteins than polysaccharide variations. The clear separation (P⬍0.05) between the M, F, and G gly-coprotein Raman signals by PCA (Fig. 3C) indicates that the spec-tral features of these glycoproteins are unique and have discernible Raman spectra. The Mahalanobis interclass distances ranged from 13.26 to 29.71, computed between the centroids of groups for each glycoprotein. In addition, we employed Bayesian probability anal-ysis to compare the top 10 significant features of M, F, and G (principal components [PCs]) determined by using a PCA model (see Materials and Methods). Taken together, these mathemati-cal analyses validated the choice of the selected M, F, and G spectral features for PCA model establishment and for the fol-lowing studies.
Monitoring temperature-induced conformational changes of G and F glycoproteins on NiV VLPs and NiV/VSV pseudovi-rions. Confocal micro-Raman spectroscopy was employed to monitor the conformational changes of NiV-G and -F glycopro-teins on NiV/VSV pseudovirions. We looked for potential tem-perature- and/or receptor-induced conformational changes in the glycoproteins on the NiV/VSV pseudovirions, and we found both. Temperature treatment alone has been reported to be able to in-duce conformational changes in viral glycoproteins, as shown, for example, in a previous study for a soluble paramyxovirus F glyco-protein (12). By technical necessity, in this study, we had to subject our pseudovirions to room temperature while looking for recep-tor-induced conformational changes in their glycoproteins. Therefore, we compared the Raman signal changes of the NiV/ VSV pseudovirion glycoproteins induced by temperature alone (as an important control) to the receptor-induced Raman signal changes. If significant differences were observed between the two treatments, by definition those differences would be due to recep-tor-induced conformational changes in the glycoproteins. In ad-dition, viral glycoprotein conformational changes usually occur rather quickly; for example, we previously reported that at 37°C, receptor-induced conformational changes in full-length NiV-F (prehairpin intermediate formation) on cell surfaces occurred within a few minutes (36).
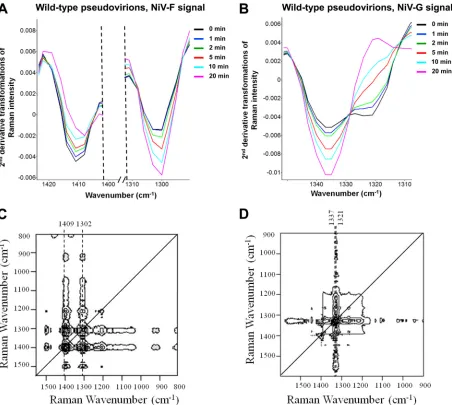
Thus, we first monitored the temperature-induced conforma-tional changes of G and F glycoproteins on NiV/VSV pseudoviri-ons preincubated at 4°C over a 20-min period at 25°C as changes in the second-derivative transformations of the G- or F-specific Raman spectral features. We focused our analysis on bands at 1,409 cm⫺1(sCOO⫺chemical group from proteins) and 1,302
cm⫺1[␦(CH
2) for protein twisting or wagging] for the F
glycopro-tein and on bands at 1,321 cm⫺1(␣-helix of amide III) and 1,337 cm⫺1(amide III and CH
2wagging vibrations from the glycine
backbone) for the G glycoprotein, shown inFig. 3Ato be promi-nent spectral features for differentiation of F and G on pseudovi-rion surfaces. For F, the band intensity at 1,409 cm⫺1decreased (upward movement) while the band intensity at 1,302 cm⫺1
in-creased (downward movement) with increasing temperature treatment times (Fig. 4A). For G, the band intensity at 1,321 cm⫺1
decreased (upward movement) while the band intensity at 1,337 cm⫺1 increased (downward movement) with increasing
treat-ment times (Fig. 4B). Taken together, these data indicate that confocal micro-Raman spectroscopy can monitor temperature-induced conformational changes in both G and F glycoproteins on NiV/VSV pseudovirionsin situ. Thus, this method provides a sig-nificant advantage over other methods, by monitoring
conforma-tional changes of intact viral glycoproteins on actual enveloped virions in their native state and in real time. These results may have implications for the future monitoring of the biostability of viruses in medical, veterinary, and/or food samples, even at room temperatures.
To further explore the potential of employing confocal micro-Raman spectroscopy to monitor dynamic conformational changes of F and G glycoproteins on NiV particle surfaces, 2D correlation synchronous spectra were investigated (Fig. 4CandD; also see Materials and Methods). Previous works by Ashton et al. (42) and Brewster et al. (43) validated the feasibility of performing 2D correlation Raman spectroscopy to monitor the dynamic con-formational changes of glycosylation and phosphorylation in pro-teins. 2D correlation Raman spectroscopy data indicate the rela-tive levels of change of a given spectral feature (or chemical group) in time and space. For the F glycoprotein, two autopeaks were observed at⬃1,409 and 1,302 cm⫺1(Fig. 4C), indicating that the
intensities of these bands changed with an increase in treatment time (0 to 20 min) at 25°C. For the G glycoprotein, two adjacent autopeaks were observed at⬃1,321 and 1,337 cm⫺1(Fig. 4D), indicating a similar conclusion as that drawn for F. These results correlated well with the band variations observed using second-derivative transformations (Fig. 4AandB). In addition, another cross-peak was observed at⬃1,210 cm⫺1for the F glycoprotein (Fig. 4C), corresponding to a C-C6H5stretching mode in tyrosine
and phenylalanine (20). This spectral variation was not apparent in the second-derivative transformations of one-dimensional spectra, showing the increased selectivity of 2D correlation spec-troscopy to monitor dynamic conformational changes of glyco-proteins.
Monitoring receptor-induced conformational changes on NiV glycoproteins.We previously reported that ephrinB2-con-taining VSV pseudovirions (VSV-B2 or reversed pseudotyped vi-rions) were capable of inducing membrane fusion and viral entry on cells expressing NiV-F and -G (28). Thus, we mixed NiV/VSV pseudovirions with VSV-B2 pseudovirions for 1 h at 4°C to allow G/B2 receptor binding, as we previously reported that incubation at 4°C allows receptor binding but not membrane fusion. There-fore, an incubation of F/G-containing membranes with receptor-containing membranes at 4°C can be used to synchronize the membrane fusion and viral entry events (13,36). To distinguish with certainty Raman spectral feature changes induced by temper-ature from receptor-induced conformational changes relevant to membrane fusion, we additionally replaced wild-type NiV/VSV pseudovirions with NiV/VSV-G mutant pseudovirions. The mu-tant pseudovirions contained a G mumu-tant glycoprotein (28,29) that we previously characterized as capable of being incorporated into NiV/VSV pseudovirions and capable of binding the ephrinB2 receptor similarly to wild-type NiV-G but incapable of triggering F to induce membrane fusion or viral entry (13).
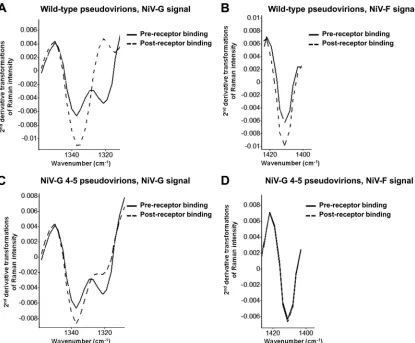
Raman spectral features were collected for wild-type NiV/VSV pseudovirions and NiV-G mutant NiV/VSV pseudovirions, and the spectral subtraction described above was performed, yielding spectral features of NiV-F and -G glycoproteins.Figure 5shows the second-derivative-transformed Raman spectral features of F and G glycoproteins (for either the wild-type or G 4-5 fusion mu-tant NiV/VSV pseudovirions) with or without incubation with ephrinB2 receptor at 4°C and then with incubation at 25°C. For the wild-type NiV/VSV pseudovirions, spectral variations at 1,321 cm⫺1and 1,337 cm⫺1for the G glycoprotein (Fig. 5A) were
on November 7, 2019 by guest
http://jvi.asm.org/
served to be similar to those induced by temperature treatment in Fig. 4B. However, for NiV-F, the conformational change induced by receptor binding at 1,409 cm⫺1 (receptor plus temperature condition) occurred in the opposite direction (downward) (Fig. 5B) from that observed with temperature treatment alone (up-ward) (Fig. 4A, left). These data suggest that receptor binding induced a specific and different F glycoprotein Raman signature compared to the conformational change induced by temperature alone. Importantly, this experiment suggests that confocal micro-Raman spectroscopy can detect a receptor-triggered conforma-tional change in a full-length fusion glycoprotein embedded in a pseudovirus particle.
To confirm that this change in the 1,409-cm⫺1F glycoprotein Raman signal direction was induced by receptor binding to the G glycoprotein (subsequently triggering the F glycoprotein), we
sub-jected the G 4-5 mutant glycoprotein pseudovirions to an identi-cal Raman spectroscopy analysis as that for the wild-type NiV/ VSV pseudovirions. We observed that for the G 4-5 mutant pseudovirions, the band variations at 1,321 cm⫺1and 1,337 cm⫺1
for the G glycoprotein were similar to those of the wild-type pseu-dovirions although to a somewhat lesser extent (Fig. 5C). How-ever, there was no change observed for the F glycoprotein Raman band at 1,409 cm⫺1(Fig. 5D). This result supports the notion
that although the G glycoprotein mutant was capable of bind-ing to ephrinB2 (13), it did not induce a conformational change in the F glycoprotein that resulted in membrane fusion. Therefore, a receptor-induced conformational change in F was de-tectable by Raman spectroscopy in wild-type NiV pseudovirions but not in NiV-G fusion mutant pseudovirions, suggesting that confocal micro-Raman spectroscopy can monitor the receptor-induced con-FIG 4Energy input results in the detection of G and F glycoprotein conformational variations in NiV/VSV pseudovirions. (A) F glycoprotein conformational variations were monitored by using the featured Raman bands at wave numbers of 1,409 cm⫺1and 1,302 cm⫺1at different time intervals at room temperature (25°C). Different colors denote selective time intervals. (B) G glycoprotein conformational variations were monitored by using the featured Raman bands at wave numbers of 1,337 cm⫺1and 1,321 cm⫺1at different time intervals at room temperature (25°C). Different colors denote selective time intervals. (C and D) Raman spectroscopy-based 2D correlation synchronous plot as a function of spectral wave number for F glycoprotein (C) and G glycoprotein (D). Gray shading indicates negative cross-peaks, and no shading indicates positive cross-peaks (n⫽5).
on November 7, 2019 by guest
http://jvi.asm.org/
[image:8.585.67.519.66.471.2]formational changes of glycoproteins on viral particlesin situand in real time.
A receptor-induced conformational change in NiV-F can oc-cur at 25°C, and it depends on the presence of a target mem-brane. The receptor-induced conformational changes that we observed by Raman spectroscopy for NiV-F on NiV/VSV pseudo-virions were detected at 25°C. Conformational changes of soluble fusion proteins were previously detected at temperatures higher than 37°C (e.g., see reference12). However, it is well known that class I fusion proteins (such as HIV-1 gp41) can undergo a con-formational change from the prefusion to the prehairpin interme-diate at 23°C to 27°C (52,53). Thus, to confirm the biological relevance of the Raman spectroscopic conformational change that we observed for NiV-F, we performed a NiV-F-triggering assay to confirm that a receptor-induced conformational change in NiV-F can occur at 25°C. We previously reported a NiV-F-triggering assay capable of trapping and quantifying the receptor-induced formation of the prehairpin intermediate of NiV-F at 37°C but not at 4°C. This flow cytometry cell-based assay quantifies the binding
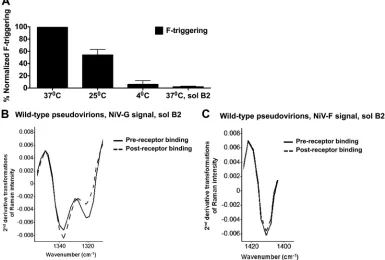
of a biotinylated peptide that mimics the HR2 region of NiV-F to NiV-F under triggering conditions. Here, we utilized this assay to learn whether the NiV-F glycoprotein can be triggered to undergo a conformational change from a prefusion to a prehairpin inter-mediate at 25°C. As observed for other class I fusion proteins, NiV-F underwent conformational changes from a prefusion to a prehairpin intermediate at 25°C, at levels of approximately 50% of the levels of NiV-F triggering at 37°C (Fig. 6A). These data further suggest that the conformational change detected for NiV-F in pseudovirions at 25°C by Raman spectroscopy is likely prehairpin intermediate formation.
To further investigate whether prehairpin intermediate forma-tion for NiV-F can be induced by soluble ephrinB2 unanchored to a target membrane, we performed our F-triggering assay using a soluble ephrinB2-Fc molecule that we previously reported to be capable of binding NiV-G and inducing a conformational change in NiV-G (13,34). In our previous report, soluble ephrinB2 bind-ing to NiV-G induced a conformational change detected by 3 in-dependent assays: enhanced binding of monoclonal antibody FIG 5Raman spectroscopy detects a receptor-induced conformational change in NiV-F in pseudotyped virions. (A) Conformational variation of the NiV-G glycoprotein in pseudovirions prebound to ephrinB2 receptor, prior to or after a 3-min incubation at 25°C. The NiV-G spectroscopic signal changes correlate with the temperature-induced conformational changes observed for NiV-G inFig. 4B. (B) Conformational variation and stability of the NiV-F glycoprotein in viral particles prebound to ephrinB2 receptor, prior to or after a 3-min incubation at 25°C. The Raman signals on the 1,409-cm⫺1peak of NiV pseudovirions switched to the opposite orientation from those induced by temperature for the same 1,409-cm⫺1peak in NiV-F inFig. 4A, indicating that Raman spectroscopy can detect a receptor-induced conformational change in NiV-F. (C) Similar experiment as in panel A, except that it was performed with viral particles containing the G fusion mutant 4-5 (13). This mutant is capable of receptor binding but incapable of triggering F to induce membrane fusion. (D) Similar experiment as in panel B, except that it was performed with viral particles containing the G fusion mutant 4-5 (13) (n⫽5).
on November 7, 2019 by guest
http://jvi.asm.org/
[image:9.585.85.500.66.409.2]Mab45 to NiV-G, circular dichroism, and detection of enhanced F/G dissociation (13). Interestingly, we observed that soluble eph-rinB2 was incapable of inducing prehairpin intermediate forma-tion in NiV-F (Fig. 6A). These data suggest that in the absence of a target membrane, although conformational changes in NiV-G can occur (13), the prehairpin intermediate of NiV-F either does not occur or is not stable. The latter may be likely, because the pre-hairpin intermediate may need to insert its hydrophobic fusion peptide into the target membrane to be stable.
To corroborate the need for a target membrane for the NiV-F conformational changes in virions, we subjected our NiV/VSV pseudovirions to our Raman spectroscopy analysis using soluble ephrinB2. As with the F-triggering cell-based assays, soluble ephrinB2 induced conformational changes in G (Fig. 6B) but was unable to induce a conformational change in NiV-F (Fig. 6C). Our results suggest that for both cell-based and virus-based assays, induction of the NiV-F prehairpin intermediate requires the pres-ence of a target membrane.
DISCUSSION
It is well established that the glycoproteins of enveloped viruses, regardless of the family to which they belong, are responsible for cell-cell fusion and viral entry. Membrane fusion is therefore es-sential in the life cycle of enveloped viruses (reviewed in references 9and6). However, many of the steps in the cascade of conforma-tional changes that glycoproteins undergo during viral entry and
the syncytium formation that follows an infection remain unclear (6,8,9). The receptor-induced conformational changes that en-veloped glycoproteins undergo during membrane fusion have re-mained of great interest in the last couple of decades. An under-standing of such glycoprotein conformational changes can lead, and is already leading, to the development of antiviral drugs that block viral entry. For example, enfuvirtide is an FDA-approved drug currently used against HIV-1 to block a conformational change of the fusion protein gp41, required for membrane fusion (54, 55). Therefore, an understanding of the receptor-induced conformational changes that enveloped virus glycoproteins un-dergo during membrane fusion will likely expand the repertoire of potential antiviral therapeutic targets and agents. Identifying such conformational changes in a rapid fashion offers many potential applications in the field of virology. To our knowledge, this is the first study to employ confocal micro-Raman spectroscopy to de-tect distinct glycoproteins and simultaneously analyze conforma-tional changes of these glycoproteins while they are embedded on enveloped VLPs or pseudovirions. This new technology is partic-ularly suitable for studies of viral glycoprotein conformational changes, as instrument responses are rapid.
Methods that can monitor the processes that glycoproteins on actual virions undergo after cell receptor binding are generally lacking. These processes are critical to our understanding of the pathology of enveloped viruses (6). For example, for the paramyxoviruses, what we currently know about receptor-in-FIG 6A receptor-induced conformational change in NiV-F can occur at 25°C and depends on the presence of a target membrane. (A) F-triggering assay. Briefly, CHO cells transfected with NiV-F, NiV-G, and GFP were mixed with receptor-containing PK13B2 cells at 4°C for 90 min. Subsequently, cell mixtures were incubated at 37°C, 25°C, or 4°C for 60 min in the presence or absence of biotinylated HR2 peptide, and the amount of HR2 binding was calculated at each temperature. In the experiment labeled 37°C, sol B2, soluble ephrinB2-Fc replaced PK13B2 cells. The averages of data from 3 experiments⫾standard deviations are shown. (B) Conformational variation of NiV-G upon binding to soluble ephrinB2. Shown is an experiment similar to that inFig. 5A, except that it was performed in the presence of soluble ephrinB2-Fc instead of ephrinB2/VSV reversed pseudotyped virions. (C) Conformational variation of NiV-F upon NiV/VSV pseudovirion binding to soluble ephrinB2. Shown is an experiment similar to that inFig. 5B, except that it was performed in the presence of soluble
ephrinB2-Fc instead of ephrinB2/VSV reversed pseudotyped virions (n⫽3).
on November 7, 2019 by guest
http://jvi.asm.org/
[image:10.585.99.484.72.332.2]duced conformational changes in their enveloped glycoproteins has been studied primarily by using soluble glycoprotein forms (6, 12) or glycoproteins expressed on cell surfaces (6,9,13,56). Al-though those studies are quite valuable, they do not necessarily replicate what happens in a virion. In contrast, the glycoproteins in the virion envelope have a truly native conformation: full length, embedded in the membrane, and in the proper context with other envelope proteins. Although there are viruses for which assays have been developed to study conformational changes in virions (e.g., see references1–5), by far, these methods tend to be complex and time-consuming. In this study, we developed a method for studying viral glycoprotein conformational changes in virionsin situthat is selective, accurate, and rapid enough to be appropriate for dynamic conformational studies conducted in real time.
Raman spectroscopy has been widely employed to investigate protein dynamics and conformational changes but rarely in stud-ies of viruses. For example, Raman spectroscopic methods have been used to investigate protein structure (57); alpha-helix hydra-tion in polypeptides, proteins, and viruses (58–62); polypeptide and carbohydrate structures of glycoproteins (63); carbohydrate characterization (64); and the molecular structures of proteins (62, 63, 65–67). Raman spectroscopy has been validated as a highly accurate and reliable method to monitor and determine protein secondary structural variationsin situ, such as folding and orientation (68,69), glycosylation status (43), phosphorylation status (42, 70), and posttranslational modifications (71). The overall secondary structures of the glycosylated and deglycosy-lated forms of soluble glycoprotein C of herpes simplex virus were differentiated by using conventional Raman spectroscopy (72). In recent studies, surface-enhanced Raman scattering (SERS) was able to detect binding of viral nucleoproteins to anti-influenza virus aptamers (73,74).
However, to our knowledge, this is the first study to employ confocal micro-Raman spectroscopy to simultaneously detect distinct glycoproteins and analyze specific viral glycoprotein con-formational changes on enveloped VLPs, pseudovirions, or any type of viral particlesin situ. The instrument response is rapid. For example, structural changes of proteins occurring within a pico-second-to-millisecond range have been successfully monitored by using UV Raman spectroscopy (75). Other important protein conformational changes, such as alpha-helix peptide folding and unfolding, can be monitored by using UV resonance Raman spec-troscopy on a nanosecond time scale (68). Although the present study involved measurements at less frequent intervals, measure-ments on the order of milliseconds are clearly possible and may be appropriate in studies where detailed kinetics of glycoprotein binding and/or conformational changes is important.
Additionally, Raman spectroscopy is amenable to applications such as cell receptor binding to viral particles, where the ability to obtain dynamic measurements is important. Green laser (510- to 570-nm) light, as employed in this study (532 nm), has been shown to be well suited to studies measuring protein conforma-tional changes, including flow-induced conformaconforma-tional changes to proteins (76), as well as investigations of conformational changes to proteins on the sarcoplasmic reticulum membrane (77). These studies provided evidence that Raman spectroscopy using this frequency range would be appropriate for studies of conformational changes in proteins occurring on the surface of virus particles and that dynamic and time-dependent
measure-ments are feasible. In addition, monitoring the conformational changes of a single protein molecule by Raman spectroscopy is possible, as indicated in a recent study in which the conforma-tional changes of single photoactive yellow protein molecules un-der photoexcitation were detected (78).
Differences in conformational changes observed for the glyco-proteins studied here depended upon how these conformational changes were induced. This study is among the first to describe the differences in the conformational changes and their rates induced by receptor binding versus temperature. An understanding of the dynamics of protein conformational changes on these glycopro-teins may assist with the design of inactivation protocols involving heat, chemical substances, or both, which could improve decon-tamination treatments. In addition, inactivated viruses are often used for vaccine development. However, the challenge in using inactivated viruses as vaccines relies on the need to inactivate vi-ruses completely to make them safe while simultaneously preserv-ing intact the viral epitopes that give rise to protective immune responses (79,80). The rapid Raman spectroscopy technology de-veloped in our study thus has the potential of assisting in the characterization of inactivated viruses for vaccine development.
Our discoveries also corroborate confocal micro-Raman troscopy as a suitable technology to identify viruses. Raman spec-troscopy has the potential to supplant current methods for virus identification, which are lengthy and complicated, once a spectral library of the surface proteins of virions of many families is well established. More importantly, as a part of this study, we showed that Raman spectroscopy techniques are able to not only identify viruses and their specific glycoproteins but also simultaneously be incorporated into studies of the crucial biophysical and biochem-ical properties associated with viruses, such as binding to cell re-ceptors.
Because of our capability to prepare VLPs or pseudovirions that contained either one or multiple viral protein types, in the present study, we also show for the first time that confocal micro-Raman spectroscopy can identify specific and distinctive glyco-protein signals in viral particles comprised of multiple glycopro-teins. One can envision that with the aid of novel isolation techniques (e.g., aptamer and molecularly imprinted polymers) and nanotechnology for signal enhancement, a portable Raman spectrometer with an appropriate virus library could be used in the field to identify specific viruses and viral proteins in food, medical, or veterinary samples within a short time period follow-ing isolation. Although Raman spectroscopy is currently accessi-ble to most researchers, improvements in laser design and manu-facture should make Raman spectroscopy more readily accessible in the field.
Importantly, our studies show that confocal micro-Raman spectroscopy can monitor receptor-induced conformational changes in viral glycoproteins. Potentially, this may provide a sim-pler and more rapid method for monitoring how hypo- or hyper-fusogenic enveloped virus mutants function either during cell-cell fusion or viral entry. Important to the biology of NiV, we showed that a receptor-induced conformational change detected for NiV-F on pseudovirions by Raman spectroscopy occurred at 25°C and was therefore likely related to prehairpin intermediate forma-tion. Both a cell-based flow cytometry F-triggering assay and a pseudovirion-based Raman spectroscopy assay showed this, cor-roborating the biological significance of the NiV-F conforma-tional changes observed. Moreover, the receptor-induced
on November 7, 2019 by guest
http://jvi.asm.org/
mational changes in NiV-F required the presence of a target membrane; thus, we speculate that the prehairpin intermediate requires a target membrane to insert into and stabilize. Impor-tantly, similar results were shown by both cell-based (F-trigger-ing) and virus-based (Raman) assays, underlining the biological significance of a target membrane to stabilize the prehairpin in-termediate of the membrane fusion cascade.
In summary, in the present study, we show the feasibility of performing confocal micro-Raman spectroscopy to detect and discriminate glycoproteins on NiV particles with multiple glyco-proteinsin situ. In addition, we observed that dynamic conforma-tional variations of glycoproteins on NiV pseudovirions could be monitored in real time by using Raman spectroscopic techniques. The technologies described here provide fast and sensitive meth-ods to study both temperature- and receptor-induced conforma-tional changes. These technologies open new avenues for exami-nation of viral glycoproteins during syncytium formation and/or viral entry. Our studies have implications for the examination of inactivation of virions upon temperature or chemical treatment during vaccine development and can measure the biostability of virions in medical, veterinary, or food samples. Therefore, our discoveries have the potential of expediting advances in the fields of virus identification, virus decontamination, viral vaccine devel-opment, and virus entry.
ACKNOWLEDGMENTS
This work was supported by NIH grant AI094329 to H.C.A., NIH grant AI096103 to A.V.N., and funds awarded to B.A.R. from the National In-stitute of Food and Agriculture (grant AFRI 2011-68003-20096) and the Washington State University Agricultural Research Center.
REFERENCES
1.Cardone G, Brecher M, Fontana J, Winkler DC, Butan C, White JM, Steven AC.2012. Visualization of the two-step fusion process of the ret-rovirus avian sarcoma/leukosis virus by cryo-electron tomography. J. Vi-rol.86:12129 –12137.
2.Dollery SJ, Delboy MG, Nicola AV.2010. Low pH-induced conforma-tional change in herpes simplex virus glycoprotein B. J. Virol.84:3759 – 3766.
3. Dollery SJ, Wright CC, Johnson DC, Nicola AV. 2011. Low-pH-dependent changes in the conformation and oligomeric state of the pre-fusion form of herpes simplex virus glycoprotein B are separable from fusion activity. J. Virol.85:9964 –9973.
4.He L, Piper A, Meilleur F, Hernandez R, Heller WT, Brown DT.2012. Conformational changes in Sindbis virus induced by decreased pH are revealed by small-angle neutron scattering. J. Virol.86:1982–1987. 5.Tran EEH, Borgnia MJ, Kuybeda O, Schauder DM, Bartesaghi A, Frank
GA, Sapiro G, Milne JLS, Subramaniam S.2012. Structural mechanism of trimeric HIV-1 envelope glycoprotein activation. PLoS Pathog. 8:e1002797. doi:10.1371/journal.ppat.1002797.
6.White JM, Delos SE, Brecher M, Schornberg K.2008. Structures and mechanisms of viral membrane fusion proteins: multiple variations on a common theme. Crit. Rev. Biochem. Mol. Biol.43:189 –219.
7.Eaton BT, Broder CC, Middleton D, Wang LF.2006. Hendra and Nipah viruses: different and dangerous. Nat. Rev. Microbiol.4:23–35. 8.Lamb RA, Paterson RG, Jardetzky TS.2006. Paramyxovirus membrane
fusion: lessons from the F and HN atomic structures. Virology344:30 –37. 9.Aguilar HC, Iorio RM.2012. Henipavirus membrane fusion and viral
entry. Curr. Top. Microbiol. Immunol.359:79 –94.
10. Albertini AA, Merigoux C, Libersou S, Madiona K, Bressanelli S, Roche S, Lepault J, Melki R, Vachette P, Gaudin Y.2012. Characterization of monomeric intermediates during VSV glycoprotein structural transition. PLoS Pathog.8:e1002556. doi:10.1371/journal.ppat.1002556.
11. Li L, Jose J, Xiang Y, Kuhn RJ, Rossmann MG.2010. Structural changes of envelope proteins during alphavirus fusion. Nature468:705–708. 12. Russell CJ, Jardetzky TS, Lamb RA.2001. Membrane fusion machines of
paramyxoviruses: capture of intermediates of fusion. EMBO J.20:4024 – 4034.
13. Aguilar HC, Ataman ZA, Aspericueta V, Fang AQ, Stroud M, Negrete OA, Kammerer RA, Lee B.2009. A novel receptor-induced activation site in the Nipah virus attachment glycoprotein (G) involved in triggering the fusion glycoprotein (F). J. Biol. Chem.284:1628 –1635.
14. Yin HS, Paterson RG, Wen X, Lamb RA, Jardetzky TS.2005. Structure of the uncleaved ectodomain of the paramyxovirus (hPIV3) fusion pro-tein. Proc. Natl. Acad. Sci. U. S. A.102:9288 –9293.
15. Goldsmith CS, Miller SE.2009. Modern uses of electron microscopy for detection of viruses. Clin. Microbiol. Rev.22:552–563.
16. Mahony JB.2008. Detection of respiratory viruses by molecular methods. Clin. Microbiol. Rev.21:716 –747.
17. Leland DS, Ginocchio CC.2007. Role of cell culture for virus detection in the age of technology. Clin. Microbiol. Rev.20:49 –78.
18. Harry DJ, Jennings MB, Yee J, Carlson JR.1989. Antigen detection for human immunodeficiency virus. Clin. Microbiol. Rev.2:241–249. 19. Lu X, Rasco BA, Kang DH, Jabal JM, Aston DE, Konkel ME.2011.
Infrared and Raman spectroscopic studies of the antimicrobial effects of garlic concentrates and diallyl constituents on foodborne pathogens. Anal. Chem.83:4137– 4146.
20. Tuma R.2005. Raman spectroscopy of proteins: from peptides to large assemblies. J. Raman Spectrosc.36:307–319.
21. Alexander TA.2008. Development of methodology based on commer-cialized SERS-active substrates for rapid discrimination of Poxviridae vi-rions. Anal. Chem.80:2817–2825.
22. Hoang V, Tripp RA, Rota P, Dluhy RA.2010. Identification of individ-ual genotypes of measles virus using surface enhanced Raman spectros-copy. Analyst135:3103–3109.
23. Driskell JD, Zhu Y, Kirkwood CD, Zhao Y, Dluhy RA, Tripp RA.2010. Rapid and sensitive detection of rotavirus molecular signatures using sur-face enhanced Raman spectroscopy. PLoS One5:e10222. doi:10.1371 /journal.pone.0010222.
24. Shanmukh S, Jones L, Driskell J, Zhao Y, Dluhy R, Tripp RA.2006. Rapid and sensitive detection of respiratory virus molecular signatures using a silver nanorod array SERS substrate. Nano Lett.6:2630 –2636. 25. Shanmukh S, Jones L, Zhao YP, Driskell JD, Tripp RA, Dluhy RA.2008.
Identification and classification of respiratory syncytial virus (RSV) strains by surface-enhanced Raman spectroscopy and multivariate statis-tical techniques. Anal. Bioanal. Chem.390:1551–1555.
26. Cialla D, Deckert-Gaudig T, Budich C, Laue M, Moller R, Naumann D, Deckert V, Popp J.2009. Raman to the limit: tip-enhanced Raman spec-troscopic investigations of a single tobacco mosaic virus. J. Raman Spec-trosc.40:240 –243.
27. Hermann P, Hermelink A, Lausch V, Holland G, Moller L, Bannert N, Naumann D.2011. Evaluation of tip-enhanced Raman spectroscopy for characterizing different virus strains. Analyst136:1148 –1152.
28. Aguilar HC, Matreyek KA, Choi DY, Filone CM, Young S, Lee B.2007. Polybasic KKR motif in the cytoplasmic tail of Nipah virus fusion protein modulates membrane fusion by inside-out signaling. J. Virol.81:4520 – 4532.
29. Aguilar HC, Matreyek KA, Filone CM, Hashimi ST, Levroney EL, Negrete OA, Bertolotti-Ciarlet A, Choi DY, McHardy I, Fulcher JA, Su SV, Wolf MC, Kohatsu L, Baum LG, Lee B.2006. N-glycans on Nipah virus fusion protein protect against neutralization but reduce membrane fusion and viral entry. J. Virol.80:4878 – 4889.
30. Bossart KN, Wang LF, Eaton BT, Broder CC.2001. Functional expres-sion and membrane fuexpres-sion tropism of the envelope glycoproteins of Hen-dra virus. Virology290:121–135.
31. Bossart KN, Wang LF, Flora MN, Chua KB, Lam SK, Eaton BT, Broder CC.2002. Membrane fusion tropism and heterotypic functional activities of the Nipah virus and Hendra virus envelope glycoproteins. J. Virol. 76:11186 –11198.
32. Bonaparte MI, Dimitrov AS, Bossart KN, Crameri G, Mungall BA, Bishop KA, Choudhry V, Dimitrov DS, Wang LF, Eaton BT, Broder CC.2005. Ephrin-B2 ligand is a functional receptor for Hendra virus and Nipah virus. Proc. Natl. Acad. Sci. U. S. A.102:10652–10657.
33. Negrete OA, Chu D, Aguilar HC, Lee B.2007. Single amino acid changes in the Nipah and Hendra virus attachment glycoproteins distinguish eph-rinB2 from ephrinB3 usage. J. Virol.81:10804 –10814.
34. Negrete OA, Levroney EL, Aguilar HC, Bertolotti-Ciarlet A, Nazarian R, Tajyar S, Lee B.2005. EphrinB2 is the entry receptor for Nipah virus, an emergent deadly paramyxovirus. Nature436:401– 405.