Finasteride Concentrations and Prostate
Cancer Risk: Results from the Prostate Cancer
Prevention Trial
Cindy H. Chau1☯, Douglas K. Price1☯, Cathee Till2, Phyllis J. Goodman2, Xiaohong Chen1,
Robin J. Leach3, Teresa L. Johnson-Pais3, Ann W. Hsing4, Ashraful Hoque5, Catherine M. Tangen2, Lisa Chu4, Howard L. Parnes6, Jeannette M. Schenk7, Juergen K.
V. Reichardt8, Ian M. Thompson3, William D. Figg1*
1Genitourinary Malignancies Branch, Center for Cancer Research, National Cancer Institute, Bethesda, Maryland, United States of America,2Swog Statistical Center, Fred Hutchinson Cancer Research Center, Seattle, Washington, United States of America,3Department of Urology, University of Texas Health Science Center at San Antonio, San Antonio, Texas, United States of America,4Cancer Prevention Institute of California, Fremont, California, Stanford Cancer Institute, Palo Alto, California, United States of America, 5Department of Clinical Cancer Prevention, The University of Texas M.D. Anderson Cancer Center, Houston, Texas, United States of America,6Division of Cancer Prevention, National Cancer Institute, Bethesda, Maryland, United States of America,7Cancer Prevention Program, Fred Hutchinson Cancer Research Center, Seattle, Washington, United States of America,8School of Pharmacy and Molecular Sciences, James Cook University, Townsville, Queensland, Australia
☯These authors contributed equally to this work. *figgw@helix.nih.gov
Abstract
Objective
In the Prostate Cancer Prevention Trial (PCPT), finasteride reduced the risk of prostate can-cer by 25%, even though high-grade prostate cancan-cer was more common in the finasteride group. However, it remains to be determined whether finasteride concentrations may affect prostate cancer risk. In this study, we examined the association between serum finasteride concentrations and the risk of prostate cancer in the treatment arm of the PCPT and deter-mined factors involved in modifying drug concentrations.
Methods
Data for this nested case-control study are from the PCPT. Cases were drawn from men with biopsy-proven prostate cancer and matched controls. Finasteride concentrations were measured using a liquid chromatography-mass spectrometry validated assay. The associa-tion of serum finasteride concentraassocia-tions with prostate cancer risk was determined by logistic regression. We also examine whether polymorphisms in the enzyme target and metabolism genes of finasteride are related to drug concentrations using linear regression.
Results and Conclusions
Among men with detectable finasteride concentrations, there was no association between finasteride concentrations and prostate cancer risk, low-grade or high-grade, when
OPEN ACCESS
Citation:Chau CH, Price DK, Till C, Goodman PJ, Chen X, Leach RJ, et al. (2015) Finasteride Concentrations and Prostate Cancer Risk: Results from the Prostate Cancer Prevention Trial. PLoS ONE 10(5): e0126672. doi:10.1371/journal. pone.0126672
Academic Editor:Zoran Culig, Innsbruck Medical University, AUSTRIA
Received:October 30, 2014
Accepted:April 6, 2015
Published:May 8, 2015
Copyright:This is an open access article, free of all copyright, and may be freely reproduced, distributed, transmitted, modified, built upon, or otherwise used by anyone for any lawful purpose. The work is made available under theCreative Commons CC0public domain dedication.
Data Availability Statement:All relevant data are within the paper.
finasteride concentration was analyzed as a continuous variable or categorized by cutoff points. Since there was no concentration-dependent effect on prostate cancer, any expo-sure to finasteride intake may reduce prostate cancer risk. Of the twenty-seven SNPs as-sessed in the enzyme target and metabolism pathway, five SNPs in two genes,CYP3A4
(rs2242480; rs4646437; rs4986910), andCYP3A5(rs15524; rs776746) were significantly associated with modifying finasteride concentrations. These results suggest that finasteride exposure may reduce prostate cancer risk and finasteride concentrations are affected by genetic variations in genes responsible for altering its metabolism pathway.
Trial Registration
ClinicalTrials.govNCT00288106
Introduction
Prostate tissue growth and differentiation is dependent on androgen hormones and regulated via the androgen receptor (AR) [1,2]. Testosterone is irreversibly converted to the more physi-ologically potent androgen 5α-dihydrotestosterone (DHT) mediated by the androgen metabo-lizing enzymes steroid 5a-reductase types I and II in the prostate tissue (encoded by the
SRD5A1andSRD5A2genes, respectively) [3] and also by steroid 5α-reductase type III (en-coded bySRD5A2LorSRD5A3) recently identified in castration-resistant prostate cancer cells [4,5].
Finasteride is a specific and potent SRD5A2 inhibitor [6,7,8], but it can also block the SRD5A1 enzyme, although at a much slower rate [9] and SRD5A3 activity [10]. Several muta-tions on theSRD5Agenes have been reported that changed the expression level of 5α-reductase [11,12]; thus genetic polymorphisms in these genes may affect enzyme activity and thus lead to individual variability in drug efficacy. Finasteride is extensively metabolized in the liver, pri-marily via theCYP3Asubfamily, involving CYP3A4-mediated hydroxylation and oxidation re-actions [13]. TheCYP3Asubfamily exhibits high sequence homology and various isoforms (e.g., CYP3A4 and CYP3A5) share similar substrate specificity. In fact, CYP3A5 is reported to be a major contributor to the metabolism of many CYP3A-mediated drugs and is highly poly-morphic [14]. There is currently no published literature on the effects ofCYP3A4andCYP3A5 genetic variations and finasteride metabolism.
Treatment with finasteride results in a significant reduction of prostatic and circulating DHT levels. Due to the role of DHT in the development of prostate cancer, it was hypothesized that finasteride could be used effectively as a chemopreventive agent to reduce the risk of this disease. In the Prostate Cancer Prevention Trial (PCPT), a randomized, placebo-controlled trial testing whether finasteride could reduce the 7-year period prevalence of prostate cancer, finasteride reduced the risk of prostate cancer by 25%, even though high-grade prostate cancer was more common in the finasteride group [15].
Here, we investigate the association of serum finasteride concentrations with prostate cancer risk using a nested case-control study in the finasteride-treated arm of the PCPT. We also ex-amine whether polymorphisms in the enzyme target and metabolism genes of finasteride, such asSRD5A2,CYP3A4, andCYP3A5, are related to drug concentrations. Findings from this study could provide further insight into the role of finasteride for cancer prevention and the etiology of the increased risk of high-grade cancer among men treated with finasteride, as well as improve our understanding of the interindividual responses to finasteride treatment. role in study design, data collection and analysis,
decision to publish, or preparation of the manuscript.
Methods
Study Design, Study Population, and Data Collection
All data for this study are from the PCPT (SWOG-9217) [15,16]. Details of the study design and participant characteristics have been described previously [15,16]. Briefly, 18,882 men age 55 years and older with a normal digital rectal exam (DRE), prostate specific antigen (PSA) level of 3 ng/mL or below, and no history of prostate cancer or other clinically significant co-morbid conditions that would have precluded successful completion of the study protocol, were randomized to receive either finasteride (5 mg/day) or placebo daily for seven years. Dur-ing the course of the PCPT, men underwent annual DRE and PSA measures and a prostate bi-opsy was recommended for all men with an abnormal DRE or a finasteride-adjusted PSA of>4.0 ng/mL. At the conclusion of the trial, either a prostate cancer diagnosis or end-of-study biopsy was available from 59.6% of the participants in the finasteride treatment arm, and 63% from the placebo arm. This level of ascertainment agreed well with the study design as-sumption that 60% of men would have an endpoint assessed. All men signed informed consent and study procedures were approved by the Institutional Review Boards of the participating 221 study sites [15,16].
This study reported here is part of a large nested case-control study designed to examine multiple hypotheses about prostate cancer and risk. Cancer cases and controls in this report were from the finasteride-treated study arm. Cases were men with biopsy-determined prostate cancer identified either by a for-cause or end-of-study biopsy and who had DNA from white blood cells or serum available. Controls were selected from men who completed the end-of-study biopsy procedure, had no evidence of prostate cancer and had archived DNA samples. Controls were frequency matched to cases on distributions of age (in 5-year age groups), and positive family history for first degree relative with prostate cancer. Controls were oversampled on race to include all eligible non-white subjects to maximize power for subgroup analyses. Fi-nasteride concentrations were available from 749 cases and 758 controls. For this analysis, all men who were non-compliant to study drug were removed. Non-compliance was defined in two ways: 1) finasteride concentrations below the lowest detectable limit of 1 ng/mL (n = 228) and 2) self-report of going off study drug at some point before the finasteride concentration was assessed (additional n = 6). The final sample size for analyses is 597 cases and 676 controls. Of these, 532 cases and 646 controls also had single nucleotide polymorphism (SNP) data avail-able. Participants who were excluded due to lack of adequate DNA were comparable to partici-pants with adequate DNA in terms of demographic characteristics such as age, BMI, race, and family history (data not shown).
Details regarding age, race/ethnicity, family history, physical activity (type, frequency, dura-tion, pace, and intensity), usual alcohol consumption and history of smoking were collected at baseline using self-administered questionnaires. Clinic staff measured height and weight at randomization, and body mass index (BMI) was calculated as weight (kg) divided by height2 (m). Tumors were graded centrally and categorized as low grade = Gleason<7; high grade = Gleason7, retaining the definitions used in the original trial report.
Blood Collection and Genotyping
for genotyping by polymerase chain reaction (PCR) amplification using the Sequenom, Taq-man, or Illumina platform assays. Briefly, SNP genotypes were determined using the Illumina VeraCode GoldenGate genotyping assay (Illumina Inc.; San Diego, CA). The list of SNPs were submitted to Illumina and scored with the Assay Design Tool (ADT). Those SNPs with accept-able scores were developed into an oligonucleotide pool assay (OPA) designed for a VeraCode GoldenGate panel. Two hundred fifty nanograms of DNA were used as the template for the assay. The assay was performed in 96 well plates following the established protocol (Illumina). The plates were scanned using an Illumina BeadXpress reader and the genotypes were analyzed using GenomeStudio software (Illumina). Interplate and intraplate replicates were included as quality control measures. Twenty-seven SNPs inSRD5A2,SRD5A2L,CYP3A4, andCYP3A5 were genotyped. Primer sequences will be provided upon request.
Sample Collection and Measurement of Finasteride Serum
Concentrations
For most men (90%), samples used to determine finasteride concentrations were measured at 3 years post-baseline. For the other 10%, time points ranged from 1–7 years post-baseline. Steady state finasteride concentrations were measured using a liquid chromatography-mass spectrom-etry validated method on a HP 1100 system (Agilent Technology, Palo Alto, CA, USA) coupled with a single-quadrupole mass spectrometric detector (Agilent 1100 MSD), as described previ-ously [17], which was further modified and validated in serum. The lower limit of quantitation for finasteride was established at 1 ng/mL. Laboratory personnel were blinded to the case-con-trol status of all participants. Two sets of QC samples, 20 in each set, were included for quality control, and the coefficients of variation were 6.5% and 7.4%.
Statistical Analysis
We compared baseline demographic and lifestyle characteristics of prostate cancer cases and controls by studentttest for continuous variables and chi-square test for categorical variables. Serum concentrations of finasteride were categorized based on clinically defined cut points. Lo-gistic regression was used to calculate ORs and 95% CIs for risk of total prostate cancer, and polytomous logistic regression was used to calculate ORs and 95% CIs of both low-grade and high-grade prostate cancers. The polytomous regression with a generalized logit link permits a model including both low-grade and high-grade cancers as outcomes in the same model, con-trasted with no cancer. Tests for linear trend for finasteride concentration were based on an or-dinal variable corresponding to rank (lowest to highest). Model covariates were carefully selected based on a priori information about potential confounding as well as diagnostic proce-dures completed as part of our modeling exercises. Final covariates included age, race (white/ black/others), time of day of finasteride blood draw, and family history of prostate cancer. To determine the association between single SNP and finasteride levels among whites, mean con-centrations of finsteride were calculated for each allele, and p-values were calculated using line-ar regression adjusted for age and alcohol consumption. All statistical tests were two-sided, with P<0.05 considered statistically significant. SAS (version 9.2) and R (version 2.15.1) were used for all statistical analyses. Haploview v4.1 was used for assessing LD patterns and haplo-type association statistics [18]. Haplohaplo-type blocks were determined using the algorithm of Ga-briel et al [19].
Results
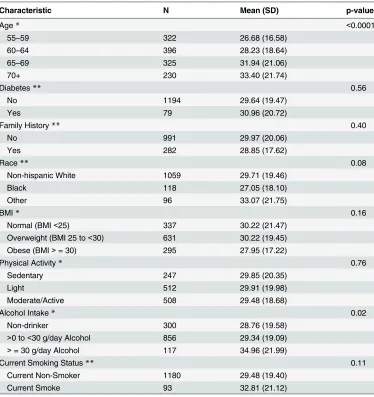
physical activity, current smoking status or family history of prostate cancer. Because minori-ties were oversampled (all eligible non-Caucasians were included) in the control group, there were more blacks or other race (non-whites) in the control group. We examined the potential predictors of finasteride concentrations and found that drug serum concentrations were signif-icantly associated with age at baseline and alcohol consumption specifically more than 30 g/d (Table 2). Mean finasteride concentrations were higher in older participants (p<0.0001) and in individuals who consumed more than 30g/d of alcohol (p<0.02).
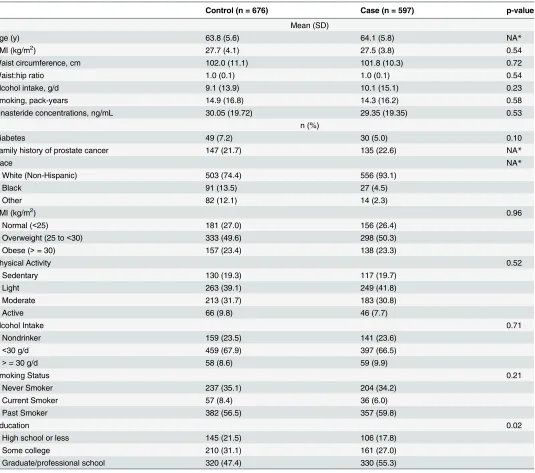
Table 1. Demographics and lifestyle characteristics of cases and controls of the Prostate Cancer Prevention Trial participants in the treatment arm (n = 1273).
Control (n = 676) Case (n = 597) p-value
Mean (SD)
Age (y) 63.8 (5.6) 64.1 (5.8) NA*
BMI (kg/m2) 27.7 (4.1) 27.5 (3.8) 0.54
Waist circumference, cm 102.0 (11.1) 101.8 (10.3) 0.72
Waist:hip ratio 1.0 (0.1) 1.0 (0.1) 0.54
Alcohol intake, g/d 9.1 (13.9) 10.1 (15.1) 0.23
Smoking, pack-years 14.9 (16.8) 14.3 (16.2) 0.58
Finasteride concentrations, ng/mL 30.05 (19.72) 29.35 (19.35) 0.53
n (%)
Diabetes 49 (7.2) 30 (5.0) 0.10
Family history of prostate cancer 147 (21.7) 135 (22.6) NA*
Race NA*
White (Non-Hispanic) 503 (74.4) 556 (93.1)
Black 91 (13.5) 27 (4.5)
Other 82 (12.1) 14 (2.3)
BMI (kg/m2) 0.96
Normal (<25) 181 (27.0) 156 (26.4)
Overweight (25 to<30) 333 (49.6) 298 (50.3)
Obese (>= 30) 157 (23.4) 138 (23.3)
Physical Activity 0.52
Sedentary 130 (19.3) 117 (19.7)
Light 263 (39.1) 249 (41.8)
Moderate 213 (31.7) 183 (30.8)
Active 66 (9.8) 46 (7.7)
Alcohol Intake 0.71
Nondrinker 159 (23.5) 141 (23.6)
<30 g/d 459 (67.9) 397 (66.5)
>= 30 g/d 58 (8.6) 59 (9.9)
Smoking Status 0.21
Never Smoker 237 (35.1) 204 (34.2)
Current Smoker 57 (8.4) 36 (6.0)
Past Smoker 382 (56.5) 357 (59.8)
Education 0.02
High school or less 145 (21.5) 106 (17.8)
Some college 210 (31.1) 161 (27.0)
Graduate/professional school 320 (47.4) 330 (55.3)
*By study design, controls were frequency matched to cases based on age and family history, and oversampled to include all non-whites.
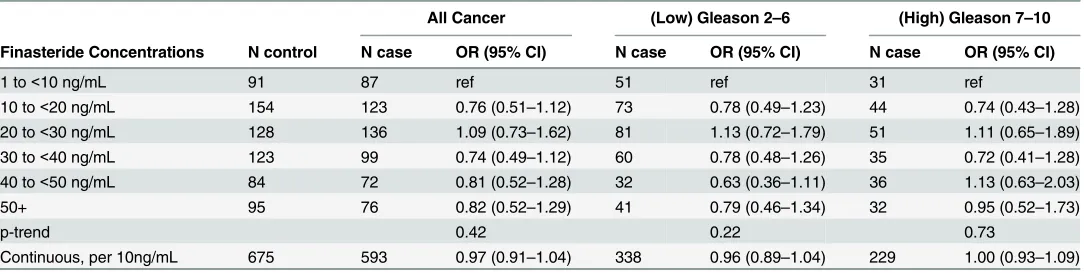
Table 3gives the results for the associations of finasteride serum concentrations with pros-tate cancer risk. Among individuals with detectable finasteride concentrations, there was no as-sociation between finasteride concentrations and risk of overall (OR, 0.97; 95% CI, 0.91–1.04), low-grade (OR, 0.96; 95% CI, 0.89–1.04), or high-grade (OR, 1.00; 95% CI, 0.93–1.09) prostate cancer when finasteride concentration was analyzed as a continuous variable or categorized by cutoff points. The results remain the same with high-grade disease classified as Gleason 8–10 (data not shown). Since the odds ratio for prostate cancer based on dose were comparable, we can presume that on average all plasma concentrations have a 25% risk reduction of prostate cancer as was reported in the primary treatment report [15]. Thus, while there was no concen-tration-dependent effect on prostate cancer, we concluded that any exposure to finasteride in-take may reduce prostate cancer risk. A sensitivity analysis was performed for cases diagnosed by for-cause biopsy and the results were similar toTable 3(data not shown). We found no
Table 2. Mean finasteride levels (ng/mL) stratified by categories of demographic measures among treatment-compliant men in the Prostate Cancer Prevention Trial finasteride arm.
Characteristic N Mean (SD) p-value
Age* <0.0001
55–59 322 26.68 (16.58)
60–64 396 28.23 (18.64)
65–69 325 31.94 (21.06)
70+ 230 33.40 (21.74)
Diabetes** 0.56
No 1194 29.64 (19.47)
Yes 79 30.96 (20.72)
Family History** 0.40
No 991 29.97 (20.06)
Yes 282 28.85 (17.62)
Race** 0.08
Non-hispanic White 1059 29.71 (19.46)
Black 118 27.05 (18.10)
Other 96 33.07 (21.75)
BMI* 0.16
Normal (BMI<25) 337 30.22 (21.47)
Overweight (BMI 25 to<30) 631 30.22 (19.45)
Obese (BMI>= 30) 295 27.95 (17.22)
Physical Activity* 0.76
Sedentary 247 29.85 (20.35)
Light 512 29.91 (19.98)
Moderate/Active 508 29.48 (18.68)
Alcohol Intake* 0.02
Non-drinker 300 28.76 (19.58)
>0 to<30 g/day Alcohol 856 29.34 (19.09)
>= 30 g/day Alcohol 117 34.96 (21.99)
Current Smoking Status** 0.11
Current Non-Smoker 1180 29.48 (19.40)
Current Smoke 93 32.81 (21.12)
*p-value is based on a trend test
**p-value is based on an analysis of variance F-test
association between finasteride concentration-dependent effects and prostate cancer risk for cases diagnosed by for-cause biopsy.
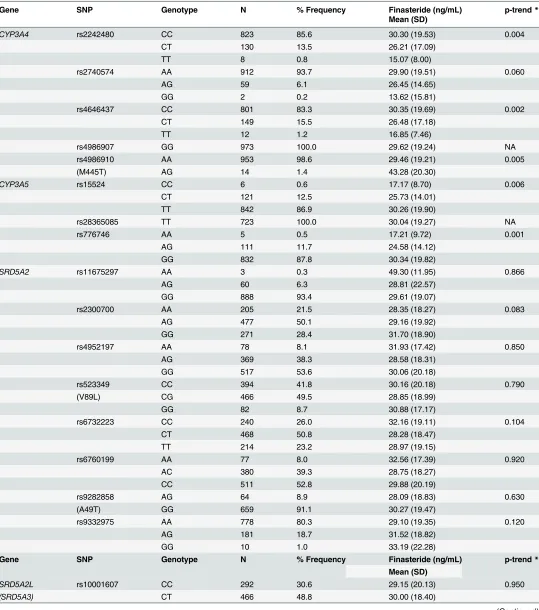
The association between finasteride concentrations and polymorphisms in enzyme target and metabolism genes of finasteride are shown inTable 4. Of the twenty-seven SNPs assessed, five SNPs inCYP3A4(rs2242480; rs4646437; rs4986910) andCYP3A5(rs776746; rs15524) were associated with finasteride concentrations. For three of the SNPs, the variant allele was as-sociated with higher finasteride concentrations (e.g.CYP3A4rs4986910, Ptrend= 0.005; CYP3A5rs776746 and rs15524, Ptrend= 0.001 and Ptrend= 0.006, respectively). The variant
al-lele increased mean finasteride levels by>1.5-fold. The remaining two SNPs were associated with lower finasteride concentrations (e.g.CYP3A4rs2242480, Ptrend= 0.004; and rs4646437,
Ptrend= 0.002) and the homozygous variant alleles reduced mean finasteride levels by one half.
A sensitivity analysis for the SNP-finasteride association among controls only was performed and showed statistical significance for only two gene variants,CYP3A4rs4646437 (p = 0.04) andCYP3A5rs776746 (p = 0.03) (data not shown). These two variants were also statistically significant when cases and controls were combined as shown inTable 4. We found no associa-tions between finasteride concentraassocia-tions and polymorphisms in enzyme targets of theSRD5A2 orSRD5A2L/SRD5A3genes.
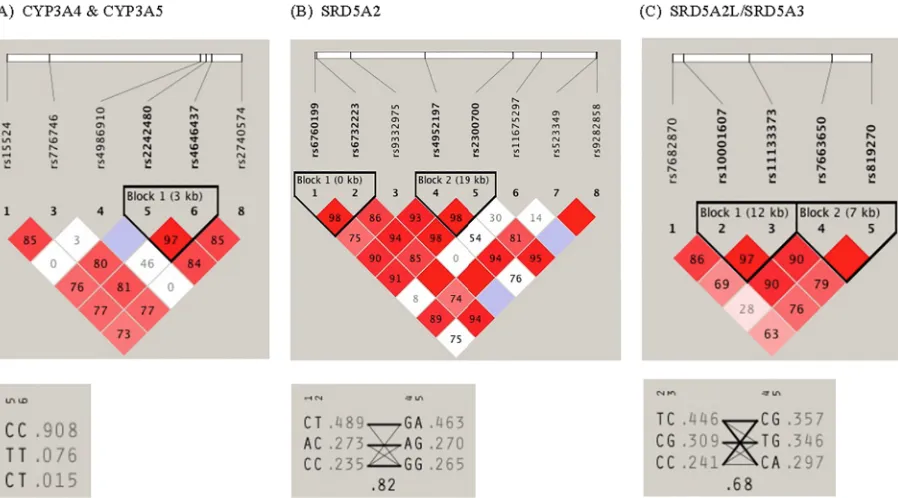
The pairwise linkage disequilibrium (LD) structure was constructed with all SNPs evaluated for each gene. SinceCYP3A4andCYP3A5are located adjacent to each other on chromosome 7, the SNPs in each gene were evaluated together, which revealed one LD block consisting of 2
CYP3A4variants (rs2242480 and rs4646437) (Fig 1A). A strong LD was observed between these two variants with haplotype frequencies of C/C 0.908, C/T 0.076, C/T 0.015. These two variants were also found to be associated with finasteride concentrations. ForSRD5A2, two LD blocks were identified, with rs6760199 and rs6732223 in the same LD block (block 1) while rs4952197 and rs2300700 were in block 2 exhibiting high LD with corresponding haplotype frequencies shown inFig 1B. ForSRD5A3, two LD blocks were also identified with high LD (block 1: rs10001607 and rs11133373; block 2: rs7663650 and rs819270) as shown inFig 1C.
Discussion
[image:7.612.36.578.88.225.2]The PCPT demonstrated that finasteride reduced the risk of prostate cancer by about 25% [15]. Based on these findings, we investigated whether finasteride concentrations may affect prostate cancer risk. In this nested case-control study from the PCPT, when we examined only individuals with detectable finasteride levels, we found no difference between any drug serum
Table 3. Associations of finasteride concentrations with prostate cancer risk in PCPT, overall and stratified by cancer grade.
All Cancer (Low) Gleason 2–6 (High) Gleason 7–10
Finasteride Concentrations N control N case OR (95% CI) N case OR (95% CI) N case OR (95% CI)
1 to<10 ng/mL 91 87 ref 51 ref 31 ref
10 to<20 ng/mL 154 123 0.76 (0.51–1.12) 73 0.78 (0.49–1.23) 44 0.74 (0.43–1.28) 20 to<30 ng/mL 128 136 1.09 (0.73–1.62) 81 1.13 (0.72–1.79) 51 1.11 (0.65–1.89) 30 to<40 ng/mL 123 99 0.74 (0.49–1.12) 60 0.78 (0.48–1.26) 35 0.72 (0.41–1.28) 40 to<50 ng/mL 84 72 0.81 (0.52–1.28) 32 0.63 (0.36–1.11) 36 1.13 (0.63–2.03)
50+ 95 76 0.82 (0.52–1.29) 41 0.79 (0.46–1.34) 32 0.95 (0.52–1.73)
p-trend 0.42 0.22 0.73
Continuous, per 10ng/mL 675 593 0.97 (0.91–1.04) 338 0.96 (0.89–1.04) 229 1.00 (0.93–1.09)
Odds ratios are adjusted for age, race (white vs black vs others), time of day of blood draw, and family history of prostate cancer.
Table 4. Association between finasteride concentrations and genes in metabolism and target pathways among white men.#
Gene SNP Genotype N % Frequency Finasteride (ng/mL) p-trend*
Mean (SD)
CYP3A4 rs2242480 CC 823 85.6 30.30 (19.53) 0.004
CT 130 13.5 26.21 (17.09)
TT 8 0.8 15.07 (8.00)
rs2740574 AA 912 93.7 29.90 (19.51) 0.060
AG 59 6.1 26.45 (14.65)
GG 2 0.2 13.62 (15.81)
rs4646437 CC 801 83.3 30.35 (19.69) 0.002
CT 149 15.5 26.48 (17.18)
TT 12 1.2 16.85 (7.46)
rs4986907 GG 973 100.0 29.62 (19.24) NA
rs4986910 AA 953 98.6 29.46 (19.21) 0.005
(M445T) AG 14 1.4 43.28 (20.30)
CYP3A5 rs15524 CC 6 0.6 17.17 (8.70) 0.006
CT 121 12.5 25.73 (14.01)
TT 842 86.9 30.26 (19.90)
rs28365085 TT 723 100.0 30.04 (19.27) NA
rs776746 AA 5 0.5 17.21 (9.72) 0.001
AG 111 11.7 24.58 (14.12)
GG 832 87.8 30.34 (19.82)
SRD5A2 rs11675297 AA 3 0.3 49.30 (11.95) 0.866
AG 60 6.3 28.81 (22.57)
GG 888 93.4 29.61 (19.07)
rs2300700 AA 205 21.5 28.35 (18.27) 0.083
AG 477 50.1 29.16 (19.92)
GG 271 28.4 31.70 (18.90)
rs4952197 AA 78 8.1 31.93 (17.42) 0.850
AG 369 38.3 28.58 (18.31)
GG 517 53.6 30.06 (20.18)
rs523349 CC 394 41.8 30.16 (20.18) 0.790
(V89L) CG 466 49.5 28.85 (18.99)
GG 82 8.7 30.88 (17.17)
rs6732223 CC 240 26.0 32.16 (19.11) 0.104
CT 468 50.8 28.28 (18.47)
TT 214 23.2 28.97 (19.15)
rs6760199 AA 77 8.0 32.56 (17.39) 0.920
AC 380 39.3 28.75 (18.27)
CC 511 52.8 29.88 (20.19)
rs9282858 AG 64 8.9 28.09 (18.83) 0.630
(A49T) GG 659 91.1 30.27 (19.47)
rs9332975 AA 778 80.3 29.10 (19.35) 0.120
AG 181 18.7 31.52 (18.82)
GG 10 1.0 33.19 (22.28)
Gene SNP Genotype N % Frequency Finasteride (ng/mL) p-trend*
Mean (SD)
SRD5A2L rs10001607 CC 292 30.6 29.15 (20.13) 0.950
(SRD5A3) CT 466 48.8 30.00 (18.40)
Table 4. (Continued)
Gene SNP Genotype N % Frequency Finasteride (ng/mL) p-trend*
Mean (SD)
TT 196 20.5 28.99 (18.67)
rs11133373 CC 449 46.4 29.62 (17.68) 1.000
CG 433 44.7 29.73 (20.42)
GG 86 8.9 29.51 (21.41)
rs7663650 CC 400 41.3 30.23 (18.88) 0.480
CT 465 48.0 28.98 (19.49)
TT 103 10.6 29.59 (19.98)
rs7682870 AA 588 60.9 29.72 (19.66) 0.890
AC 336 34.8 29.07 (18.82)
CC 41 4.2 31.67 (16.25)
rs819270 AA 92 9.6 32.84 (22.29) 0.120
AG 388 40.3 29.77 (18.17)
GG 483 50.2 28.81 (19.47)
#Treatment compliant men in the PCPTfinasteride arm.
doi:10.1371/journal.pone.0126672.t004
Fig 1. Linkage disequilibrium (LD) pattern and haplotype architecture for (A)CYP3A4&CYP3A5; (B)SRD5A2; and (C)SRD5A2L/SRD5A3genes. The haplotype block structure, as exhibited by Haploview is shown. LD was measured using data from all white subjects in the present study. The haplotype blocks were determined using the criteria described by Gabriel et al. The physical position of each SNP is presented in the upper diagram. Each diamond contains the level of LD measured by Hedrick's multiallelic D0between pairs of single nucleotide polymorphisms. Shading shows the magnitude and significance of pairwise LD, with darker shades representing stronger LD; the diamond without a number corresponds to D0= 1. Haplotypes for the variations and their population frequency (light gray color) are shown below each haplotype block of the corresponding genes. The SNP numbers across the top of the haplotypes correspond to those in the Haploview plot. D0indicates the level of recombination between two blocks and is shown in the crossing area. The connection from one block to the next block is displayed through frequency corresponding to the thickness of the line.
[image:9.612.41.490.365.614.2]concentrations and the risk of overall, low- or high-grade prostate cancer. This suggests that since there was no concentration-dependent effect on prostate cancer, any exposure to finaste-ride intake may reduce prostate cancer risk. The observed effect could be attributed to partici-pant adherence to therapy resulting in detectable drug levels, inter-individual variation in drug metabolism resulting in increased drug concentrations, or random variability from post-hoc analysis.
Moreover, we investigated the potential predictors of finasteride concentrations and found that drug serum concentrations were significantly associated with age at baseline and alcohol consumption specifically more than 30 g/d. Mean finasteride concentrations were higher in older participants, suggesting that perhaps the liver function (where finasteride is primarily metabolized) and metabolism of the older participants were more impaired compared to youn-ger participants. We also found that men who consumed more than 30g/d of alcohol appeared to have higher drug concentrations. Results from a previous case-control study of the PCPT population demonstrated that heavy drinking (50g of alcohol consumption) made finasteride ineffective for reducing prostate cancer risk [20]. Whether alcohol consumption positively or negatively affects liver function and subsequent finasteride metabolism remains to be elucidat-ed. Nonetheless, variability in the concentration may also be due to the time of day of blood draw as finasteride concentrations were lower for men who had their blood drawn later in the day (data not shown).
We next investigated whether polymorphisms in the enzyme target and metabolism genes of finasteride may in fact alter drug levels. Finasteride is a specific and potent steroid 5α -reduc-tase type II inhibitor. Previous studies have demonstrated significant pharmacogenetic varia-tion for finasteride at theSRD5A2locus where specific mutations (rs523349; rs9282858) affect enzyme stability or substrate binding by finasteride [11,12]. Our current genotyping study found no associations between finasteride concentrations and polymorphisms in enzyme tar-gets of theSRD5A2orSRD5A2L/SRD5A3genes.
Genetic variants in theCYP3A4andCYP3A5genes involved in finasteride metabolism were significantly associated with serum concentrations in our study. The homozygous minor allele ofCYP3A4rs2242480 and rs4646437 were associated with lower finasteride levels.
SNP rs2242480 (CYP3A41G) resides within intron 10 and reporter gene assays indicated that the minor allele has a significantly higher transcriptional activity [21]. Previous studies have demonstrated its association with lipid-lowering efficacy of atorvastatin [22] or tacroli-mus pharmacokinetics in renal transplant patients [23]. SNP rs4646437 lies within intron 7 of
CYP3A4and although the functional role of this SNP remains to be determined, it has been as-sociated with CYP3A4 protein expression and enzyme activity in human liver microsomes ob-served in men only [24]. The variant allele in 3 SNPs (e.g.CYP3A4rs4986910;CYP3A5 rs776746 and rs15524) were associated with higher finasteride concentrations. The minor allele ofCYP3A4rs4986910 (CYP3A43), located in exon 12, significantly increased mean finasteride levels by more than 1.5-fold. While the allele frequency for this variant is low, studies have shown that the SNP was associated with reduced enzyme function, which may explain the higher finasteride levels observed [25]. SNP rs776746 (CYP3A53), located in intron 3
sunitinib response and tolerability [27]. Similar to finasteride, the rs776746 SNP has been asso-ciation with serum tacrolimus concentration where carriers of a G/G genotype exhibited higher drug levels than the A allele (GA or AA) [28]. Moreover, higher mean finasteride concentra-tions have been found among carriers of the homozygous variant (T/T genotype) ofCYP3A5 rs15524 (CYP3A51D), which was similar to that observed for cyclosporine [28].
There are strengths and limitations to our study. The PCPT was a large placebo-controlled randomized trial that specified prostate cancer outcomes would be based on biopsy results. As such, the control group used in these analyses all had negative prostate biopsies, largely elimi-nating the possibility that controls may have had undiagnosed or undetected disease. Addition-ally, data were carefully collected throughout the course of the trial with a central pathology laboratory for uniform adjudication of all cases (including adjudication of Gleason grade) and we used a highly sensitive and specific assay for quantitating finasteride serum concentrations. However, our study was limited in that the PCPT included few minorities. Although we over-sampled non-white controls to increase power for analyses by race, the power for any race-spe-cific subgroups was hampered. Another limitation was that the finasteride concentrations were drawn from a very specific time-point, and hence don't provide any information about dura-tion of use or long-term compliance on drug therapy. Given the drug’s short half-life, the low or undetectable levels of finasteride may have resulted from random missed dose(s) prior to sampling time or noncompliance. However, our analysis has shown that individuals with finas-teride concentrations greater than 1 ng/mL correlated with their self-reported compliance of taking the drug therapy (data not shown). Finally, serum concentrations may not be represen-tative of tissue levels.
Conclusions
In summary, this study demonstrates the association between finasteride exposure and prostate cancer risk. Among treatment compliant men, there was no concentration-response effect of fi-nasteride on disease risk. This is also the first study to show an association between fifi-nasteride concentrations and genetic variations in genes responsible for altering its metabolism pathway. We identified variants that influenced finasteride concentrations, which may explain the inter-individual variation observed in drug level differences. Our study has paved the way for future studies to conduct pharmacogenetic analyses of functional SNPs in finasteride-related metabo-lism genes that will likely contribute to an individual’s response to
finasteride chemoprevention.
Acknowledgments
The content of this publication does not necessarily reflect the views or policies of the Depart-ment of Health and Human Services, nor does Depart-mention of trade names, commercial products, or organization imply endorsement by the U.S. Government. The authors would like to express their gratitude to Dr. Tristan Sissung for helpful suggestions on the manuscript.
Author Contributions
References
1. Bruchovsky N, Wilson JD (1968) The conversion of testosterone to 5-alpha-androstan-17-beta-ol-3-one by rat prostate in vivo and in vitro. J Biol Chem 243: 2012–2021. PMID:4384673
2. Imperato-McGinley J, Guerrero L, Gautier T, Peterson RE (1974) Steroid 5alpha-reductase deficiency in man: an inherited form of male pseudohermaphroditism. Science 186: 1213–1215. PMID:4432067 3. Andersson S, Russell DW (1990) Structural and biochemical properties of cloned and expressed
human and rat steroid 5 alpha-reductases. Proc Natl Acad Sci U S A 87: 3640–3644. PMID:2339109 4. Tamura K, Furihata M, Tsunoda T, Ashida S, Takata R, Obara W, et al. (2007) Molecular features of
hormone-refractory prostate cancer cells by genome-wide gene expression profiles. Cancer Res 67: 5117–5125. PMID:17545589
5. Uemura M, Tamura K, Chung S, Honma S, Okuyama A, Nakamura Y, et al. (2008) Novel 5 alpha-ste-roid reductase (SRD5A3, type-3) is overexpressed in hormone-refractory prostate cancer. Cancer Sci 99: 81–86. PMID:17986282
6. Chaudhary UB, Turner JS (2010) Finasteride. Expert Opin Drug Metab Toxicol 6: 873–881. doi:10. 1517/17425255.2010.495944PMID:20536414
7. Gormley GJ, Stoner E, Bruskewitz RC, Imperato-McGinley J, Walsh PC, McConnell JD, et al. (1992) The Effect of Finasteride in Men with Benign Prostatic Hyperplasia. N Engl J Med 327: 1185–1191. PMID:1383816
8. Stoner E (1992) The clinical effects of a 5 alpha-reductase inhibitor, finasteride, on benign prostatic hy-perplasia. The Finasteride Study Group. J Urol 147: 1298–1302. PMID:1373779
9. Bull HG, Garcia-Calvo M, Andersson S, Baginsky WF, Chan HK, Ellsworth DE, et al. (1996) Mecha-nism-Based Inhibition of Human Steroid 5α-Reductase by Finasteride: Enzyme-Catalyzed Formation of NADP—Dihydrofinasteride, a Potent Bisubstrate Analog Inhibitor. J Am Chem Soc 118: 2359–2365. 10. Yamana K, Labrie F, Luu-The V (2010) Human type 3 5α-reductase is expressed in peripheral tissues
at higher levels than types 1 and 2 and its activity is potently inhibited by finasteride and dutasteride. Horm Mol Biol Clin Invest 2: 293–299.
11. Makridakis NM, di Salle E, Reichardt JK (2000) Biochemical and pharmacogenetic dissection of human steroid 5 alpha-reductase type II. Pharmacogenetics 10: 407–413. PMID:10898110
12. Makridakis N, Akalu A, Reichardt JK (2004) Identification and characterization of somatic steroid 5alpha-reductase (SRD5A2) mutations in human prostate cancer tissue. Oncogene 23: 7399–7405. PMID:15326487
13. Huskey SW, Dean DC, Miller RR, Rasmusson GH, Chiu SH (1995) Identification of human cytochrome P450 isozymes responsible for the in vitro oxidative metabolism of finasteride. Drug Metab Dispos 23: 1126–1135. PMID:8654202
14. Kuehl P, Zhang J, Lin Y, Lamba J, Assem M, Schuetz J, et al. (2001) Sequence diversity in CYP3A pro-moters and characterization of the genetic basis of polymorphic CYP3A5 expression. Nat Genet 27: 383–391. PMID:11279519
15. Thompson IM, Goodman PJ, Tangen CM, Lucia MS, Miller GJ, Ford LG, et al. (2003) The influence of fi-nasteride on the development of prostate cancer. N Engl J Med 349: 215–224. PMID:12824459 16. Feigl P, Blumenstein B, Thompson I, Crowley J, Wolf M, Kramer BS, et al. (1995) Design of the Prostate
Cancer Prevention Trial (PCPT). Control Clin Trials 16: 150–163. PMID:7540965
17. Chen X, Gardner ER, Price DK, Figg WD (2008) Development and validation of an LC-MS assay for fi-nasteride and its application to prostate cancer prevention trial sample analysis. J Chromatogr Sci 46: 356–361. PMID:18402729
18. Barrett JC, Fry B, Maller J, Daly MJ (2005) Haploview: analysis and visualization of LD and haplotype maps. Bioinformatics 21: 263–265. PMID:15297300
19. Gabriel SB, Schaffner SF, Nguyen H, Moore JM, Roy J, Blumenstiel B, et al. (2002) The structure of haplotype blocks in the human genome. Science 296: 2225–2229. PMID:12029063
20. Gong Z, Kristal AR, Schenk JM, Tangen CM, Goodman PJ, Thompson IM (2009) Alcohol consumption, finasteride, and prostate cancer risk: results from the Prostate Cancer Prevention Trial. Cancer 115: 3661–3669. doi:10.1002/cncr.24423PMID:19598210
21. He BX, Shi L, Qiu J, Tao L, Li R, Yang L, et al. (2011) A functional polymorphism in the CYP3A4 gene is associated with increased risk of coronary heart disease in the Chinese Han population. Basic Clin Pharmacol Toxicol 108: 208–213. doi:10.1111/j.1742-7843.2010.00657.xPMID:21199372
23. Miura M, Satoh S, Kagaya H, Saito M, Numakura K, Tsuchiya N, et al. (2011) Impact of the
CYP3A4*1G polymorphism and its combination with CYP3A5 genotypes on tacrolimus pharmacoki-netics in renal transplant patients. Pharmacogenomics 12: 977–984. doi:10.2217/pgs.11.33PMID: 21635144
24. Schirmer M, Rosenberger A, Klein K, Kulle B, Toliat MR, Nurnberg P, et al. (2007) Sex-dependent ge-netic markers of CYP3A4 expression and activity in human liver microsomes. Pharmacogenomics 8: 443–453. PMID:17465708
25. van Schaik RH, de Wildt SN, Brosens R, van Fessem M, van den Anker JN, Lindemans J (2001) The CYP3A4*3 allele: is it really rare? Clin Chem 47: 1104–1106. PMID:11375299
26. Kim DH, Sriharsha L, Xu W, Kamel-Reid S, Liu X, Siminovitch K, et al. (2009) Clinical relevance of a pharmacogenetic approach using multiple candidate genes to predict response and resistance to imati-nib therapy in chronic myeloid leukemia. Clin Cancer Res 15: 4750–4758. doi:10.1158/1078-0432. CCR-09-0145PMID:19584153
27. Garcia-Donas J, Esteban E, Leandro-Garcia LJ, Castellano DE, del Alba AG, Climent MA, et al. (2011) Single nucleotide polymorphism associations with response and toxic effects in patients with advanced renal-cell carcinoma treated with first-line sunitinib: a multicentre, observational, prospective study. Lancet Oncol 12: 1143–1150. doi:10.1016/S1470-2045(11)70266-2PMID:22015057