Education Committee
A ten-year plan for
school and college
funding
Tenth Report of Session 2017–19
Report, together with formal minutes relating
to the report
Ordered by the House of Commons to be printed 16 July 2019
associated public bodies.
Current membership
Rt Hon Robert Halfon MP (Conservative, Harlow) (Chair)
Lucy Allan MP (Conservative, Telford)
Ben Bradley MP (Conservative, Mansfield)
Marion Fellows MP (Scottish National Party, Motherwell and Wishaw)
James Frith MP (Labour, Bury North)
Emma Hardy MP (Labour, Kingston upon Hull West and Hessle)
Trudy Harrison MP (Conservative, Copeland)
Ian Mearns MP (Labour, Gateshead)
Lucy Powell MP (Labour (Co-op), Manchester Central)
Thelma Walker MP (Labour, Colne Valley)
Mr William Wragg MP (Conservative, Hazel Grove)
Powers
The Committee is one of the departmental select committees, the powers of which are set out in House of Commons Standing Orders, principally in SO No 152. These are available on the Internet via www.parliament.uk.
Publications
© Parliamentary Copyright House of Commons 2019. This publication may be reproduced under the terms of the Open Parliament Licence, which is published at
www.parliament.uk/copyright.
Committee reports are published on the Committee’s website at
www.parliament.uk/education-committee and in print by Order of the House. Evidence relating to this report is published on the inquiry publications page of the Committee’s website.
Committee staff
The current staff of the Committee are Richard Ward (Clerk), Katya Cassidy (Second Clerk), Daniel Schlappa (Assistant Clerk), Chloë Cockett (Committee Specialist), Natalie Flanagan (Senior Committee Assistant), Olivia Cormack (Committee Assistant), Gary Calder (Senior Media Officer) and Oliver Florence (Media Officer).
Contacts
All correspondence should be addressed to the Clerk of the Education
Committee, House of Commons, London, SW1A 0AA. The telephone number for general enquiries is 020 7219 1376; the Committee’s email address is
educom@parliament.uk.
Contents
Summary 3
1 Introduction 6
2 Funding pressures 7
Overview 7 Achieving education spending efficiencies and the use of consultants 9 Government position on school and college funding levels 10
The Department’s use of data 12
3 Core school funding 14
Background 14
Practical implementation 16
National Funding Formula and multi-academy trusts 18
4 Post-16 education funding 21
Overview 21
Impacts and implications 21
Government position 23
5 Social justice and tackling disadvantage 25
Overview 25
Improving Pupil Premium 25
Post-16 disadvantage funding 29
6 Special educational needs and disabilities 33
Background to SEND funding 33
Impacts 37
Tackling the problem 38
7 Towards a solution - a ten year plan 41
Long-term strategy 41
Costs 42
Funding model 43
Witnesses 54
Published written evidence 55
Summary
School and college funding is under growing pressure. More pupils, the cumulative effect of education reforms, and increasingly complex special needs requirements have put significant strain on the education sector over the past decade, whilst pressures on social services have led schools and colleges to provide support across a growing variety of areas. Funding has not increased in line with these rising demands, as data from the Institute for Fiscal Studies and the Education Policy Institute clearly show. Indeed, total school spending per pupil fell by 8% in real terms between 2009–10 and 2017–18. Per pupil funding for 2019–20 is expected to be similar to 2011–12 levels. Teachers, unions and parents have described to us in detail the scale of the impact this has had on children and young people, and on those working in the education sector.
Further education has been hit the hardest. Participation in full time further education has more than doubled since the 1980s, yet post-16 budgets have seen the most significant pressures of all education stages. Per student funding fell by 16% in real terms between 2010–11 and 2018–19 – twice as much as the 8% school funding fall over a similar period. This funding gap is the result of policy choices that now need to be addressed urgently. The social justice implications of the squeeze on further education colleges are particularly troubling, given the high proportion of disadvantaged students in these institutions.
The underlying reasons for this bleak funding picture are varied, ranging from the lingering consequences of the financial crisis through to systemic failures in forward planning and operational delivery, and significant discrepancies between funding requirements and budget availability that have driven a vicious cycle of spiralling costs. We noted that substantial amounts of money have been allocated to the education system–for example the additional £1.3 billion for schools and high needs, and the multi-million pound T level commitments–even within constrained fiscal circumstances. As the Institute for Fiscal Studies highlighted in its report on long-run trends in school spending, the Government took action to protect school funding between 2015–16 and 2019–20 as compared to other unprotected departments. We were pleased to see that education funding is rising up the political agenda, and that there is growing recognition of the need for a long-term plan to address the numerous ongoing challenges across the school and college funding system.
Within the context of the upcoming spending review, the Department must make the strongest possible case to the Treasury for multi-billion pound funding increases, and take a much more strategic long-term approach to spending, or else risk stretching the school and college education system beyond breaking point.
Looking to the future, the Department must be clear that securing additional funding in the now overdue spending review will not fix deeper problems with the overall funding system. Throughout our inquiry we encountered a troubling lack of long-term vision – an issue compounded by the vagaries of the politically-driven spending review cycle which has encouraged a winner-takes-all short-termism wholly unsuited to the strategic cross-departmental approach needed to fix the broken funding system. Most concerning was the astonishing disconnect between the available funding and the costs of delivering a quality education and support system. Indeed, we were unable to determine whether the Department had a clear idea of how much money was needed to fund the various components of the school and college education system appropriately and efficiently. We suspected not.
We therefore call on the Department to develop a ten-year plan for education funding. This plan needs to focus on, at its core, what schools and colleges are expected to provide and the cost of doing so. It needs to recognise that education is a strategic national priority that has profound consequences across a wide range of social and economic policy issues. We expect the Department to engage in a frank conversation about what the education sector can and should deliver; develop a coherent vision of what it wants to achieve; and publish detailed bottom-up cost assessments in order to secure an adequate funding settlement from the Treasury. The Exchequer, for its part, must recognise the long-term value for money that would come with substantial investments to fix the underlying problems in an increasingly dysfunctional education funding system.
In addition, for the short- to medium-term we are calling on the Department to:
• urgently address underfunding in further education by increasing the base rate from £4,000 to at least £4,760 (amounting to around £970 million per year), rising in line with inflation;
• increase school funding by raising the age-weighted pupil unit value;
• increase high needs funding for special educational needs and disabilities to address a projected deficit of at least £1.2 billion, and ensure any funding uplift takes proper account of the costs of providing Education, Health and Care plans up to the age of 25;
• implement the full roll-out of the National Funding Formula as soon as feasible; make the various funding formulae more forward-looking and less reliant on historical factors; and investigate how best to account for the individual circumstances of outliers;
• grant Ofsted the powers to conduct inspections at MAT level, and require MATs to publish more detailed data on their financing structures;
• ensure all eligible students attract Pupil Premium and overcome existing barriers to automatic enrolment as a matter of priority;
• secure from the Treasury the full amount of estimated Pupil Premium money that has not been claimed because students did not register for free school meals, and allocate this money to disadvantaged children;
• extend Pupil Premium to provide for 16–19 year olds; and
1
Introduction
1. We launched this inquiry on 19 April 2018 to examine the state of school and college funding in England. We received a large number of written submissions and took oral evidence from a range of stakeholders across schools and colleges, unions, sector experts, and officials from the Department for Education.
2. Throughout our inquiry we acknowledged the inextricable links between funding levels and operational or policy issues. In line with our terms of reference, we focused as far as possible on questions around the funding levels and mechanisms themselves. Our inquiry touched on a number of areas that deserved greater attention than was possible to cover in this Report. In some cases these were handled in separate inquiries, for example in our concurrent inquiry into Special educational needs and disabilities.1 Other areas— for example off-rolling and school exclusions, or the role of multi-academy trusts—were examined in previous inquiries and may be examined in greater detail in future.2
3. We hope the results of our inquiry will be used to inform the upcoming spending review and support the Department in making the case for a more strategic approach to school and college funding.
1 Education Committee, Special educational needs and disabilities, HC 342, 18 April 2018
2
Funding pressures
Overview4. Education has the second-largest public service expenditure in the UK, after health. Spending on school grants for 2018–19 accounted for around £50 billion,3 whilst 16–19 expenditure across sixth form colleges, general further education colleges, and schools with sixth forms accounted for £5.79 billion in 2016–17.4 We examined how this funding related to the requirements of the school and college system, and what improvements were needed.
5. Throughout our inquiry, we heard overwhelming evidence that schools and colleges were under considerable financial pressure,5 and that a long-term plan was needed to address the wide-ranging issues facing schools and colleges.6 Costs have increased across a range of areas, including annual pay award and salary raises,7National Insurance, inflation, pensions, and SEND provision, amongst others.8 School funding has not kept pace. Total school spending per pupil fell by 8% in real terms between 2009–10 and 2017–18.This figure took account of the 5% increase in post 2009–10 school spending, the 55% reduction in local authority spending on schools (for example SEN and education-related services), and the 24% reduction in school sixth form funding.9 Research from the Institute for Fiscal Studies (IFS) indicated that funding was projected to be frozen in real terms between 2017–18 and 2019–20, with 2019–20 per pupil funding expected to be broadly equivalent to 2011–12 levels.10
6. Further education (FE) has been hardest hit. In 1990–91 per student funding for an FE or sixth form college was 50% greater than in secondary schools. It is now around 8% lower. By 2019–20 spending per student in FE will be similar to 2006–7 levels, while school sixth form spending will be lower than at any point since at least 2002.11Overall, the total size of the 16–19 education budget fell by 27% in real terms between 2010–11 and 2018–19, from £7.8 billion to £5.7 billion, excluding 16–18 apprenticeships. When apprenticeship funding is included, the reduction amounts to a 24% decline between 2010–11 and 2017– 18, from £8.7 billion to £6.6 billion.12
7. Since 2010–11 an increasing number of schools have been struggling financially or going into deficit. Data on local authority maintained schools—which make up around
3 House of Commons Library, Spending of the Department for Education, 25 February 2019, p2 4 House of Commons Library, Spending of the Department for Education, 25 February 2019, p13
5 Qq2, 99, 158, 260. See also written evidence, for example London Councils (FUN0094) paras 5–26; Education Policy Institute (FUN0064) paras 2.1–2.3; Institute for Fiscal Studies (FUN0082) paras 2–11.
6 Q246
7 In April 2019 the Government confirmed it would fund the estimated £830 million cost of rising teachers’ pensions contributions for 2019–20.
8 National Audit Office, Financial sustainability of schools, HC 850, 14 December 2016, p7
9 Institute for Fiscal Studies, 2018 Annual Report on Education Spending in England, September 2018, pp 32–33. Note that this Report also makes use of data from sources published at different times, for example Education Policy Institute, 16–19 education: trends and implications, May 2019. Throughout this Report, the purpose has been to provide a balanced and representative picture of school and college funding, rather than generate like-for-like comparisons between different data sets.
10 Institute for Fiscal Studies (FUN0082) para 2
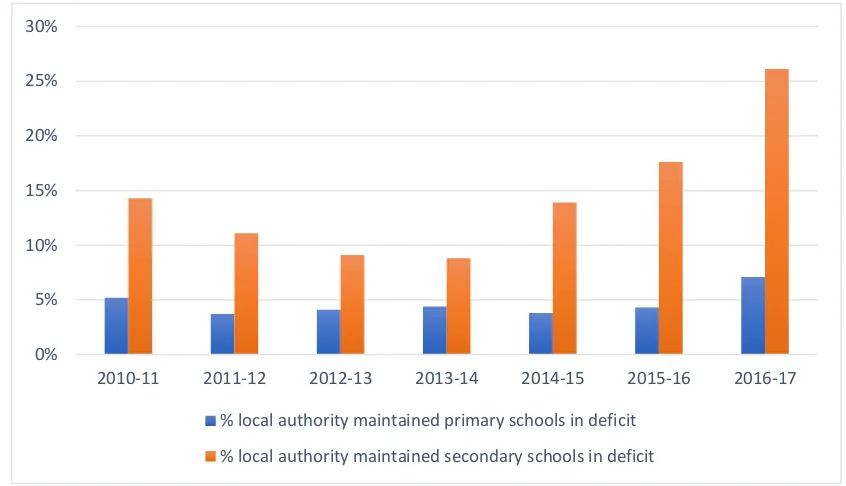
60% of state-funded schools13—show that secondary schools in particular have struggled: from 2013–14 to 2016–17, the proportion of local authority maintained secondary schools in deficit rose from 8.8% to 26.1% and the average deficit increased from £292,822 in 2010–11 to £373,990 in 2016–17.14 A number of surveys have indicated that parents have been asked to make regular financial contributions to support school budgets.15
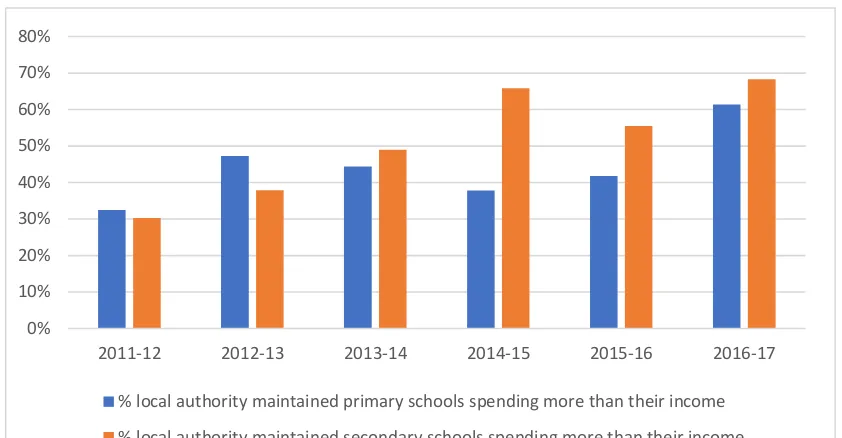
[image:10.595.88.511.377.620.2]8. Primary schools were in a comparatively better position, with the proportion of local authority maintained primary schools in deficit increasing from 5.2% in 2010–11 to 7.1% in 2016–17, and the average deficit rising from £72,042 in 2010–11 to £107,962 in 2016–17. Regional disparities have also persisted. The North East had the highest number of local authority maintained primary schools in deficit in 2016–17 at 10.1%, against 3.4% in the East of England.16 Comparable data on academy finances are not readily available. The Education Policy Institute’s analysis of National Audit Office (NAO) assessments noted that the proportion of academies in deficit remained comparatively low, though there was an “increase in the propensity [of academies] to have expenditure that exceeded income”, with 44.1% and 60.6% of primary and secondary academies respectively spending more than their income in 2014–15.17
Fig 1: Local authority maintained schools in deficit
0% 5% 10% 15% 20% 25% 30%
2010-11 2011-12 2012-13 2013-14 2014-15 2015-16 2016-17
% local authority maintained primary schools in deficit % local authority maintained secondary schools in deficit
13 National Audit Office, Converting maintained schools to academies, HC 720, 22 February 2018, p8 14 Education Policy Institute, School funding pressures in England, March 2018, p5
15 Fair Funding for All Schools (FUN0030) para 23
Fig 2: Local authority maintained schools spending more than their income
0% 10% 20% 30% 40% 50% 60% 70% 80%
2011-12 2012-13 2013-14 2014-15 2015-16 2016-17
% local authority maintained primary schools spending more than their income % local authority maintained secondary schools spending more than their income
Source: Education Committee analysis based on Education Policy Institute data18
9. In 2016 the National Audit Office warned that schools were being expected to make efficiency savings of £3 billion by 2019–20 through better procurement (£1.3 billion) and by using staff more efficiently (£1.7 billion).19 Both aims were seen as problematic,20 given that the Department’s previous aspiration to reduce procurement spending by £1 billion in the previous Parliament was not met,21and staff efficiencies risked cuts to staff numbers.22 The NAO observed that the Department’s statistical calculations indicated only that schools “should be able to make the required savings [ … ] but [it] cannot be assured that these savings will be achieved in practice”.23 The NAO also highlighted the difficult capital funding landscape, stating that it would cost £6.7 billion to return all school buildings to satisfactory or better condition, and a further £7.1 billion to bring parts of school buildings from satisfactory to good condition.24 A thorough assessment of the cost of removing asbestos from school buildings would also need to be taken into consideration.
Achieving education spending efficiencies and the use of consultants
10. During our inquiry we heard reports regarding the Department’s approach to achieving efficiencies in education spending. In 2018, the Department began piloting the use of contracted ‘school resource management advisers’ (SMRAs) who were sent to schools to identify resource efficiencies. In a speech to the Institute of School Business Leadership, the Parliamentary Under-Secretary of State for the School System, Lord
18 Education Policy Institute, School funding pressures in England, March 2018
19 National Audit Office, Financial sustainability of schools, HC 850, 14 December 2016, paras 1.11–1.12
20 Committee of Public Accounts, Financial sustainability of schools, Forty-ninth Report of Session 2016–17, HC 890, pp5–7
21 National Audit Office, Financial sustainability of schools, HC 850, 14 December 2016, paras 1.11–1.12 22 Education Policy Institute (FUN0064) para 1.5
Agnew, announced that the advisers had identified £35 million of wasted money or “essentially misdirected resources” across the 70 schools they had visited, averaging at £500,000 per school.25Lord Agnew described himself as “a pig hunting for truffles when it comes to finding waste in schools”, wagering a “bottle of champagne and a letter of commendation” that his team could find “some waste in your school”.26 The Department earmarked a further £2.3 million to increase the number of SMRAs.27
11. In March 2019, reports seen by Schools Week revealed that the Department’s resource management advisers had suggested cost-cutting options including limiting pupils’ lunch portions, keeping half of the money raised at charity events, replacing senior staff with less qualified staff on poorer contracts, and using spare staff to teach three classes at a time in the dining room.28In response, Lord Agnew said the resource management advisers should not be “framed as a cost-cutting initiative”, and rejected the notion that “the work of SRMAs does not have the interests of pupils at heart”.29When we raised the issue with Ministers during our evidence session, the Minister for School Standards, Rt Hon Nick Gibb MP, maintained the recommendations had been taken “out of context” and that it was
important that schools are using taxpayers’ money as effectively as possible. [School resource management advisers] are very skilled and can show schools how to use their money effectively to find efficiencies.30
Government position on school and college funding levels
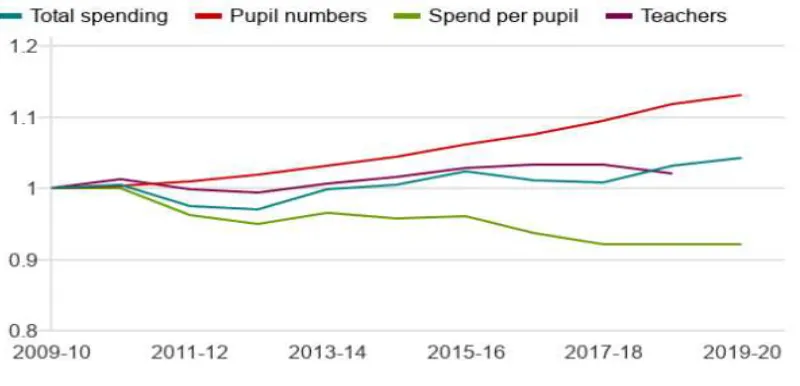
12. The Government has maintained that “there is more money going into our schools than ever before”.31We heard real frustration regarding this position.32Witnesses to our inquiry highlighted that, whilst the Government’s contention was factually accurate, it failed to capture the full picture. Funding had not kept pace with large increases in the pupil population size—which has been rising since 2010 and is expected to reach 7.698 million by 2024, up from 7.6 million in 2018—or the complexity of support requirements.33 The Government’s contention also included targeted funding such as Pupil Premium which would not have benefited all schools in the same way.34 More widely, we heard that schools had increasingly been asked to cover additional services—including pupil mental health, radicalisation checks, monitoring health and social issues, mentoring new teachers and so forth—without commensurate funding increases to cover the additional resources required.35
13. A multi-billion pound funding uplift would be needed to address the myriad issues facing schools and colleges, though the precise figure remains unclear. Simply reversing the 8% school funding gap would require a £3.8 billion uplift, based on a 2019–20 schools
25 Tes, Exclusive: ‘Colossal’ £500,000 wasted per school claims minister, 21 November 2018
26 Schools Week, Minister bets heads a bottle of champagne he can find savings in their schools, 21 November 2018
27 Schools Week, DfE to spend 2.3 million on new army of cost cutting consultants, 30 August 2018
28 Schools Week, Limit pupils’ lunch portions to save money, say Agnew’s cost-cutting advisers, 28 March 2019 29 Schools Week, If schools want more money from government, they must use funds efficiently, 15 April 2019 30 Q476
31 GOV.UK, Education in the media: funding, 28 September 2018
32 WorthLess? (FUN0100) para 13; National Education Union (FUN0073) para 12
33 Department for Education, National pupil projections - future trends in pupil numbers, 12 July 2018, p4; Q1 34 Q2
funding budget of circa £44 billion, though this would not reflect more subjective judgements of what schools require.36 We discuss such funding requirements in greater detail in Chapter 7.
Fig 3: The population boom: total school spending in England, pupil numbers, teachers, and spending per pupil relative to 2009 levels
Source: IFS analysis commissioned by BBC37
14. We asked the Minister for School Standards why the Department had maintained the ‘more money than ever’ line for so long when the evidence showed schools were suffering from real-terms reductions in per pupil funding.38He noted the difficult state of public finances going back to the 2008 financial crash,39but said the Department had
always acknowledged that schools are facing cost pressures, but [ … ] the facts are that between 2010 and 2015 there was a real-terms protection per pupil, and that from 2017 onwards we are increasing the amount of funding for every pupil in every school.40
15. We noted the evolution of the Government’s rhetoric in this regard. In response to a critical 2017 report by the Committee of Public Accounts on school funding, for example, the Department stressed that school funding was at the “highest level on record”41 and believed that its funding commitments meant “the future challenge for the system as a whole [will be] more about maximising the impact of resources [ … ] rather than managing cost pressures”.42
16. In 2018, the Secretary of State continued to herald the “record investment we are making in schools”,43 whilst noting that “[o]f course, I recognise that pupil numbers are
36 Institute for Fiscal Studies, Extra spending on education in England – the numbers explained, 18 June 2019 37 BBC, Seven charts on the £73,000 cost of educating a child, 19 November 2018
38 Qq349–50 39 Q352 40 Q349
41 GOV.UK, Blog, Education in the media, 29 March 2017
42 HM Treasury, Government response to the Forty Ninth Report of Session 2016–17, Department for Education: Financial sustainability of schools, Cm0595, para 1.2
rising, we are asking schools to do more and schools are facing cost pressures”.44 In a 2019 speech at the Association of School and College Leaders annual conference, the Secretary of State said he had “heard the message on funding loud and clear”.45
17. We therefore pressed the Ministers for details on how the Department was actually going to tackle the school and college funding crisis. The Minister for School Standards noted the opportunities presented by the upcoming spending review, acknowledging that the Treasury had to “balance competing demands” but insisting that the Department would “present [its] case in the most effective way possible”.46
18. We are pleased that the Department is beginning to acknowledge the significant financial strain that schools and colleges are under. There is simply not enough core funding, and the capital funding landscape is becoming increasingly concerning. The Department’s recognition of this problem now needs to be translated into significant funding increases.
19. The Department must make the strongest possible case to the Treasury for a multi-billion pound funding increase in the next spending review, and ensure this is aligned with the requirements for a ten-year plan as set out in Chapter 7 of this Report.
20. We heard disturbing reports that the Department was spending millions on ‘school resource management advisers’ whose cost-saving suggestions included keeping money raised at charity events, cutting children’s food portions, and using spare staff to cover three simultaneous classes in a school dining hall. The Minister said these recommendations had been taken “out of context”. We call on the Department to release the full reports to us, to show the context in which the recommendations were made.
21. In response to this Report, the Department should provide us with the full documents described by Schools Week, a breakdown by category of the measures suggested by school resource management advisers across the country, how much the resource advisers cost, and an evaluation of the long-term value for money provided by their cost-saving recommendations.
The Department’s use of data
22. The accuracy of education spending data, and the Department’s interpretation of it in particular, has been the subject of controversy.47 For example, the Department has repeatedly cited the Institute for Fiscal Studies when stating that “real-terms per-pupil funding for five- to 16-year-olds in 2020 will be more than 50% higher than it was in 2000”.48 Whilst this was not untrue, the wider context in the IFS data provided a more representative breakdown. The IFS report stated that “primary and secondary school spending per pupil rose by over 50% in real terms between 2000–01 and 2010–11”. The very next paragraph stated that “[t]otal school spending per pupil fell by 8% in real terms
44 Rt Hon Damian Hinds MP, correspondence with the Chair of the UK Statistics Authority, 8 October 2018 45 GOV.UK, Damian Hinds speech at the Association of School and College Leaders’ annual conference 2019, 15
March 2019 46 Q345
47 See for example Independent, Education Secretary forced to admit that he wrongly claimed school spending is going up, 14 March 2018
between 2009–10 and 2017–18, and will only be about 14% higher in real terms in 2017–18 than in 2003–04”.49 We noted that such context did not appear have featured particularly prominently in the Department’s communications.50
23. In October 2018 the UK Statistics Authority (UK SA) wrote to the Department outlining concerns over its use of various school funding statistics in public communications and the lack of context, stating that
figures were presented in such a way as to misrepresent changes in school funding [ … ] school spending figures were exaggerated [ … ] The result was to give a more favourable picture.51
24. The UK SA urged the Department to develop an official statistics publication for school funding to make it “easier for the Department to refer to a respected and consistent source. It would enable people to be confident that figures used had been subject to quality assurance and would enable them to explore any known quality issue”.52
25. Publicly available data on school funding is extremely varied and subject to different calculations from a variety of sources. We are concerned this confusion can be exploited to portray a misleading picture. Having a single, reliable resource provided via an easily accessible official statistics publication would help resolve ongoing disputes over funding levels and how they are calculated. We are confident that the Department would welcome the additional transparency and public confidence that such a resource would bring.
26. The Department should develop an official statistics publication for school and college funding.
49 Institute for Fiscal Studies, 2018 Annual Report on Education Spending in England, September 2018, p7 50 HC Deb, 13 November 2018, vol 649 col 246; Education Committee, Oral evidence: school and college funding,
HC 969, 3 April 2019, Q333
3
Core school funding
Background [image:16.595.97.511.310.483.2]27. The main source of revenue for 5–16 school funding comes from the dedicated schools grant (DSG), which is notionally divided into schools, early years, and high needs funding blocks.53 Since the introduction of the National Funding Formula (NFF) from April 2018, the size of each block has been determined by a specific formula.54The formula for schools included a set of 14 weighted factors to calculate funding distributions. For the year 2019–20 the basic per-pupil funding was weighted at 73.%, whilst the additional needs and school-led funding accounted for 17.6% and 8.8% respectively.55
Fig 4: Department’s graphic on factors in the schools National Funding Formula (not to scale)
Funding for factors in italics will be allocated to local authorities in 2019–20 on the basis of historical spend. Source: Department for Education.56
53 For 2018–19 onwards, the Government introduced a fourth block, the central schools services block, which is funding allocated to local authorities to carry out central functions on behalf of pupils; it was created by combining two previous funding streams.
54 The early years block which was allocated on a national funding formula basis for the first time in 2017–18. See Department for Education, The National Funding Formula for Schools and High Needs: Policy Document, September 2017, p7
55 For further information on these factors, see: Department for Education, The National Funding Formula for Schools and High Needs: Policy Document, September 2017, pp 11–21. For the unit values, total funding and proportion of spend through each factor in the 2019–20 formula, see: Department for Education, The National Funding Formulae for Schools and High Needs 2019 to 2020, July 2018, p10
Fig 5: National Funding Formula: graphic representation of weightings
* Minimum per pupil funding: 0.6% (£187m) / ** English as an additional language: 1.2% (£407m) / *** Mobility: 0.1% (£21m) / **** Sparsity: 0.1% (£25m) / ***** Premises: 1.9% (£641m)
Source: Education Committee analysis using Department data57
28. The NFF represented a substantial change from previous years, when funding allocations were chiefly determined by looking at local authority spending in the previous year,58 which in turn was based on central Government allocations that were themselves largely influenced by the characteristics of the local authority in the early 2000s.59This approach resulted in significant regional variations, some of which were intentional (for example London weightings) whilst others appeared to be more the result of accumulated historical decisions.60 An overhaul of the funding system was pledged by the Conservative Government in 2015 and in the 2017 Conservative Party manifesto.61
29. The NFF was accordingly introduced to make funding more transparent, and address funding variances between schools and pupils with similar characteristics. Announcing
57 Department for Education, The national funding formulae for schools and high needs 2019 to 2020, July 2018, p10
58 Education and Skills Funding Agency, Dedicated Schools Grant: Technical Note 2016 to 2017, December 2015, p4 59 Institute for Fiscal Studies, School Funding Reform in England: a smaller step towards a more sensible system,
will the final leap ever be made?, 21 September 2017 60 Ibid.
the policy, then Secretary of State Justine Greening said the NFF would direct resources to where they were most needed and address “manifest unfairness” under the existing system:
for the first time, the resources that the Government are investing in our schools will be distributed according to a formula based on the individual needs and characteristics of every school in the country.62
30. To provide stability for schools and local authorities during the transition period, the Department planned for local authorities to continue setting a local formula to determine funding distribution and individual school budgets in their areas up to 2019–20. Under the so-called ‘soft formula’, local authorities continue to play a role in shaping the size and allocation of budgets to schools.63 The next stage in the NFF policy plan involved moving to the ‘hard formula’, under which a single national formula would set school budgets. This would have the effect of largely cutting local authorities out of the allocation and distribution process.64 This would require legislation, however, and its implementation has been delayed. The Department confirmed the soft formula would continue in 2020–21.65
Practical implementation
31. Our evidence on the intentions behind the NFF was largely positive, though views on the level of local flexibility were more mixed. We heard from councils that the current soft formula could capture local complexities and provide flexibility for appropriate interventions much better than the hard formula.66 The National Education Union also supported a soft formula, arguing that “no ‘hard’ national funding formula can account for, quantify or respond to every local circumstance”.67The Local Government Association said that a future formula would need to include an ongoing element of flexibility allowing councils to adjust distributions “if that produces better outcomes for schools and pupils”.68 On the other hand, we heard that existing local flexibilities had led to different decisions being taken by different local authorities in objectively similar circumstances. The National Association of Head Teachers (NAHT) believed that a continuation of the soft formula risked perpetuating funding anomalies within a distribution system that was based more on location than actual levels of need.69
32. More widely, our evidence highlighted deep concerns about the level of funding required to make the new system ‘fairer’, as opposed to purely redistributive. In particular, we heard that age-weighted pupil unit (AWPU)—which comprises the bulk of the NFF spend—and the lump sum were too low; allocations were not based on assessments of need levels or operational costs; and there was little clarity around what the lump sum
62 HC Deb, 14 September 2017, vol 628 cols 1024–7
63 Department for Education, Department for Education, The National Funding Formula for Schools and High Needs: Policy Document, September 2017, p8
64 Department for Education, The National Funding Formula for Schools and High Needs: Policy Document, September 2017, para 10
65 Department for Education, The national funding formulae for schools and high needs 2019 to 2020, July 2018, para 5
66 The Local Government Association (FUN0055) paras 2.4, 6.1; Hampshire County Council (FUN0060) para 3.2; Staffordshire County Council (FUN0062) para 11; National Education Union (FUN0073) para 6; County Councils Network (FUN0076) para 41; UNISON (FUN0081) para 4.3
67 National Education Union (FUN0073) para 6
and AWPU were intended to cover.70 Regarding the budgets set for schools, Luke Sibieta from the IFS explained that different decisions were taken among local authorities on the weighting of primary and secondary school funding, though the underlying reasoning was not always clear. The Department had then replicated the average of these local formulae to minimise turbulence:
they took that decision because they were not aware of any evidence that it should move one way or the other. It does not necessarily mean it is the right level.71
33. The funding formula was also criticised for providing insufficient financial increases to schools in historically underfunded areas.72These issues, together with the inclusion of historical factors within the NFF, did not appear to support the Government’s contention that the new system offered a “fairer” funding model.73When questioned on this matter, the Minister for School Standards maintained that the NFF was
a much fairer way of distributing funding because previously we were basing the distribution of funds to local authorities on historic[al] data [ … ] the first thing is that we are [now] basing the national funding formula on current, up-to-date data.74
34. He acknowledged that the age-weighted per pupil funding formula was “broadly speaking, roughly the aggregation of 150 local formulae”, which were adjusted slightly to account for issues such as low prior attainment.75Regarding adjustments to the weighting, he argued that
if you think then that the 73% of the national funding formula that is the age-weighted pupil unit is too low and you think it should be 75% or 80%, the beauty of the national funding formula is that we can have this debate nationally.76
35. Given the concerns over the insufficient size of the total funding pot in question, however, we highlighted the amount of money that went into seemingly disparate Departmental projects and asked whether this would not be better spent on increasing the core funding pot to aid financial stability and strategic planning.77The Minister said such funding announcements typically arose when the Department became aware of spare money mid-financial year, or during the roll-out of national programmes.78 He stressed that the Department would be “presenting the best case possible to Treasury for
70 f40 Group of Authorities (FUN0040) para 7.1; Grammar School Heads’ Association (FUN0020) para 5;
Northamptonshire County Council (FUN0042) paras 2.3–2.7; NAHT (FUN0054) para 32; Cambridgeshire County Council (FUN0078) para 2.6; Morris Education Trust (FUN0087) para 3.3; Cambridgeshire Schools Forum (FUN0037) para 8
71 Q66
72 Hampshire County Council (FUN0060) para 3.1; North Yorkshire County Council (FUN0061) para 2; National Education Union (FUN0073) para 39; WorthLess? (FUN0100) paras 10–11
73 Q472; Essex County Council (FUN0016) para 11; f40 Group of Authorities (FUN0040) paras 2.1, 4.1; Hampshire County Council (FUN0060) paras 3.1, 3.6
the future years of the spending review”.79 Regarding the delayed roll-out of the hard formula, the Minister said the intention was to move to a hard formula “eventually”, but that local authorities would continue to distribute funding up to 2020–21 in the interests of providing flexibility.80
36. We fully support the intentions behind the National Funding Formula (NFF), and it is clear to us that maintaining a degree of local flexibility is important. We are nevertheless concerned that the so-called ‘soft’ formula continues to be based on local historical rates that perpetuate the anomalies it was supposed to remove. These historical factors hamper the NFF’s potential to act as a truly redistributive tool.
37. The Department should bring forward legislative proposals to implement a ‘hard’ National Funding Formula for schools as soon as a parliamentary majority is available. We encourage the Department to investigate how best to address outliers whose individual circumstances might not be accurately captured by even the best-designed funding formula.
38. Schools require an urgent funding increase. The age-weighted pupil unit (AWPU) funding in the NFF is set too low.
39. The Department must raise the AWPU for the next spending review period. The Department must also commit to revising the AWPU again following a comprehensive review of the real-world costs of school education, as recommended in Chapter 7.
National Funding Formula and multi-academy trusts
40. The Department’s intention to secure consistent funding across schools via the NFF has been further complicated by the organisational structure of multi-academy trusts (MATs).81In 2018 the Department published figures on academy trust finances indicating that financial assessments of MATs were being conducted on the trust level, rather than at the individual academy level. The Department said this was “because trusts are the legal entities responsible for academies, including their finances”.82
41. As the Education Policy Institute highlighted, however, trusts pooled resources and allocated school funding levels for individual academies with little Departmental oversight. This undermined a key feature of the NFF’s redistributive approach, and weakened the transparency and consistency that the policy was intended to provide.83 School Financial Success said there was “no justification” for allowing MATs to continue with this freedom whilst removing it from local authorities under a hard formula, and called on the Department to reassess its position on MAT funding policy.84
42. The lack of clarity over MAT funding systems was also criticised. MATs have typically funded their core operations by top-slicing a percentage of the budgets from schools within their trust. Concerns have been raised in the past about where this money
79 Q501 80 Q472
81 MATs are single legal entities that run more than one academy – typically between one and ten, though some cover 40 or more schools.
82 Department for Education, Academy revenue reserves for 2016 to 2017, July 2018, p1
83 Education Policy Institute, Analysis: Why new DfE statistics may be concealing the number of academies in financial difficulties, 27 July 2018
came from. There have been multiple cases of MATs increasing their service charges when their schools were already in deficit,85or including Pupil Premium funding in the management fee.86 The NASUWT union said the freedoms and flexibilities of the current funding framework meant there was “no guarantee within the system” that education funding would be spent to the benefit of pupils,87 and criticised the “inadequate level of DfE scrutiny and therefore public accountability of spending by academy trusts”.88 High profile cases of asset stripping, whereby MATs transferred substantial financial assets from schools to themselves before collapsing, have raised additional worries around appropriate levels of oversight.89
43. We had further concerns about the wider issue of accountability within MATs, given that Ofsted had neither the powers nor the capacity to inspect individuals MATs or give them ratings. A 2017 report by our predecessor committee criticised the lack of formal inspection and accountability under Ofsted’s policy of conducting batched inspections of individual schools within trusts over a single week.90We also wrote to Lord Agnew in early 2018 outlining our ongoing concerns.91 Since then, HM Chief Inspector Amanda Spielman told us on 7 March 2018 that she “absolutely” believed Ofsted should be empowered to inspect MATs, and that “accountability systems need to reflect the way that the system actually operates today”.92
44. In December 2018, Ofsted said it would amend its approach to inspecting schools within MATs, conducting inspections across one or two terms and working with MAT leaders to “evaluate the educational effectiveness of the MAT as a whole”.93In evidence to us in February 2019, the HM Chief Inspector re-iterated her call for MAT inspections, arguing that the recent changes did not go far enough:
if decisions about behaviour policy or curriculum or how teachers are trained and supported is happening at a level above the school in an organisation then that for me is where the conversation needs to be.
[… The] summary evaluations that we have introduced in the last couple of months [ … ] take us a step in that direction but there is still space to do something that gets to the critical points, decision-making points in an organisation, more quickly and more easily.94
45. The Department must ensure that multi-academy trusts (MATs) are properly held to account over their internal operations, the way they fund themselves, and how they distribute funding to schools within their trust. We are not convinced that the current framework is adequate. The Department should confirm in response to this Report
85 Schools Week, Academy trust top-sliced £376k from school with £1m deficit, 17 May 2019 86 Schools Week, How much are academy trusts top-slicing from schools?, 27 May 2016
87 NASUWT, The NASUWT submission to the House of Commons Education Select Committee, 30 May 2018, para 4 88 NASUWT, The NASUWT submission to the House of Commons Education Select Committee, 30 May 2018, para
11
89 Education Committee, correspondence with the Parliamentary Under Secretary of State for the School System, 15 January 2018
90 Education Committee, Multi-academy trusts, Seventh Report of Session 2016–17, HC 204, 28 February 2017, para 27
91 Education Committee, correspondence with Lord Agnew, 15 January 2018; correspondence with Lord Agnew, 15 February 2018
92 Education Committee, Oral evidence: Accountability hearings, HC 341, 7 March 2018, Q621
whether, under a hard funding formula, MATs would continue to maintain discretion over allocating funds to schools within their trusts. If they would, the Department must explain how it intends to ensure this system does not undermine the NFF’s core aim of providing equitable and consistent funding across schools.
4
Post-16 education funding
Overview47. Our evidence on the state of post-16 education funding painted a troubling picture. Participation in full time further education (FE) has more than doubled since the 1980s.95 Yet across 16–19 education, funding per student fell by a full 16% in real terms between 2010–11 and 2018–19. This is twice as much as the 8% school funding fall over a similar period.96 The total size of 16–19 education funding fell by 27% in real terms, from £7.8 billion to £5.7 billion, between 2010–11 and 2018–19.97 These pressures were set against the context of rising demand from increased pupil populations, more complex special educational needs (SEN) requirements, inflation, teacher pay costs, curriculum changes, and pressure to raise standards.98
48. Budget squeezes across post-16 education institutions have not been uniform. Funding per 16–19 full-time equivalent student in the further education sector fell by 18% between 2010–11 and 2018–19, whereas school sixth forms experienced a 26% decline. Funding per student in FE colleges fell by 9% between 2012–13 and 2018–19, whilst sixth form colleges fell by 15% – a difference attributable to a disproportionately high number of disadvantaged students going to FE colleges, which then attract a funding weighting to support more challenging intakes.99 The historical differences between academic and vocational further education funding were also pronounced. On average, in 2014 OECD countries spent 8% more on vocational programmes than on academic ones; the UK spent 11% less.100The Institute for Fiscal Studies (IFS) said FE per student funding in 2019–20 was projected to be similar to 1990–91 levels – a situation described as “remarkable” given the economic and public spending increases over the past 30 years.101
49. The Government’s well-publicised funding commitments to T levels will not address the scale of these budget pressures. Whilst the substantial T level funding commitments have been widely welcomed, they would be offset by proposed reductions to the rest of further education college budgets. Per student spending has therefore been projected to be held constant up to 2019–20, rather than rise significantly. As the IFS noted, the extra money was also earmarked for additional teaching hours and was therefore “unlikely to ease the resource challenges on the sector”.102
Impacts and implications
50. The impacts of these budgetary pressures have been significant. The amount of guided learning hours for 16–19 pupils fell from 730 hours to 665 hours per student between 2012–
95 Institute for Fiscal Studies, 2018 Annual Report on Education Spending in England, September 2018, p38 96 This figure excludes apprenticeship funding. Including apprenticeship funding would bring the figure to a 14%
reduction by 2017–18. For details of the calculations see Education Policy Institute, 16–19 education: trends and implications, 13 May 2019, pp18–21
97 Education Policy Institute, 16–19 education: trends and implications, May 2019, pp7, 18. Note that this figure excludes apprenticeship funding. If included, the reduction amounts to 24% between 2010–11 and 2017–18. 98 Association of Colleges (FUN0026) para 5
99 Education Policy Institute, 16–19 education funding: trends and implications, May 2019, p7 100 Education Policy Institute (FUN0064) para 9.2
13 and 2016–17 – a reduction of 9%.103 The Sixth Form Colleges Association told us that funding pressures had led 50% of schools and colleges to drop foreign language classes, 34% had cut STEM courses, 67% had reduced support or extra-curricular services, and 77% were teaching larger classes. In addition, the institutions were increasingly having to stretch resources to deal with additional issues including mental health, duties under the Prevent programme, and meeting Gatsby career benchmarks,104 as well as providing front line support following NHS and local authority funding pressures.105We also heard that schools were having to subsidise their sixth forms using their Key Stage 3 and 4 incomes, with knock-on impacts on staff recruitment and the resources available to the rest of the school.106
51. We were particularly concerned about the social justice consequences of squeezed FE budgets. Twice as many disadvantaged 16 to 18 year-olds go to further education colleges than school sixth forms. Disadvantaged students have fewer opportunities to supplement deficient education or support services through private means,107 and we heard that FE colleges’ disadvantage funding was not ringfenced and was being stretched across multiple competing groups.108The Social Mobility Commission’s State of the Nation 2019 report found that the clustering of disadvantaged students in FE had “fuelled the image of the sector being for ‘other people’ who ‘fail at school’”.109Luke Sibieta said the FE funding dip was a “crazy” approach to financing education, given the importance of FE and sixth form colleges in providing a gateway to future success in higher education and the labour market.110
52. We asked witnesses why further education in particular had been hit so hard. James Kewin of the Sixth Form Colleges Association believed it was a political decision:
there are more votes in schools than colleges [ … ] there is no sound educational reason why there should be such a sharp drop at the age of 16 in education funding [ … ] There is no good reason why a young person in England gets 15 hours of education compared to 25 hours internationally.111 53. Emily Chapman of the National Union of Students said FE “[didn’t] have the political voice of, say, the universities”, and had struggled as a result.112Dr Birkinshaw, former President of the Association of Colleges, noted that the FE sector was not so much overlooked by the political establishment as kept in a state of “almost permanent revolution”.113She criticised the Department’s approach to directing funding at the eye-catching areas whilst core funding was kept “at an all-time low. That means we cannot
103 Education Policy Institute, 16–19 education funding: trends and implications, May 2019, p8
104 The Gatsby Benchmarks are a framework of eight guidelines that define the best careers provision in schools and colleges.
105 Sixth Form Colleges Association (FUN0041) paras 9–10 106 St Laurence School (FUN0039) para 14
107 Social Mobility Commission, State of the National 2019: Social Mobility in Great Britain, April 2019, pp60, 68–70 108 Association of Colleges (SCN0492) para 18; Gateshead College (FUN0027) paras 5.1–5.3
109 Social Mobility Commission, State of the National 2019: Social Mobility in Great Britain, April 2019, p 66 110 Q51
111 Q83 112 Q84
do our job”.114James Kewin agreed, arguing that “politically motivated uplifts” did more harm than good since they allowed the Government to rebut calls for more investment by pointing to recent initiatives:
too much of what we see in 16 to 18 now starts with the press release and works back [ … ] This kind of policy by press release is quite damaging and the much more mundane reality is we just need a higher rate of funding.115 54. Witnesses from the further education sector were clear that the first priority for the spending review should be a core funding rate increase, which had been held at £4,000 for 16 and 17 year-olds since 2013–14.116James Kewin called for a base rate of £4,760 per year which would amount to an increase of around £970 million per year.117 According to analysis commissioned from London Economics, this was needed to increase student services to minimum required levels, protect minority subjects at risk of being cut, and increase non-qualification time (for example extra-curricular activities and work experience).118
55. Several additional areas were highlighted. Funding for English and maths retakes featured prominently.119 Other areas included separate funding for increases in teachers’
pay awards and pensions, a greater capital expansion fund for 16 to 18 education;120
investment in a well-rounded education that covered mental health support, education for parents about careers prospects outside the university route, civic engagement, and giving students a voice;121 addressing the current gap in progression routes, and developing
technical education qualifications fit for the future.122
56. Following the conclusion of our oral evidence, a raft of suggested reforms to the further education sector were published under the review of post-18 education and funding led by Philip Augar.123 The Secretary of State said the Department would “look carefully at each recommendation in turn and in the round to reach a view on what will best support students and the institutions they study at”.124
Government position
57. We questioned the Ministers on the reasons behind the post-16 funding pressures and how the problem should be tackled. The Minister for School Standards said that the Government understood the challenges schools and colleges were facing, and was doing its best in the context of a difficult financial situation following the 2008 financial crisis.125
114 Q87 115 Ibid.
116 Qq89–90. The rate for 18-year olds was changed to £3,300 from 2014–15. See GOV.UK, 16–19 funding: how it works, for further details on the banding for national funding rates.
117 Based on 2018–19 total programme funding for 16 to 19 funding allocation of circa £5.1 billion. See GOV.UK, 16 to 19 allocation data: 2018 to 2019 academic year, 22 October 2018.
118 Q106; London Economics, Understanding the funding shortfall in sixth form education, October 2018, p2. See also Association of Colleges on 16-to-18 funding requirements: Association of Colleges, Autumn Budget 2018, 28 September 2018, p5; Q109
119 Qq92, 97, 110 120 Qq100, 101 121 Q101 122 Q113
123 GOV.UK, Post-18 review of education and funding: independent panel report, May 2019 124 HC Deb, 4 June 2019, vol 661 col 56
He noted that the Government had not been able to protect post-16 funding, echoing statements he made to our predecessor Committee that there had been a “very conscious policy decision” in 2010 to prioritise 5-to-16 school funding “because all the evidence is that attainment in that period determines the life chances of pupils after the age of 16”.126 58. We were pleased when the Minister for Skills and Apprenticeships Anne Milton MP informed us of her intention to “put [her] tin hat on and go into battle to fight” for increased FE funding.127The Minister confirmed that “the first thing I would like to see is the base rate rise” (though she did not provide precise figures), and agreed there needed to be greater support for post-16 mental health services.128She also said social justice and productivity should feature prominently when making a funding case to Treasury, highlighting the links between educational attainment and success in later life, and the number of people “who without a doubt have skills and talents and could be productive members of society” but did not have the right opportunities to do so.129
59. Post-16 education has been cut to the core. We note the Minister’s position about post-financial crash difficulties. Other sectors have however moved on. The continued underfunding of this pivotal stage in education is longer justifiable. These budget pressures are the result of political decisions that have had enormous impacts on young people’s educational opportunities and undermined attempts to tackle social justice. The Department must act urgently to address the damage that has been done.
60. For the now overdue spending review, the Department must make the case to the Treasury for a post-16 core funding rate raise from £4,000 to at least £4,760 per student, rising in line with inflation. This is needed to ensure pupil services can be provided at minimum acceptable levels, and prevent institutions from having to cut back still further on the breadth of subjects offered. The Department must additionally commit to revising this figure following a comprehensive bottom-up assessment of cost requirements as outlined in Chapter 7.
126 Education Committee, Oral evidence: School funding reform, HC 154, 31 January 2017, Q94 127 Q479
5
Social justice and tackling
disadvantage
Overview
61. The link between socio-economic background and attainment has remained strong in England compared to many other OECD countries, despite gradual progress over the past twenty years. Young people from disadvantaged backgrounds have continued to perform poorly in assessments compared to their more advantaged peers.130 A full 43% of pupils eligible for free school meals (FSM) at age five did not reach a good level of development in 2018, compared to 26% of those not eligible.131 To support disadvantaged children and raise educational attainment, the Coalition Government introduced the Pupil Premium in 2011 as an additional funding source for state-funded schools in England. Under Pupil Premium, schools with students registered as being eligible for free school meals (FSM) within the past six years attract a £1,320 or £935 grant for primary and secondary school students respectively.132A total of £2.4 billion was allocated in 2017–18 in respect of circa two million pupils.133
62. The impact of Pupil Premium on tackling disadvantage was difficult to assess: whilst the gap continued to close after the premium was introduced, it did not do so at an accelerated rate. Overall, schools with larger Pupil Premium budgets and stronger accountability incentives had improved more than schools with different intakes. For disadvantaged pupils in persistent poverty (i.e. those eligible for FSM for at least 80% of their time in school), the disadvantage gap widened both before and after the introduction of the premium, however.134Natalie Perera, Executive Director of the Education Policy Institute, highlighted the difficulties in attributing direct causality given the range of influencing factors, and the possibility that the premium was preventing the disadvantage gap from widening further than it otherwise might have done.135
Improving Pupil Premium
63. Our evidence indicated that, on the whole, the idea of the Pupil Premium enjoyed substantial support.136There were however a number of concerns that witnesses suggested needed to be addressed regarding the premium’s use, how the mechanism operated, accountability systems, and the eligibility criteria.
130 Education Policy Institute, Key drivers of the disadvantage gap, July 2018, p4
131 Social Mobility Commission, State of the Nation 2018–19: Social Mobility in Great Britain, April 2019, p vii. Level of development refers to measures by the early years foundation stage profile assessment framework) 132 Figures for 2019–2020, available at Education & Skills Funding Agency, Pupil premium: conditions of grant
2019 to 2020, 17 December 2018. The Government also provides £2,300 for looked-after children and £300 for children with parents who have served in the armed forces.
133 House of Commons Library, Briefing Paper, The Pupil Premium, 17 April 2018, p3 134 Education Policy Institute (FUN0064) paras 11.9–11.10
135 Qq32–3
Use of the Pupil Premium
64. There was widespread acknowledgement that Pupil Premium funding was being used to plug holes in school budgets, rather than being directed towards disadvantaged pupils.137 The Sutton Trust and Education Endowment Foundation said a “small but significant” number of schools saw offsetting budget cuts elsewhere as the main priority for the Premium funding.138 We were also made aware of problems within multi-academy trusts viewing Pupil Premium as a replacement for core funding.139Luke Sibieta said the situation was unsurprising, given that school funding would have been cut in real terms between 2010 and 2015 were it not for the Pupil Premium.140 The Education Policy Institute observed that it was
surprising that the disadvantage gap continues to narrow at all—given the wider context of children’s services—and this presents a real risk that the Pupil Premium becomes a backstop against worsening attainment gaps for disadvantaged children rather than a driver for improvement.141
65. Additional concerns were raised about the effectiveness of Pupil Premium even when it was being used as intended. We heard that many schools had initially used the money for new teaching assistants, whereas recent evidence suggested that these resources could have been deployed differently to better maximise educational outcomes.142Luke Sibieta highlighted the importance of using the premium for evidence-based initiatives to ensure interventions were targeted and transformative.143The Sutton Trust proposed introducing an incentive system under the National Funding Formula to reward schools demonstrating good use of Pupil Premium money and evidence-based best practice.144 This could involve building on the Pupil Premium Awards scheme to ensure that schools consistently improving results whilst closing the attainment gap were more systematically recognised and rewarded.145
Pupil Premium as a funding mechanism
66. Pupil Premium funding allocations have not been rolled into the National Funding Formula. We considered the case for these two mechanisms to be rolled into one on the grounds that the NFF already contained a disadvantage allowance,146 or that the premium funding was vulnerable to Spending Review negotiations.147When we explored this
137 Essex County Council (FUN0016) para 10; Grammar School Heads’ Association (FUN0020) para 13; Ambitious about Autism (FUN0025) paras 11–12; Northamptonshire County Council (FUN0042) para 4.1; Mr John Eccleston (FUN0047) para 8; The Netherhall School and Sixth Form (FUN0049) para 4; Mr Paul Atkinson (FUN0050) para 8; Devon County Council (FUN0051) para 3.1; National Foundation for Educational Research (NFER) (FUN0056) para 15; Ark (FUN0059) para 5; North Yorkshire County Council (FUN0061) para 14; Education Policy Institute (FUN0064) para 11.13; Association of Directors of Children’s Services (FUN0065) para 17; National Education Union (FUN0073) para 40; Cambridgeshire County Council (FUN0078) para 4.1; Effervesce (FUN0098) para 4.1; WorthLess? (FUN0100) para 8
138 Sutton Trust and Education Endowment Foundation (FUN0074) paras 16–18 139 Q407
140 Q26
141 Education Policy Institute (FUN0064) para 11.13 142 Qq27, 54
143 Q28
144 Sutton Trust and Education Endowment Foundation (FUN0074) para 21
option in our oral evidence sessions, however, Julia Harnden of the Association of School and College Leaders warned that there was “a real risk if we were to support absorbing it that we would just see a net reduction in funding”.148 Maintaining separate mechanisms would also ensure the Department could target deprived pupils using different measures, such as the Income Deprivation Affecting Children Index (IDACI), which might identify local deprivation that was not captured by the Pupil Premium.149
67. The option of ring-fencing Pupil Premium drew similarly mixed reactions. Darren Northcott of the NASUWT union supported the idea, saying this would ensure premium money was spent on the purposes for which it was intended.150 Valentine Mulholland of the National Association of Headteachers believed however that ring-fencing would be “really difficult” given the current funding pressures, and that there were already strategies and oversight mechanisms in place to guide decision-making.151 We also heard that not all disadvantaged pupils attracted the Pupil Premium; ring-fencing the budget might therefore prevent schools from using the premium funding to support initiatives supporting all disadvantaged children irrespective of whether they were claiming FSM.152
Accountability
68. The accountability system was identified as a further area in need of improvement. Maintained schools have been required to publish details of their Pupil Premium spend and impact, and academies have been encouraged (though not required) to do likewise. Stephen Tierney said the current system was “a waste of people’s time” because the plans were not properly looked at, and accountability to Ofsted was undermined by the fact that inspectors were only able to offer a “cursory glance” during visits due to other priorities.153 He suggested instead an outcome-orientated form of attainment measure for people from disadvantaged backgrounds that did not get lost in the wider performance tables.154 Jules White of the WorthLess? campaign group cautioned against an overly simplistic accountability measure predicated entirely on attainment data, however, as this data could go up or down substantially due to different student cohorts rather than any changes to funding or interventions.155
69. We raised our concerns over spending and accountability with the Ministers. The Minister for School Standards acknowledged issues around governance and said the Department had taken action to improve accountability within the system. We pressed him to clarify what action the Department was taking regarding inaccurate information published on school websites. He said any such examples should be brought to the Department’s attention “and we will take them up”.156 When asked about how the Pupil Premium system could be reformed—for example by matching more closely allocation
148 Q217
149 Education Committee, Oral evidence: School funding reform, 31 January 2017, HC 154, Q18 150 Q199
levels to the extent and duration of deprivation—the Minister agreed there was potential to change the distribution system, but noted that the fixed overall size of the £2.4 billion spend meant any adjustments would result in winners and losers.157
70. It is clear that Pupil Premium is being used to plug holes in school budgets rather than being directed at disadvantaged children. This is concerning but sadly unsurprising, given the financial pressure schools are under. Schools should not have to choose between running their core operations and supporting disadvantaged pupils. Ring-fencing Pupil Premium spending, or subsuming it under the National Funding Formula, will not fix the underlying problem that there is simply not enough money in the system.
71. The Department should confirm that it does not intend to ring-fence the Pupil Premium or subsume it within the National Funding Formula. Additionally, the Department should investigate how the Pupil Premium distribution could be made fairer so that allocations match more closely the child’s level and duration of deprivation.
72. The Department should review and revise the Pupil Premium compliance system, and in particular Ofsted’s role and oversight, to improve accountability whilst allowing flexibility for local-level innovation–for example via a more detailed measure of the performance of children from disadvantaged backgrounds. The Department should set out its proposed timetable for doing so in response to this Report.
73. The Department should review options for an enhanced incentive system to systematically reward schools making good use of the Pupil Premium for evidence-based interventions that close the attainment gap whilst improving school results. The Department should set out the options and implementation plan in response to this Report.
Eligibility criteria
74. In order for students to attract the Pupil Premium funding, they need to have been registered for FSM. In 2013 the Department estimated around 160,000 children in England were not claiming FSM,158 resulting in millions in lost pupil premium funding.159 More recent estimates suggested as many as one in ten eligible pupils were not being registered.160 We heard that the introduction of Universal Infant Free School Meals had further reduced the uptake of free school meals among eligible families, with consequent impacts on Pupil Premium allocations.161
75. The Rt Hon Frank Field MP, Chair of the Work and Pensions Committee, told us the Department needed to explore how local authorities could be empowered to maximise FSM take-up. He suggested that school application and universal credit forms could be amended to include National Insurance numbers and a tick-box system to improve the
157 Qq502–3
158 Department for Education, Pupils not claiming Free School Meals – 2013, December 2013, p5 159 Rt Hon Frank Field MP (FUN0001) paras 5–6
160 Social Mobility Commission, State of the Nation 2018–19, April 2019, p52