This is a repository copy of
The Influence of the Relative Number of Impingement and
Effusion Cooling Holes on Gas Turbine Combustor Wall Heat Transfer
.
White Rose Research Online URL for this paper:
http://eprints.whiterose.ac.uk/119954/
Version: Accepted Version
Proceedings Paper:
El-Jummah, AM, Nazari, A, Andrews, GE orcid.org/0000-0002-8398-1363 et al. (1 more
author) (2017) The Influence of the Relative Number of Impingement and Effusion Cooling
Holes on Gas Turbine Combustor Wall Heat Transfer. In: Proceedings of 13th International
Conference On Heat Transfer, Fluid Mechanics and Thermodynamics (HEFAT2017). 13th
International Conference On Heat Transfer, Fluid Mechanics and Thermodynamics
(HEFAT2017), 17-19 Jul 2017, Portoroz, Slovenia. , pp. 190-195.
eprints@whiterose.ac.uk https://eprints.whiterose.ac.uk/ Reuse
Unless indicated otherwise, fulltext items are protected by copyright with all rights reserved. The copyright exception in section 29 of the Copyright, Designs and Patents Act 1988 allows the making of a single copy solely for the purpose of non-commercial research or private study within the limits of fair dealing. The publisher or other rights-holder may allow further reproduction and re-use of this version - refer to the White Rose Research Online record for this item. Where records identify the publisher as the copyright holder, users can verify any specific terms of use on the publisher’s website.
Takedown
If you consider content in White Rose Research Online to be in breach of UK law, please notify us by
THE INFLUENCE OF THE RELATIVE NUMBER OF IMPINGEMENT AND
EFFUSION COOLING HOLES ON GAS TURBINE COMBUSTOR
WALL HEAT TRANSFER
Abubakar M. El-Jummah
Department of Mechanical Engineering, University of Maiduguri, P. M. B. 1069
Maiduguri, Borno, Nigeria
Ahmad Nazari, Gordon E. Andrews, John E. J. Staggs School of Chemical & Process Engineering,
University of Leeds, Leeds, LS2 9JT, UK
E-mail: ξprofgeandrews@hotmail.com>
ABSTRACT
The optimization of cooling hole geometry for combined impingement and effusion cooling of gas turbine combustors was investigated. The most common design is for there to be equal number of impingement and effusion holes. However, the number of holes is usually set by the requirement of the effusion wall to have good film cooling and a large number of holes is used with small diameter and a low pressure loss or small pitch to diameter ratio, X/D. The impingement wall does not need a large number of holes. This work compared impingement/effusion wall designs with equal number of holes for three hole numbers: 4306/m2, 9688/m2 and 26910/m2. Each of these effusion designs was investigated with a 1076/m2 impingement wall. The internal wall heat transfer for impingement/effusion cooling was measured and predicted using conjugate heat transfer (CHT) computational fluid dynamics (CFD). The work was only concerned with the internal wall heat transfer and not with the effusion film cooling and there was no hot gas crossflow. The CHT/CFD predictions showed good agreement with measured data and the highest number of effusion holes for the 1/25 hole ratio gave the highest hx. However, comparison with the predicted and experimental results for equal number of impingement and effusion holes for the same Z, showed that there was little advantage of decreasing the number of impingement holes, apart from that of decreasing the Z/D significantly for the 1/15 hole ratio, which increased the heat transfer. The largest number of effusion holes had the highest heat transfer due to the greater internal surface area of the holes and their closer spacing.
INTRODUCTION
The combination of impingement and effusion cooling offers both the best adiabatic film cooling effectiveness
and the best overall wall cooling effectiveness which is close to that for transpiration cooling [1, 2]. The present work predicts the internal wall heat transfer and does not have any hot gas crossflow. The effusion jets contribute to the overall internal wall heat transfer through their internal surface area and the heat transfer around the hole inlet. The combination of effusion cooling with backside impingement cooling avoids the main problem area of impingement only cooling, that of the impact of the crossflow in the gap which normally deteriorates the impingement heat transfer [3]. In most investigations of impingement/effusion cooling there is the same hole pitch for the impingement and effusion holes which gives one impingement hole for every effusion hole [4-6]. However, the design choice for the number of holes and hole design is governed by the optimization of the effusion surface to achieve the best adiabatic film cooling effectiveness and this is normally for the largest number of holes, n [7-9], or hole density [10].
A large n is not required for impingement cooling and the number of holes used for the same impingement wall porosity has a relatively low effect on impingement heat transfer [11, 12]. The effect of the number of impingement holes is mainly due to the impact of the cross flow, as for a fixed wall cooling length the number of rows of holes in the crossflow direction increases with the number of upstream rows of holes and hence increases as the total number of holes increases. The other effect is that the hole size reduces as the number increases and this changes Z/D for a fixed Z. This is shown to be the main action of the reduced number of impingement holes in this work.
NOMENCLATURE
A Hole porosity = {( /4) D2}/X2
Cd Hole discharge coefficient,
D Hole diameter, m
G Coolant Mass flux, kg/sm2bar,
Please reference as:
Abubakar M. El
-
Jummah, Ahmad Nazari, Gordon E. Andrews, John E. J. Staggs. The
Influence of The Relative Number of Impingement and Effusion Cooling Holes on Gas
Turbine Combustor Wall Heat Transfer. Proceedings of 13th International Conference on
Heat Transfer, Fluid Mechanics and Thermodynamics (HEFAT 2017). Portoroz, Slovenia, 17
h Heat transfer coefficient (HTC), W/m2K
hx Surface ave. (X2) heat transfer coefficient, W/m2K
kf Fluid thermal conductivity, W/mK
M ’Mass flow rate per hole, kg/s
n Number hole/surface area (or hole density), m-2
Nu Nusselt Number Density of air, kg/m3
P Impingement or effusion wall pressure loss, Pa P Coolant supply static pressure (approx. 1bar in Expts.) Pr Prandtl number
R Gas Constant for air, 287 J/kg/K Re Reynolds number
T Local effusion wall temperature, K Tc Coolant temperature, 288K
Tw Target wall hot side temperature (360K)
Vj Impingement jet mean velocity, m/s
Vh Effusion hole mean velocity, m/s
Kinematic viscosity, m2/s
X Hole to hole pitch, m
y+ Inner variable wall normal coordinate ( U / )
Z Impingement to effusion gap, m
Subscripts
avg Average f Fluid h Hole I Impingement j Jet c Coolant L Local m Mean s Surface w effusion wall Z Gap
In the present work the influence of crossflow is eliminated by the discharge of the impingement jet air through the effusion holes. The effect on Z/D is present as the work was carried out at constant Z. As impingement heat transfer increases at low Z/D there could be an advantage of using a small number of impingement holes, which makes their diameter larger and the Z/D smaller for a fixed Z. This then increase the combined impingement/effusion wall heat transfer. This was investigated in the present work both experimentally and using CHT/CFD. Another effect of the combined effusion and impingement wall with more effusion holes than impingement holes is postulated to be the effect of the
effusion hole ‘suction’ on the wall impingement flow.
IMPINGEMENT/EFFUSION GEOMETRIES
The impingement/effusion geometries investigated are summarized in Tables 1 and 2, with the equal number of impingement and effusion holes [6] in Table 1 and the small number of impingement holes in Table 2. Three ratios of impingement to effusion hole number were investigated: 4/1, 9/1 and 25/1. The advantage of a large number of effusion holes is mainly in the improved effusion film cooling, that is not studied in the present work, which concentrates on the internal heat transfer in the wall. Table 2 shows that thelarger number of effusion holes had the internal wall cooling advantage of increased internal hole surface area per m2 (n DL), which was a factor of 2.5 increase between the 4306 and 26,910 m-2 effusion walls. This will give increased internal effusion wall heat transfer as n increases. Table 2 also shows a disadvantage of the reduced number of impingement holes, which is the reduced internal wall area, so that less internal cooling of that surface will occur.
One of the most significant factors for impingement heat transfer using a practical constant impingement gap, Z, is the reduction in the Z/D ratio when a low number of [image:3.612.321.579.196.302.2]
impingement holes is used with larger diameter, as shown in Table 2. With 1075 m-2 impingement holes and an 8mm gap the Z/D was 2.78 and this is close to the optimum Z/D for the highest heat transfer [13]. If a larger number of effusion jets was used so that there was a 1/1 ratio with the effusion holes, then at constant Z, the Z/D would increase and this decreases the impingement heat transfer. It is shown that this is likely to be the main cause of the predicted small increase in internal wall heat transfer predicted in the present work of using a reduced number of impingement holes at constant Z.
Table 1: Geometries for Equal Number of Holes
Variable Impingement Effusion
n ( m-2) 4306 9688 26910 4306 9688 26910 Array 10×10 15×15 25×25 10×10 15×15 25×25 Dmm 1.41 0.93 0.63 3.27 2.23 1.30 X mm 15.24 10.10 6.10 15.24 10.1 6.10 L/D 4.50 6.83 10.08 1.94 2.85 4.89 X/D 10.80 10.83 9.54 4.7 4.7 4.7 Z/D 5.67 8.53 12.51 2.40 3.57 6.12 A (%) 0.67 0.66 0.83 3.61 3.80 3.60 Cd
Imp/Eff
[image:3.612.315.567.325.512.2]0.85 0.89 0.78
Table 2: Geometries for Unequal Number of Holes
Variables Impingement Effusion
n ( m-2) 1076 4306 9688 26910
Array 5 × 5 10×10 15×15 25×25
D (mm) 2.88 3.27 2.23 1.30
X (mm) 30.48 15.24 10.10 6.10
Z (mm) L (mm) 8 6.3 8 6.3 8 6.3 8 6.3
L/D 2.21 1.94 2.85 4.89
X/D 10.58 4.7 4.5 4.7
Z/D 2.78 2.45 3.59 6.15
A (%) Hole surface area/m2 0.70 0.061 3.61 0.279 3.80 0.428 3.60 0.692
One of the reasons for undertaking the present work was that it was postulated that the larger number of effusion holes per impingement hole would potentially give an additional benefit to the impingement heat transfer. This was that the effusion hole inlet jet flow could act as a suction surface on the impingement jet wall flow. This could act to keep the impingement wall jet flow closer to the effusion wall and thus increase the heat transfer. However, the results show that the changes in the predicted wall heat transfer compared with equal number of impingement and effusion holes was small and probably due to the above Z/D effect combined with the larger internal effusion wall hole internal surface area.
COMPUTATIONALMETHODS
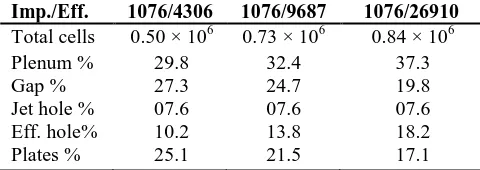
Table 4 together with the proportion of cells in each part of the geometry. The higher the G, the higher the total number of cells in the model. Also, with increased number of holes, n, the total number of grid cells was increased. Table 4 shows that the number ratio 1076/26910 had the highest number of cells.
[image:4.612.55.297.318.474.2]
The computations were carried out with an imposed hot side wall temperature, Tw, of 360 K, which was similar to that used in the experiments. The CHT/CFD computations were carried out using the wall function standard k - turbulence model, for which the first cell size near the target wall was kept at y+ ~ 35 [6] for all the G values. Table 3 shows that at the lowest G the Reynolds number Re in the impingement holes were laminar. The Re in the effusion holes were laminar for most G and for all three effusion walls. However, the sharp edged inlet to the holes would create flow separation and turbulence. This might mean that conventional fully developed pipe flow laminar to turbulent flow transition might not be appropriate. The flow was treated as turbulent in the CFD and there was no laminar flow sub model.
Table 3: Flow conditions that were modelled
G kg/sm2 bar
n ( m-2)
P/P Impingement Effusion
1076 4306 9688 26910
% Vj
m/s
Re
× 103
Vh
m/s
Re
(× 103)
0.94 10.3 109.9 21.53 21.7 4.83 3.29 1.92
0.77 6.9 89.7 17.56 17.7 3.94 2.69 1.57
0.63 4.6 73.3 14.35 14.5 3.22 2.19 1.28
0.50 2.9 58.2 11.39 11.5 2.55 1.75 1.02
0.30 1.05 34.9 6.84 6.9 1.53 1.05 0.61
[image:4.612.54.294.497.582.2]0.10 0.12 11.7 2.29 2.3 0.52 0.35 0.21
Table 4: Grid size for G of 0.94 kg/sm2bar, y+ of 35
Imp./Eff. 1076/4306 1076/9687 1076/26910
Total cells 0.50 × 10⁶ 0.73 × 10⁶ 0.84 × 10⁶ Plenum % 29.8 32.4 37.3
Gap % 27.3 24.7 19.8
Jet hole % 07.6 07.6 07.6 Eff. hole% 10.2 13.8 18.2 Plates % 25.1 21.5 17.1
EXPERIMENTAL TECHNIQUES
The experimental equipment has been used previously [14-16] and consisted of an air supply to a thermally insulated plenum chamber feed to the impingement holes. The 152.4mm square Nimonic-75 impingement hole test plate was bolted to the plenum chamber. There was an 8mm impingement gap formed using a 8mm thick Teflon spacer flange between the impingement wall and the effusion wall. The target effusion wall was also Nimonic-75, which is a common combustor metal wall material. Both walls were instrumented with six grounded junction
mineral insulated thermocouples, spaced at 25.4mm intervals, brazed to the Nimonic-75 effusion wall with the thermocouple junction flush with the impingement jet target surface. The transient response of these thermocouples was used to determine the locally surface averaged heat transfer coefficient using the lumped capacity method.
The thermocouples were located on the centreline between the impingement and effusion jets and thus were at the most remote location relative to the high local convective cooling of the effusion jets. Conduction heat transfer within the wall smoothed out the strong gradients in the surface convective heat transfer, as the Biot numbers Bi for all conditions were < 0.2. The thermocouples thus measured the surface averaged temperature for the effusion wall and were located at the lowest local convective heat transfer position and thus the result were expected to be slightly low as the thermocouples were place in the metal on the centreline between the effusion jets. The experimental surface average heat transfer coefficients, hx, are the average for all six effusion wall thermocouples.
The predicted results were averaged over the effusion X2 surface area cooled by each hole and the experimental results were only surface average by conduction in the metal wall. The thermocouple position in the lowest heat transfer region will slightly underestimate the true local surface averaged h due to the residual temperature gradients in the wall, as the Biot number was low but not 0. The maximum to minimum temperature difference as a proportion of the maximum temperature was predicted at about 15% for all geometries investigated.
The thermally insulated wall was electrically heated in the absence of any impingement coolant flow, to about 80oC and then the air plenum and test wall was hoisted off the heater and the impingement/effusion air flow established. The transient cooling of the target wall by the impingement flow enabled the surface averaged heat transfer coefficient to be determined from the rate of fall of the effusion wall mean temperature. In the CHT/CFD predictions the wall temperature on the heated side of the wall was held at a constant 80oC, as it would be on a steady state heat transfer test rig.
data for temperature difference was < 1% and so the total error for h was < 5% and for coolant mass flux G, the error was 2%.
RESULTS
Impingement/Effusion Overall Heat Transfer for Equal n
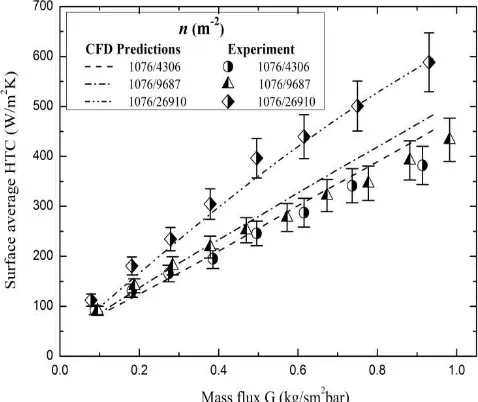
Validation of the present work was carried out from the measured surface averaged h of AlDabagh et al. [14] and Andrews et al. [2, 15, 17]. The heat transfer area per hole was taken as for impingement only heat transfer, X2, with no account taken of the extra area inside the hole or the reduction of the approach area by the hole removing flow area. The aim was to cool the flat surface of area X2 per impingement hole. If the cooling was enhanced by the addition of the effusion holes then the effect of the increased hole surface area was part of that enhancement. The predicted total surface h is compared with the measurements in Fig. 1. This shows that the predictions as a function of G for all three n are reasonably within the measured uncertainty for h of +/- 5% of the mean h. The agreement was not as good at low G. where the predictions were lower than the measurements, but only
Figure 1: Comparison of predicted and experimental
surface heat transfer coefficient, hx, on the effusion approach and hole surfaces for the range of G in Table 1. just outside the measurement uncertainty.
For the lowest G of 0.1 kg/sm2bar for n of 4306/4306 m-2 the predicted h was outside the experimental error bars. The predictions in Figs. 1 and 2 show that for the same value of h the coolant mass flow can be reduced by increasing the number of impingement and effusion holes. For example if the desired h was 400 W/m2K then for an increase in n from 4306 to 26910/m2 for the same X/D and Z would enable the coolant mass flow to be reduced from 0.73 to 0.6 kg/sm2bar or by 18%. If at the same time Z was reduced the cooling air savings would be greater. The problem at low G is connected with the low hole Re numbers listed in Table 3. However, with flow separation at the sharp edged hole inlet, the Re at the vena
contraction after the inlet would be 40% higher than that based on the mean hole area velocity. Transition to turbulent flow is also different with separated flow at the hole inlet. Thus, the present treatment of the low Re flow in the holes as turbulent flow is justified. Another factor is that the large surface roughness to hole diameter ratio for small drilled and spark eroded (n=26910/m2) holes is that at low Re the roughness is more important. This is shown in classic pipe flow friction pressure loss as a function of surface roughness, where the effect of hole Re on the hole friction factor is independent of Re at a lower critical Re for increasing pipe roughness. However, overall the disagreements between the experiments and predictions are relatively small, even at low G. The worst error at G = 0.1 kg/sm2bar was about -20% for the highest and lowest n, with -5% difference attributable to experimental errors. A further factor that influences the results is that Z/D is higher for high n than for low n, due to the use of a constant gap, Z, of 8mm. This would be expected to produce a lower h due to the higher Z/D [13]. The greater L/D ratio of the high n effusion and impingement holes, shown in Table 2, will also increase the total heat transfer through the greater surface area of the impingement and
[image:5.612.321.560.322.523.2] [image:5.612.49.294.329.517.2]Figure 3: Comparison of equal and unequal n predicted hx for the effusion surface for a range of G.
effusion walls. This will be the dominant effect in the predictions for the higher overall heat transfer for larger n in Fig. 1, where Z/D increases as n increases for the same Z.
Impingement/Effusion Overall Heat Transfer for Reduced Impingement n.
The predicted and measured total surface averaged hx are shown as a function of G in Fig. 2 for the 1076/m2 impingement holes with the number of effusion holes varied, as in Table 2. Good agreement with the measurements is shown for all the geometries, the best agreementwas for the highest effusion n. However, at low G for the highest n there was an under prediction of the measured data by about 10% for <0.2 kg/sm2bar. This could have been due to low Reynolds number hole flow effects, as shown in Table 3. For the other two n, about 10% higher predictions than the measured data were observed for G between 0.63-0.94 kg/sm2bar values, with good agreement at lower G. However, the main area of interest is for low G where in low NOx combustors impingement/effusion cooling would operate and in this region <0.63 kg/sm2bar the predictions and measurements are in very good agreement, apart from at the two lowest G for the highest effusion n.
The predictions for hx are compared in Fig. 3 with the predictions for equal numbers of impingement and effusion holes from Fig. 1. This shows that for 4306 and 9686/m2 effusion holes the reduced number of impingement holes were predicted to reduce the surface averaged hx by about 10%. However, for the largest number of effusion holes the reduced number of impingement holes produced an increased surface averaged hx of about 5% for all G. It is well known in impingement heat transfer that the surface average heat transfer increases with reduction in Z/D and the maximum hx occurs at about a Z/D of 1-2 [13].
The reduction in the number of impingement holes from 26910/m2 to 1076/m2 at constant impingement gap Z of 8mm reduced Z/D was from 6.16 to 2.78. This was the
main reason for the increased hx for the 1076/26910 impingement/effusion hole number combination compared with equal number of holes. For the 4306/m2 effusion wall design the Z/D change was small and was only 3.59 to 2.78 for 9688/m2 effusion holes. The reduction in Z/D, that a low number of impingement holes enables, is worth the design change for the highest number of effusion holes and there is also a reduced manufacturing cost of the impingement wall.
Figure 4: Surface distribution of TKE on the effusion
[image:6.612.320.563.171.288.2]approach walls for G of 0.5 kg/sm2bar at fixed X/D and Z/D
Figure 5: Contour of TKE (m2/s2) on the effusion approach surfaces for G of 0.5 kg/sm2bar
.
Impingement/Effusion Surface Distribution of
Turbulence Kinetic Energy for Equal and Unequal n.
Figures 4 and 5 shows the predicted effusion hole approach surface distribution of the turbulent kinetic energy, TKE, which controls the surface convective heat transfer. Comparison of the equal number of impingement and effusion holes in Fig. 4 with the reduced number of impingement holes in Fig. 5 shows for the highest number of effusion holes the TKE is low, due to the high Z/D for equal number of holes. Thus, as concluded above this is the main reason for the increase in surface averaged heat transfer. However, for the 9688/m2 and 4306/m2 number of holes the reduction in the heat transfer with the reduced number of holes for the same impingement Z/D is difficult to understand, but comparison of Figs. 4 and 5 shows that with unequal number of holes there is a reduction in the surface covered by high turbulence, whereas there is an increase for the 26901/m2 number of effusion holes.
[image:6.612.320.568.327.443.2]impingement holes was reduced to 1076/m2, as shown in Fig. 3, is considered to be due to the reduced surface coverage of high TKE shown in Fig. 5. This was due to the flow of impingement air into the larger number of effusion holes, which reduced the surface velocity and turbulence for flows to the second and subsequent holes. The larger number of impingement jet holes simply gives a better surface coverage of high impingement heat transfer and impingement flow along the backside of the effusion hole surface.
The increase in surface distribution of TKE with the largest number of effusion holes was due to the five effusion holes on the centerline between two impingement holes, compared with 3 and 2 for the lower number of effusion holes. As there is no impingement jet surface flow after the last effusion hole, there is no surface flow generated turbulence. For the largest number of effusion holes the last effusion hole leaves the shortest distance between two effusion holes and hence the shortest distance with low turbulence. This is part of the reason for the highest heat transfer for the largest effusion n in Fig. 2. The Z/D effect is the reason for the higher heat transfer with the reduced number of impingement holes, as shown in Fig. 3.
It is clear from these results that the anticipated enhancement in effusion surface heat transfer, due to a
boundary layer ‘suction’ effect, with larger number of
effusion holes than impingement holes does not occur. The slightly higher overall surface average heat transfer with the largest effusion n and the low impingement n was due to the reduction in impingement hole Z/D.
CONCLUSION
The predicted surface average heat transfer coefficient hx were shown to agree with the experimental measurements for impingement/effusion internal wall heat transfer, for both equal and unequal number of impingement and effusion jets. This shows that the present CHT/CFD procedures are adequate for the design of impingement/effusion cooling systems.
The n ratio of 1076/26910 with the largest number of effusion holes and with the smallest effusion pitch, X, was predicted to have the best cooling. This geometry was the only one with an enhanced (~10%) surface average h relative the design with equal numbers of holes. The other two geometries were predicted to have little benefit of reducing the number of impingement holes.
The postulation at the start of this research, that having more effusion holes than impingement holes would increase the effusion hole surface heat transfer
coefficient, due to the ‘suction’ effect of the effusion
holes, was shown not to be valid. The effect of the greater number of effusion holes than impingement holes was to reduce the impingement heat transfer. The effusion holes took coolant mass flow from the impingement surface flow along the effusion hole surface. This reduced the surface velocity after the first effusion hole and reduced the TKE on the surface. This
also reduced the internal recirculation in the impingement gap which reduced the heat transfer at the impingement wall.
The main reason for the enhanced heat transfer with the reduced number of impingement holes for the 1076/26910 combination was that the comparison was carried out at constant Z of 8mm and the Z/D ratio with 1076 impingement holes was 2.78 compared with 6.15 for 26910 impingement holes. As impingement heat transfer increases with reduction in Z/D to a maximum in the region of a Z/D of 2, this was the main cause of the enhanced heat transfer and not the relative number of impingement to effusion jets. For the other number of effusion holes the change in the Z/D with larger impingement holes for the smaller number was too small to have counteracted the negative effects on the effusion wall.
ACKNOWLEDGEMENTS
Abubakar M. El-jummah wishes to acknowledge the financial support from University of Maiduguri and the Government of Nigeria. We would like to thank Siemens Turbomachinery (Lincoln) for the manufacture of some of the experimental test walls.
REFERENCES
[1]Bayley F. J. and Turner A. B. 1970. The Transpiration-Cooled
Gas Turbine. ASME Paper 70-GT-56. Trans. ASME, J. Eng. for
Power, 351 - 358.
[2]Andrews G. E., Asere A. A., Hussain C. I. and Mkpadi M. C. 1985. “Transpiration and Impingement/Effusion Cooling of Gas Turbine Combustion Chambers”. ISABE and AIAA 7th
Propulsion Joint Specialist Conf., ISABE 85-7095, 794 - 803.
[3]El-jummah, A. M., Andrews, G. E. and Staggs, J. E. J. 2013.
Conjugate Heat Transfer CFD Predictions of Impingement Jet Array Flat Wall Cooling Aerodynamics with Single Sided Flow Exit. Proc. ASME Turbo Expo. GT2013-95343, 1 - 12.
[4] Rogers, N., Ren, Z., Buzzard, W., Sweeney, B., Tinker, N., Ligrani, P., Hollingsworth, K., Libertore, F., Patel, R. and Moon, H-K., 2016. “Effects of Double Wall Cooling Configurations and
Conditions on Performance of Full Coverage Effusion Cooling”.
Proc. ASME Turbo Expo 2016, Seoul. S. Korea. ASME Paper
GT2016-56515.
[5] Shi, B., Li, J., Li, M., Ren, J. and Jiang, H., 2016. “Cooling Effectiveness on a Flat Plate both Film Cooling and Impingement Cooling in Hot Gas Conditions”. Proc. ASME Turbo Expo 2016,
Seoul, S. Korea. ASME Paper GT2016-57224.
[6]El-jummah A. M., Andrews G. E. and Staggs J. E. J., 2016.
“Impingement/Effusion Cooling Wall Heat Transfer: Conjugate Heat Transfer CFD Predictions”. Proc. ASME Turbo Expo 2016,
Seoul, S. Korea. ASME Paper GT2016-56961, 1 - 14.
[7]Andrews G. E., Asere A. A., Gupta M. L. and Mpadi M. C. 1990. Effusion Cooling: The Influence of the Number of Holes.
IMechE J. Power and Energy: Part A, 204, 175 - 182.
ASME Turbo Expo 2015, GT2015 June 15-19, 2015, Montreal, Canada. ASME Paper ASME GT2015-42248.
[10] Ligrani, P.M., Goodro, M., Fox, M. and Moon, H-K., 2012.
“Full-Coverage Film Cooling Effectiveness and Heat Transfer
Coefficients For Dense and Sparse Hole Arrays at Different Blowing Ratios”. ASME Transactions, J. Turbomachinery,
134(6), pp.061039-1 to 061039-13.
[11] El-jummah A. M., Abdul Hussain R. A. A., Andrews G. E.
and Staggs J. E. J. 2014. Conjugate Heat Transfer CFD Predictions of Impingement Heat Transfer: Influence of the Number of Holes for a Constant Pitch to Diameter Ratio X/D.
Proc. ASME Turbo Expo.. ASME Paper GT2014-25268, 1 - 14.
[12] El-Jummah, A.M., Andrews, G.E. and Staggs, J.E.J., 2015.
“CHT/CFD Predictions of Impingement Cooling with Four Sided Flow Exit”. Proc. ASME Turbo Expo 2015, Montreal, Canada. ASME Paper GT2015-42256.
[13] El-Jummah, A.M., Abdul Hussain, R.A.A., Andrews, G.E.
and Staggs, J.E.J., (2016). "Impingement Heat Transfer: CHT CFD Predictions of the Influence of Reduced Crossflow using Large Gaps". Proceedings of the 12th International Conference on Heat Transfer, Fluid Mechanics and Thermodynamics , July 2016. Paper HEFAT2016-1570249450. Proceedings p. 1113-1124.
[14] Andrews G. E., Asere A. A., Hussain C. I., Mkpadi M. C. and Nazari A. 1988. “Impingement/Effusion Cooling: Overall Wall Heat Transfer”. Proc. ASME Int. Gas Turbine and
Aeroengine Congress. ASME Paper 88-GT-290, 1 - 9.
[15]Al Dabagh A. M., Andrews G. E., Abdul Husain R. A. A., Husain C. I., Nazari A. and Wu J. 1990. Impingement/ Effusion Cooling: The Influence of Number of Impingement Holes and Pressure Loss on the Heat Transfer Coefficient. Trans. ASME J.
Turbomachinery, 112, 467 - 476.
[16] Andrews G. E., Alikhanizadeh M., Asere A. A., Hussain C. I., Koshkbar Azari M. S. and Mpadi M. C. 1986. "Small Diameter Film Cooling Holes: Wall Convective Heat Transfer". Trans.
ASME J. Turbomachinery, 108, 283 - 289.