This is a repository copy of Data collection, handling and fitting strategies to optimize
accuracy and precision of oxygen uptake kinetics estimation from breath-by-breath
measurements..
White Rose Research Online URL for this paper:
http://eprints.whiterose.ac.uk/116355/
Version: Accepted Version
Article:
Benson, AP orcid.org/0000-0003-4679-9842, Bowen, TS, Ferguson, C
orcid.org/0000-0001-5235-1505 et al. (2 more authors) (2017) Data collection, handling
and fitting strategies to optimize accuracy and precision of oxygen uptake kinetics
estimation from breath-by-breath measurements. Journal of Applied Physiology, 123 (1).
pp. 227-242. ISSN 8750-7587
https://doi.org/10.1152/japplphysiol.00988.2016
© 2017 by the American Physiological Society. This is an author produced version of a
paper published in Journal of Applied Physiology. Uploaded in accordance with the
publisher's self-archiving policy.
[email protected] https://eprints.whiterose.ac.uk/ Reuse
Items deposited in White Rose Research Online are protected by copyright, with all rights reserved unless indicated otherwise. They may be downloaded and/or printed for private study, or other acts as permitted by national copyright laws. The publisher or other rights holders may allow further reproduction and re-use of the full text version. This is indicated by the licence information on the White Rose Research Online record for the item.
Takedown
If you consider content in White Rose Research Online to be in breach of UK law, please notify us by
Data collection, handling and fitting strategies to optimize accuracy and precision of
oxygen uptake kinetics estimation from breath-by-breath measurements
Alan P. Benson1,2, T. Scott Bowen3, Carrie Ferguson1,2, Scott R. Murgatroyd4 and
Harry B. Rossiter5,1
1
School of Biomedical Sciences and 2Multidisciplinary Cardiovascular Research Centre,
University of Leeds, Leeds, United Kingdom; 3Heart Centre, University of Leipzig, Leipzig,
Germany; 4Neurosciences Intensive Care Unit, Wessex Neurological Centre, University
Hospital Southampton, Southampton, United Kingdom; 5Rehabilitation Clinical Trials
Center, Division of Respiratory and Critical Care Physiology and Medicine, Los Angeles
Biomedical Research Institute at Harbor-UCLA Medical Center, Torrance, California, USA.
RUNNING HEAD
Strategies to optimize VO2 kinetics estimation
ADDRESS FOR CORRESPONDENCE
Alan P. Benson
School of Biomedical Sciences
University of Leeds
Leeds
LS2 9JT
United Kingdom
ABSTRACT
Phase 2 pulmonary oxygen uptake kinetics ( 2 VO2P) reflect muscle oxygen consumption
dynamics and are sensitive to changes in state of training or health. This study identified an
unbiased method for data collection, handling and fitting to optimize VO2P kinetics
estimation. A validated computational model of VO2P kinetics and a Monte Carlo approach
simulated 2 x 10⁵ moderate intensity transitions using a distribution of metabolic and
circulatory parameters spanning normal health. Effects of averaging (interpolation, binning,
stacking or separate fitting of up to 10 transitions) and fitting procedures (bi-exponential
fitting, or 2 isolation by time removal, statistical or derivative methods followed by
mono-exponential fitting) on accuracy and precision of VO2P kinetics estimation were assessed. The
optimal strategy to maximize accuracy and precision of VO2P estimation was 1-s
interpolation of 4 bouts, ensemble averaged, with the first 20 s of exercise data removed.
Contradictory to previous advice, we found optimal fitting procedures removed no more than
20 s of 1 data. Averaging method was less critical: interpolation, binning and stacking gave
similar results, each with greater accuracy compared to analyzing repeated bouts separately.
The optimal procedure resulted in 2 VO2P estimates for transitions from an unloaded or
loaded baseline that averaged 1.97 ± 2.08 and 1.04 ± 2.30 s from true, but were within 2 s of
true in only 47-62% of simulations. Optimized 95% confidence intervals for VO2P ranged
from 4.08-4.51 s, suggesting a minimally important difference of ~5 s to determine
significant changes in VO2P during interventional and comparative studies.
NEW & NOTEWORTHY
We identified an unbiased method to maximize accuracy and precision of oxygen uptake
kinetics ( VO2P) estimation. The optimum number of bouts to average was four;
previous advice, we found that optimal fitting procedures removed no more than 20 s of
phase 1 data. Our data suggest a minimally important difference of ~5 s to determine
significant changes in VO2P during interventional and comparative studies.
KEYWORDS
INTRODUCTION
At the onset of constant power exercise below the lactate threshold (LT) in humans,
mitochondrial oxidative phosphorylation and, subsequently, muscle oxygen uptake (VO2m) in
activated muscle increase in a manner that is an approximate first order exponential in vivo
(2, 22, 48; cf. 30). The kinetics of phase ( ) 2 of the pulmonary VO2 (VO2P), characterized
by the response time constant ( ) from repeated breath-by-breath gas exchange
measurements, are commonly used to infer VO2m kinetics and provide a non-invasive tool to
investigate the control of exercise energetics (27, 41, 46). Fast 2 VO2P kinetics reflect
effective cardiopulmonary and neuromuscular integration, and are associated with high
endurance exercise performance (29, 38, 41), whereas 2 VO2P kinetics are slowed in the
elderly (1) and with chronic disease (12, 23, 40, 46, 51). In addition, 2 VO2P kinetics are
sensitive to interventions that influence blood flow distribution and muscle O2 delivery,
muscle metabolism, or muscle recruitment (41, 46), making them a useful prognosticator (49)
and method for evaluation of therapeutic benefit (44). Furthermore, the kinetics of 1 of the
VO2P response ( 1 duration and amplitude) are clinically discriminatory (50) and sensitive to
age (37). Thus, the strong link between VO2P kinetics and state of health provides the basis
for an inherently attractive, non-invasive and effort-independent method to characterize the
efficacy of the integrated physiologic systems response to exercise.
While there are general guidelines for characterizing VO2P kinetics in terms of data
collection, processing and fitting procedures (56), a range of proposals exist for each of these
steps (e.g. 10, 14, 19, 20, 26, 33, 39, 58). However, a systematic quantification of the effects
amplitude and 2 VO2P characterization, as well as a standardization of these procedures, is
lacking.
This study therefore aimed to identify an unbiased (i.e. free from human error) method for
VO2P data collection, handling and fitting that allows the most accurate and precise
estimation of VO2P kinetics. We identified this optimal criterion by systematically
determining the influences of a range of common and uncommon collection, averaging and
fitting strategies on both the precision and accuracy of 1 duration and amplitude and 2
VO2P estimation, using a validated cardiopulmonary simulation of exercise gas exchange (8)
and a Monte Carlo approach.
THEORETICAL CONSIDERATIONS
The process linking VO2P data collection in the laboratory or clinic, to kinetics
characterization, is typically undertaken in three distinct steps: (i) data collection, (ii) data
processing, and (iii) data fitting.
Step 1 – data collection: Strategies employed in this step include identification of the optimal
algorithms for calculating breath-by-breath gas exchange to improve signal-to-noise for
kinetic fitting (6, 13, 14, 55). Strategies to improve primary VO2P data also include the
repetition of identical bouts of exercise with the intention of combining and averaging those
data in the data processing step (Fig. 1B) (10, 26, 33, 57). The breath-by-breath fluctuations
(also referred to as “noise”) inherent in any VO2P measurement are uncorrelated (33) and
have a Gaussian distribution in adults (although not in children; 42) with the standard
independent of metabolic rate (33). What is less clear, however, is how different
signal-to-noise ratios (or, analogously, the number of combined exercise bouts) affect VO2P kinetics
estimation and, therefore, whether there is an optimal number of exercise bouts required to
estimate VO2P kinetics to a given level of confidence.
Step 2 – data processing: After the removal of outlying breaths generated by swallows or
coughs or other ‘mistriggers’ of the breath identification algorithms, and unrelated to tidal
breathing [typically those breaths more than 3 or 4 SDs from the local mean (33, 57)], the
second step involves averaging of the data collected from multiple exercise bouts to obtain a
single (processed) VO2P signal with a high signal-to-noise ratio, prior to kinetic
characterization. Several averaging techniques are employed (Fig. 1C-E), the most
widely-used involving some form of interpolation and/or averaging. Linear interpolation of data prior
to averaging (commonly to 1 s intervals) is necessary to normalize gas exchange sampling
frequency, from the non-uniform breath-by-breath sampling, and therefore ensure equal
weighting of data among repeated trials (Fig. 1C) (57). Averaging may be in the form of
post-interpolation ensemble averaging (56), or by arranging un-interpolated data from all bouts in
time (10) before averaging the combined breaths into bins whose size depends on the number
of averaged bouts (38) or time (9, 26) (Fig. 1D). This “binning” approach to averaging, while
improving the signal-to-noise ratio, may help to maintain the density of the data close to that
at which it was collected (i.e. breathing frequency), and improve the validity of the estimated
confidence intervals (21, 38). Despite the general popularity and acceptance of these
approaches, several other data processing methods warrant investigation. Recent simulation
studies have suggested that simple superimposition of all data from all bouts before fitting
can give accurate 2 VO2P estimates, with the added simplicity of reducing the requirement
maybe one that is statistically more robust (16) yet is not typically used for estimating VO2P
kinetics, involves fitting the individual exercise bouts then averaging the resulting fit
parameters (32). Kier et al. (26) showed that various stacking, interpolation, and bin or
ensemble averaging procedures had essentially no effect on the precision of subsequent
VO2P estimation. It remains unclear, though, how averaging strategies affect both the
precision and accuracy of VO2P kinetics estimation in the context of different numbers of
averaged bouts and different approaches to fitting the data.
Step 3 – data fitting: The third step involves the fitting of the processed VO2P data in order to
obtain an estimate of the kinetics of VO2P. The VO2P response to a step change in work rate
in the moderate intensity domain consists of an initial “cardiodynamic” phase (largely a result
of increased blood flow through the pulmonary circulation; 56) followed by a “fundamental”
phase, the kinetics of which closely represent those of VO2m in young healthy adults (Fig.
1A) (22, 48). This entire response has been described mathematically using a piecewise
bi-exponential equation of the form
VO2P VO2Pbase ,
, ,
, ,
(1)
where t is time, VO2Pbase is baseline VO2P, A1 and A2 are the amplitudes of the first and
second phases of the response, 1 and 2 are time constants associated with each phase of the
response, TD is a time delay and H(t) is the Heaviside step function (cf. 36). Generally, the
parameter of most interest is 2, i.e. 2 VO2P. However, 1 is a complex physiological
construct, influenced by several processes including changes in mixed venous gas tensions,
pulmonary perfusion and end-expiratory lung volume, which sum to generate a response that
difficulties when using Equation (1) to fit VO2P data: Phase 1 typically contains only a few
breaths (typically 5 or 6 in our simulations; see Fig. 1B), and fitting so few data points with
the first exponential term in Equation (1) drastically reduces the confidence of the parameter
estimations in that first exponential term. The influence of this potentially unconfident 1 fit
continues into 2, affecting 2 ( 2 VO2P) estimation, particularly if the fit to the 1 data does
not reach a steady-state before 2 begins (i.e. at t = TD). Furthermore, most nonlinear least
squares algorithms used by data fitting software (the Levenberg-Marquardt algorithm being
the standard; 43) require the calculation of derivatives and cannot handle the Heaviside step
function in Equation (1); the parameters A1 and 1 are shared over, and influenced by the data
in, the two different sub-domains (t < TD or 1, and t ≥ TD or 2), and the extents of the
sub-domains themselves are determined by the parameter TD. As such, fitting Equation (1) is
difficult without custom implementation of alternative, potentially less robust, nonlinear
fitting algorithms such as direct search methods (35). As the parameter of most interest is the
time constant of 2, an alternative (and the most commonly used) approach is to isolate the
2 data then fit these data with a mono-exponential equation of the form
VO P VO P base . (2)
Such a mono-exponential equation accurately describes the 2 VO2P response to moderate
intensity step exercise (4, 5) and can be handled by most nonlinear least squares algorithms.
If Equation (2) is used to fit the VO2P data and obtain an estimate of 2 VO2P, it is necessary
to omit the 1 data from the fit. The most widely-used methods for removing 1 data are
empirically-derived time-removal methods, where “at least” the first 20 s of data from the
exercise transient are removed prior to fitting (7, 39, 54, 57). The rationale behind this
strategy is that, because 1 is expected to last less than 20 s and the 2 VO2P response is
expected to be exponential, starting the fit from any given point past the 1-2 transition will
the fit from any point before the 1-2 transition will result in a larger (incorrect) time
constant for 2 (39, 54, 57). However, the 2 VO2P response is not truly exponential, but
rather is a non-linear distortion of a mono-exponential VO2m response (3, 5, 8, 25; cf. 18).
Thus, contrary to VO2m, the VO2P is not a “true” constant throughout the transient, and
fitting an exponential equation from different points in such a non-exponential 2 will yield
varying values for VO2P; progressively larger values as the fit is started from later in 2 (cf.
8). Such behavior is suggested in the empirical results of Murias et al. (39) where VO2P
becomes larger as the imposed exponential fit is started from later in the exercise transient, at
least in older adults. Although VO2P is influenced by a complex interaction of circulatory
and gas exchange responses to exercise, and 2 VO2P is not quite exponential, a
mono-exponential fit of moderate intensity VO2P kinetics remains a useful, concise and
effort-independent method to characterize the integrated dynamic responsiveness of
cardiopulmonary and neuromuscular health. Nevertheless, it seems crucial that all data
contained in the 2 response, but none of the 1 data, are fitted in order to obtain the most
accurate characterization of VO2P kinetics (57). As such, accurate identification of the 1-2
transition is paramount.
When using the mono-exponential Equation (2) to fit VO2P data, human error in selecting the
1-2 transition can lead to an unintended bias in VO2P estimation, and so an ideal, unbiased
method for isolating 2 data for such a fit would be based on either (i) identification of some
consistent time period (rather than leaving the choice to the individual researcher) at the start
of exercise during which data should be removed, or (ii) some other information in the data
Rather than employing empirical time-removal methods, the abrupt change in VO2P at the
1-2 transition may be identifiable from the VO2P data using either the peak time-derivative
of the VO2P data (34) or statistical measures reflecting the best confidence in the fit
parameters [e.g. the smallest confidence interval of the obtained time constant; (48)].
Although theoretically sound, in that both methods can identify abrupt changes in a
continuous signal, their application to experimental VO2P data may be hindered by the low
sampling rate (relative to the duration of 1) and noise inherent in those data. Whether the
use of derivatives or statistical methods to identify the 1-2 transition results in improved
VO2P estimates over the empirical time-removal methods currently favored remains to be
investigated.
Several studies have examined the effects of the different strategies employed in the three
steps described above on the confidence of VO2P kinetic parameter estimates using
experimental data [e.g. 1-2 transition and 2 VO2P; (10, 26, 39, 54)]. However, a limitation
of such studies is that the true underlying VO2P kinetic parameters are unknown: such
experimental methods can therefore give an indication of the precision of VO2P kinetics
estimation but not of its accuracy. Computational approaches using Monte Carlo methods
(17) can overcome some of these limitations. For this, a simulation is first used to produce a
clean, continuous VO2P trace with known kinetic parameters. This trace is then sampled
using simulations of breathing frequency and Gaussian noise is added (using known
characteristics) to produce a dataset with similar sampling, noise and kinetic characteristics as
experimentally-obtained VO2P data, but where the underlying VO2P kinetic parameters are
known (33). In addition, the same clean trace can be randomly resampled and new noise
added to produce further noisy datasets (but all with the same underlying kinetic parameters),
single subject. Thus, these Monte Carlo methods allow both the precision and accuracy of
VO2P fitting methods to be systematically assessed.
Computational approaches have been previously applied using a simple delayed
mono-exponential (19, 20) or a bi-mono-exponential (10, 33) VO2P response generated in silico. However,
as the underlying VO2P kinetics do not follow a simple mono- or bi-exponential time course
(3, 5, 8), it is necessary to use a validated simulation of VO2P kinetics that takes into account
how circulatory dynamics modulate the mono-exponential VO2m response to produce the 1
and 2 VO2P responses (8). Such computationally-produced datasets can therefore contain
the influence of normal variation in the steady states and kinetics of, for example, cardiac
output, muscle blood flow and VO2m, to derive a distribution of VO2P characteristics
(including 1 duration and amplitude, and 2 VO2P), analogous to collecting experimental
METHODS
We used a validated simulation of VO2 and circulatory dynamic interactions during moderate
intensity cycling exercise in humans (8) that accounts for the vascular capacitances and
circulatory dynamics that cause a mono-exponential VO2m response to manifest at the lungs
as a three-phase VO2P response, with a cardiodynamic 1, a near-exponential fundamental
2, and a steady-state 3. The simulation VO2P outputs initially have no noise, so the
baseline VO2P steady-state, 1 duration and amplitude, 2 VO2P, and 3 VO2P steady-state
for each output are precisely known. This allows quantification of both the accuracy and the
precision of subsequent fits to the data.
Data production: The minimum required number of Monte Carlo iterations, n, was estimated
from the central limit theorem (17) using , where is the z score
associated with significance level , is the estimated SD of the simulation output, and is
the acceptable margin of error for the simulation output (equal to half the required confidence
interval). We set at 0.05 to give , it was assumed that the SD of 2 VO2P (our
parameter of interest) produced by stochastic simulations would be 4.3 s [based on the
experimental data used to parameterize the simulations (8, 22)], and the acceptable margin of
error was set at 0.1 s (the same as the simulation time resolution). This predicted a minimum
iteration number of = 7104; we therefore performed 104 iterations during the Monte Carlo
simulations.
We examined two protocols for a step increase in work rate (WR), both constrained to be
within the moderate intensity exercise domain: the first from unloaded pedaling (UP-WR)
(time resolution = 0.1 s) VO2P simulations, each with different kinetics, were produced (see
Fig. 1A for an example). The start of the step increase in WR was set to t = 0 s. Simulation
input parameters were varied stochastically (43) using distributions taken from the data of
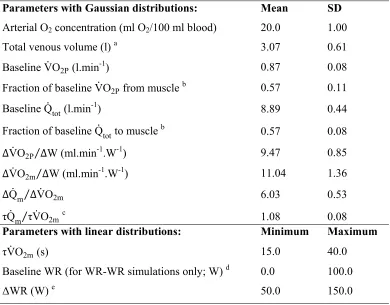
Grassi et al. (22) and Benson et al. (8) (Table 1). This provided simulations with normal
physiologic variation in, for example, baseline VO2P, VO2P gain ( VO2P W), the relative
increase in cardiac output ( Qm VO2m), and the kinetics of cardiac output and VO2m
( Qm VO2m). Parameter sets that resulted in venous O2 concentration dropping to zero at
any point during the simulated exercise transient were discarded, and a new parameter set
was generated.
Each of these 2 × 10⁴ clean traces (one set of UP-WR, and one set of WR-WR simulations)
was then sampled at a variable breathing frequency. The sampling interval was based on the
relationship between breathing frequency (bf) and VO2P in data collected during moderate
intensity exercise in our laboratory, and was given by bf VO2P . Gaussian
noise with an SD of bf was subsequently added to this interval (11, 28), with the
noise constrained to be no greater than 2 SDs to avoid unphysiologically-large intervals
between sampled “breaths”.
We then added Gaussian VO2P noise to each “breath”: the SD of this noise distribution was
randomly sampled for each clean trace from a Gaussian distribution with a mean of 67.96
ml.min-1 and an SD of 25.54 ml.min-1 [calculated from the individual values reported in
Lamarra et al. (33) and Rossiter et al. (47); n = 22], with the obtained value constrained to be
These procedures produced, from the clean simulation output, a trace with the sampling,
noise and kinetic characteristics observed in experimentally-collected data (see Fig. 1B for
examples). For all 2 x 10⁴ clean simulations, this sampling and noise procedure was
performed 10 times to simulate 10 bouts of exercise repeated by a single subject (see Fig. 1A
-B for examples). At the end of this Monte Carlo procedure, we therefore had 104 noisy
UP-WR datasets, i.e. 104 “subjects”, each with different physiological characteristics, who
performed moderate intensity step exercise from unloaded pedaling: each dataset contained
10 noisy traces from separate “exercise bouts”, i.e. each subject performed the same WR
protocol 10 times. A further 104 noisy WR-WR datasets, with each dataset again containing
10 traces from separate exercise bouts, were produced. Thus, a total of 2 x 10⁵ simulated
moderate-intensity “exercise bouts” in 2 x 10⁴ “subjects” were produced, which sampled the
normal variation of key parameters observed in healthy young humans. Note that, despite the
sampling and noise procedure used to produce the data, the true underlying kinetic
characteristics of any given noisy trace were known from the kinetics of the original clean
simulation from which it was produced.
Data processing: Outlying breaths were first removed by fitting Equation (2) to the noisy
traces and removing breaths that lay further than 3 SDs away from the local mean (i.e.
outside the 99.7% prediction bands of the fit) (33). For each dataset, we used the following
data processing techniques, covering a range of commonly-used or potentially-useful
methods, to process up to 10 bouts of noisy data (see Fig. 1 for examples): (i) Interpolation of
each bout to 1-s intervals before ensemble averaging across bouts (“interpolated”); (ii) Time
alignment of data from the bouts to be averaged, before bin averaging into bins whose size
depends on the number of bouts being averaged (“binned”); (iii) Superimposition, or
(“stacked”); (iv) Fitting of individual bouts (see below) followed by averaging of fit
parameters across bouts (“separate”).
Data fitting: For each processed VO2P trace, we fit the bi-exponential Equation (1) to the
entire 1 and 2 data, and used the following strategies for identification of the 1-2
transition and subsequently fit the mono-exponential Equation (2) to the isolated 2 data: (i)
Empirical time-removal methods, where 10, 15, 20, 25 or 30 s of data were removed from the
beginning of each processed VO2P trace. (ii) Use of VO2P time derivatives on both
unsmoothed and smoothed (with a moving 5-breath average) processed data, where the
highest derivative of VO2P with respect to time during the first 60 s of exercise was taken as
the 1-2 transition. (iii) Statistical methods to identify the 1-2 transition, where a datum was
incrementally removed from the beginning of each dataset (until 60 s into exercise) and the
remaining data were fit using the mono-exponential Equation (2); the reduced chi-squared
( red), adjusted coefficient of determination ( ), confidence interval for the time constant
(CI ) and the corrected Akaike information criterion (AICc) were then calculated for each fit
(42, 46); the first datum in the fit that returned the minimum statistical value (or maximum
for ) was taken as the identified 1–2 transition for that statistical method; See Rossiter et
al. (48) for an example using CI to identify the 1–2 transition. For each processed trace we
therefore obtained 12 fits to the data: one using the bi-exponential fit to the entire 1 and 2
data, and 11 using a mono-exponential fit to isolated 2 data (five using empirical time
removal methods, two using VO2P time derivatives, and four using statistical measures). As a
control condition, for each processed trace we also fit the true isolated noisy 2 data with
Equation (2), i.e. the data were fit beginning at the true first “breath” in 2, known from the
clean simulation. Each of these 13 methods provided an estimate of the 1–2 transition [i.e.
when using the mono-exponential fits] and an estimate of 2 VO2P [i.e. 2 from fits using
Equation (1), or from fits using Equation (2)]. The 1 amplitude (as a percentage of the
steady-state response) was estimated from the value of the fit at the identified 1–2 transition.
Each of the 1-2 transition, 1 amplitude and 2 VO2P estimates were then compared to the
known true underlying values obtained from the clean simulated VO2P trace. These true
values represent the most accurate estimates possible of 1 and 2 VO2P kinetics.
Numerical methods and statistical analyses: Details of the model used to produce the clean
VO2P data, along with numerical methods, are given in Benson et al. (8). Because of its
unique piecewise nature, Equation (1) was fit using a custom direct search method (35),
although this precluded calculation of parameter confidence intervals. Equation (2) was fit
using the Levenberg-Marquardt algorithm (43). Values are presented as mean ± SD unless
otherwise stated. Significant differences between data were tested for using two-sample t
-tests, or one-way repeated measures analysis of variance (ANOVA) with Tukey’s post hoc
RESULTS
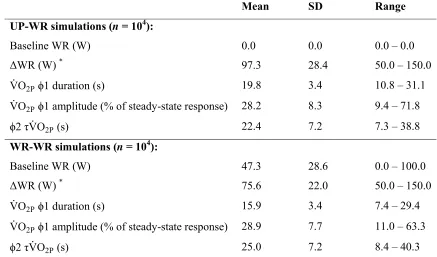
Simulation outputs: Simulation input WR and output VO2P characteristics are summarized in
Table 2. Time of the 1-2 transition was significantly different between UP-WR and
WR-WR simulations (19.8 ± 3.4 s vs. 15.9 ± 3.4 s, respectively; P < 0.05, t-test), as was 1
amplitude (reported as percentage of the steady-state response: 28.2 ± 8.3 % vs. 28.9 ± 7.7 %,
respectively; P < 0.05, t-test) and 2 VO2P (22.4 ± 7.2 s vs. 25.0 ± 7.2 s, respectively; P <
0.05, t-test). These different VO2P characteristics from UP-WR and WR-WR protocols can be
explained by the increased baseline cardiac output associated with starting an exercise
transition from a raised WR: muscle-to-lung transit time is shortened, reducing 1 duration
(3), and the altered blood flow during the exercise transient modifies the association between
muscle and pulmonary VO2 kinetics (8). The Monte Carlo simulation output data (104 clean
UP-WR traces and 104 clean WR-WR traces, along with the corresponding 2 x 10⁵ noisy
traces, and details of the input and output characteristics for each simulation) are available
from the corresponding author upon request.
The results below present in detail the findings for UP-WR simulations. The key differences
between UP-WR and WR-WR simulations are then presented. For the sake of brevity, we
present only data pertinent to our significant findings.
Number of averaged exercise bouts: Figure 2 shows the effects of averaging exercise bouts
on the precision and accuracy of 2 VO2P estimation (generally the parameter of most
interest) during UP-WR simulations. For this example, data from different bouts were
interpolated to 1-s intervals then ensemble averaged (see “Averaging methods” below), and
similar results were found for the other averaging and fitting methods. The mean and SD of
the estimated 2 VO2P are shown in Fig. 2A, and example distributions of the estimated 2
VO2P for 1, 4 and 10 exercise bouts are shown in Fig. 2B. The 2 VO2P estimates obtained
by averaging 1, 2 or 3 bouts were significantly greater than using 10 bouts (P < 0.05,
ANOVA; there was no difference when averaging 4-9 bouts; Fig. 2A). This indicates that
precision and accuracy of 2 VO2P estimation is not statistically improved by averaging data
from more than four bouts of exercise.
Figs. 2A and 2B demonstrate that VO2P tends to be overestimated on average by ~2 s,
irrespective of the number of bouts averaged: mean difference between estimated and true
VO2P was 1.92 ± 4.24 s with 1 bout, 1.68 ± 2.06 s with 4 bouts and 1.62 ± 1.37 s with 10
bouts. Figure 2C shows the percentage of estimated 2 VO2P values that lay within ± 2 s of
true. Using data from a single exercise bout, the estimated 2 VO2P was within 2 s of the
true value in only 41.3% of cases. When 4 bouts were averaged, the percentage of estimated
values within 2 s of the true value increased to 53.0%, even when the first breath in 2 is
known precisely (see also “Data fitting and kinetic characterization” below). The asymptote
of this relationship is 62.0% (Fig. 2C), indicating that the maximum probability of returning a
2 VO2P estimate within 2 s of true is 62%, even when the first breath in 2 is known and no
matter how many bouts are averaged.
Averaging methods: Figure 3A shows the effects on 2 VO2P estimation of the different
averaging methods during UP-WR simulations. For the example shown, data from four
exercise bouts were averaged and fitting was from the known first breath in 2 (i.e. control
fits). Qualitatively similar results were found for other numbers of averaged bouts and for the
estimates (P < 0.05, ANOVA), although the mean 2 VO2P values obtained using the
interpolated, binned and stacked averaging methods were quantitatively very similar, being
within 0.1 s of each other (i.e. within the acceptable margin of error set for our Monte Carlo
simulations). Mean 2 VO2P estimation with the interpolation method was 1.68 ± 2.06 s
from true (53.0% of values within ± 2 s of true), compared to 1.76 ± 2.17 s (50.7%) for
binned, 1.72 ± 2.13 s (51.4%) for stacked and 2.04 ± 2.34 s (46.9%) for separate. The
distribution of the confidence intervals of the estimated 2 VO2P are shown in Fig. 3B. Each
averaging method returned a significantly different confidence interval distribution (P < 0.05,
ANOVA), although the confidence interval distributions for the binned and stacked averaging
methods were quantitatively similar (the difference between the means of these two
distributions was 0.14 s).
Data fitting and kinetic characterization: Figures 4 to 6 compare the different methods for
estimating the 1-2 transition (Fig. 4), and the subsequent estimation of 1 amplitude (Fig. 5)
and 2 VO2P (Fig. 6), during UP-WR simulations. In Figs. 5 and 6, the distributions of 1
amplitude and 2 VO2P estimates obtained from control fits (i.e. fits from the known first 2
breath) are shown as dashed curves. The examples shown use data from four bouts averaged
using the interpolation method, although qualitatively similar results were found for other
numbers of averaged bouts and for the other averaging methods. Only removal of the first 20
s of data (Panel B in Figs. 4-6) resulted in the accurate identification of the first breath in 2,
and 1 amplitude and 2 VO2P values that were not significantly different from the control
fits; all other methods were significantly different from true (P < 0.05, ANOVA). Using this
empirical 20 s removal method, the identified 1-2 transition was within ±2 breaths of true in
99.3% of cases, estimated 1 amplitude was within ±5% of true in 32.6% of cases (vs. 34.2%
53.0% with control fits). Although the bi-exponential fitting method (Panel A in Figs. 4-6)
returned the second best estimates of the 1-2 transition (93.8% of estimates within ±2
breaths of true), the over-parameterization of the model resulted in less accurate and precise
2 VO2P estimates (only 32.0% of estimates within ±2 s of true) than both the empirical 15 s
and 25 s removal methods (37.9% and 37.6%, respectively) (Panel B in Figs. 4-6).
Interestingly, removal of 15 s of data (i.e. including some 1 data in the fit) gave more
accurate and precise 1 amplitude and 2 VO2P estimates than removal of 25 s of data (i.e.
excluding the initial portion of 2 data). Basing 1-2 identification on time-derivative or
statistical methods resulted in skewed distributions (Fig. 4C,D), and 1-2 transition, 1
amplitude and 2 VO2P values that were furthest from true (Figs. 5C,D & 6C,D).
Optimal protocol: Having identified that removal of the first 20 s of data, followed by a
mono-exponential fit to the isolated 2 data, was the optimal fitting method for UP-WR
transitions, we repeated the previous analyses that were performed on the control, i.e. known
2, data (as shown in Figs. 2 and 3) using this empirical 20 s removal fitting method (Fig. 7).
Qualitatively, the results were identical, in that four averaged bouts provided no more
accuracy and precision than 10 averaged bouts, and the interpolated averaging method gave
the most accurate and precise 1-2 transition, 1 amplitude and 2 VO2P estimates, that
were not significantly different to the control fits. Quantitatively, the mean estimate of the
1-2 transition was 0.06 ± 0.85 breaths from true, with 99.3% of values within ±2 breaths of
true; the mean 1 amplitude estimate was 6.63 ± 10.61 % from true (vs. 6.65 ± 4.46 % from
true with control data), with 32.6% of values within ±5% of true (vs. 34.2% with control fits);
and the mean 2 VO2P estimate was 1.97 ± 2.08 s from true (vs. 1.68 ± 2.06 s from true with
control data), with 46.5% of estimates within ±2 s of true (vs. 53.0% with control fits). Again,
accurate) 2 VO2P estimates to the interpolated method: 2.00 ± 2.19 s and 1.98 ± 2.16 s
from true, respectively. Using the optimal methods, the asymptote of the exponential fit to the
proportion of 2 VO2P estimates within ± 2 s across all numbers of averaged bouts (Fig. 7C)
was 51.3%.
WR-WR simulations: The analyses performed for the UP-WR simulations (Figs. 2-7) were
repeated for the WR-WR simulations, where “exercise” was initiated from a raised baseline
WR between 0 and 100 W. These analyses are summarized in Fig. 8. As with UP-WR
simulations, averaging of four bouts (Fig. 8A-C), using interpolated, binned or stacked data,
optimized 2 VO2P estimation while minimizing the number of required bouts (Fig. 8D-E).
However, for WR-WR data, removal of the first 15 s or 20 s of data gave statistically similar
results to control fits (where the first breath in 2 is known), although quantitatively the
removal of 15 s of data gave more precise and accurate estimates of VO2P kinetics than
removing 20 s of data: 97.2% (with 15 s removal) vs. 93.1% (with 20 s removal) of the 1-2
transition estimates within ±2 breaths of true; 41.5% vs. 16.9% of 1 amplitude values within
±5% of true; and 61.9% vs. 57.6% of 2 VO2P values within ±2 s of true (Fig. 8F). Phase 2
VO2P estimation was more accurate for WR-WR data than for UP-WR data: using four
interpolated and ensemble averaged bouts with 2 isolated by removal of the first 15 s of
data, the mean difference between estimated and known VO2P was 1.04 ± 2.30 s (vs. 1.97 ±
2.08 s with the optimal UP-WR analysis; P < 0.05, t-test) and the percentage of values lying
within ± 2 s of the true value was 61.9% (vs. 46.5% with UP-WR data). The asymptote of the
exponential fit to these data (Fig. 8C) suggested that a maximum of 75.9% of 2 VO2P
Minimally important difference: The optimal collection, handling and fitting procedures for
UP-WR and WR-WR simulations were used to determine the minimally important difference
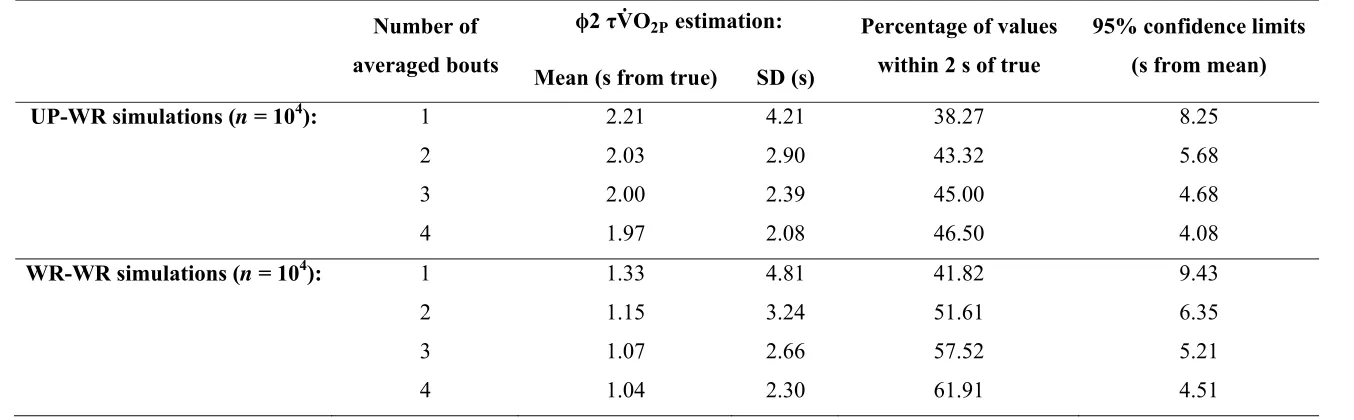
for significant changes in VO2P during moderate intensity exercise. Table 3 shows that the
95% confidence limits of VO2P estimation narrows from 8.25 s to 4.08 s for UP-WR, and
from 9.43 s to 4.51 s for WR-WR, as the number of bouts averaged is increased from 1 to 4.
These data propose a minimal important difference of ~5 s to detect differences in VO2P
among groups or within individuals for comparative or interventional studies.
Robustness of Monte Carlo simulations: To confirm the robustness of the Monte Carlo
simulations, the entire data production procedure was repeated (i.e. a second set of 104
UP-WR and 104 WR-WR clean simulations was produced, and noise was added to each trace 10
times, to give 2 x 10⁵ noisy traces) and these data were analyzed as described above. There
were no differences in the key findings with this second set of simulations (data not shown).
As with the original Monte Carlo data, the output data from this second set of Monte Carlo
simulations (2 x 10⁴ clean and 2 x 10⁵ noisy traces, along with simulation input and output
DISCUSSION
We used a validated computational model together with a Monte Carlo approach to produce 2
x 105 simulated VO
2P datasets with similar sampling, noise and kinetic characteristics as
experimentally-obtained VO2P data. As the true underlying VO2P kinetic parameters of these
datasets were known from the clean simulation traces from which they were produced, we
could assess both the accuracy and the precision of various averaging and fitting procedures
on the estimation of VO2P; something that is not feasible using experimentally-obtained data
where the true underlying VO2P is not known. We showed that the optimal data handling
steps to give the most accurate and precise estimation of VO2P were linear interpolation with
ensemble averaging data from four bouts of exercise, followed by removal of the first 20 s (if
exercise was from unloaded pedaling) or 15 s (if exercise was from a raised work rate) of
data before mono-exponential fitting of the isolated 2 data. Variations on the averaging
method led to substantially similar results, with the exception that the confidence interval for
kinetic estimation was significantly wider for the technique of independently fitting repeats of
the same exercise transition (the separate method). This suggests that different data
processing techniques currently used among different laboratories is unlikely to substantially
influence the derived parameters. However, it is of note that even the optimal procedures that
we identified yielded VO2P estimates that were within 2 s of true in just 47% of simulations
from unloaded pedaling, rising to only 62% for protocols where exercise started from a raised
work rate.
Data collection: The simulated data of exercise transitions either from unloaded pedaling or
from a raised work rate spanned a wide range of variable and parameter estimates expected
72% of the steady-state response in amplitude, and simulated 2 VO2P spanned
approximately 7 s to 40 s, across transitions ranging from 50 W to 150 W in amplitude,
making our findings widely generalizable to the study of moderate-intensity VO2P kinetics in
healthy adults. We showed that averaging data from four exercise bouts optimized accuracy
and precision of VO2P estimation, while minimizing experimental burden, regardless of the
averaging or fitting methods subsequently used. Averaging more bouts did not give a
significantly more precise or accurate estimation of VO2P. Some investigators may be
willing to accept lower accuracy and precision in VO2P estimation in order to reduce the
testing burden of four exercise bouts. For example, interpolating and averaging three bouts of
UP-WR exercise, and removing 20 s of data to isolate 2, resulted in VO2P estimations that
were 2.00 ± 2.39 s from true, with 45.0% of these estimations within 2 s of true, a relatively
small reduction in accuracy and precision compared to the same data handling method with
four exercise bouts (1.97 ± 2.08 s and 46.5%). These differences are associated with an
increase in the minimal detectable difference for VO2P, e.g. for use in comparative and
interventional studies, from ~5 s to ~6 s. The data shown in Table 3 can be used to inform
such decisions.
Our 4-bout data collection recommendation is only applicable to data that have similar
breath-by-breath fluctuation characteristics as the data produced in our simulation studies (68
± 26 ml.min-1). Nevertheless, our simulated transitions mimicked very well typical
observations using many standard gas exchange measurement approaches. Our findings
indicate that in order to provide more precise estimations of VO2P from experimental data,
strategies should focus not on averaging additional exercise bouts, but on increasing the
signal-to-noise ratio in the collected data. These findings echo those of Lamarra et al. (32),
percentage of the steady-state change in the VO2P response, increased the confidence
intervals for the estimated fit parameters ( 1 duration and 2 VO2P). We showed that
approaches that increase the signal-to-noise ratio have a substantial effect on precision, but
little effect on accuracy, of kinetic estimates. These fluctuations are expected to arise from
the interaction of a number of variables, not least the breath-by-breath variations in tidal
volume and pulmonary blood flow, within which fluctuation and timing of stroke volume and
thoracic pressure changes may variably sum or counteract one another to give rise to
fluctuations in gas exchange. Therefore, algorithms for breath-by-breath gas exchange
measurement that reduce the inherent fluctuation of the data, e.g. by accounting for changes
in alveolar gas storage, or by re-characterizing a breath to be equal to a tidal breathing cycle
that returns to an identical end-expiratory lung volume (6, 13), would be expected to further
reduce the testing burden while maintaining optimal precision and accuracy of kinetic
estimates.
Data processing: Although there are many possible methods for data averaging, the four
techniques examined in this study (interpolation, binning, stacking, and separate fitting)
provide a cross-section of the most commonly used methods. Although we have identified
linear interpolation followed by ensemble averaging as the optimal method for averaging data
[similar to the findings of Keir et al. (26)], both the breath binning and stacking methods
produced quantitatively similar estimates of VO2P. As such, researchers who have
previously used, or currently use, any of these methods should be confident that their choice
of averaging procedure does not unduly influence their estimates of VO2P. While averaging
of the exponential fit parameters from separate bouts of exercise offers the simplicity of
avoiding potentially complicated and assumption-laden averaging procedures on large
lessened the confidence in the derived parameter estimates and should therefore be avoided.
This likely arose because the influence on VO2P of breath-by-breath fluctuations is
non-linear: large ‘noise’ in the early transient has more influence on VO2P than the same ‘noise’
in the later transient (57). Therefore, data handling approaches that first reduce
breath-by-breath fluctuations and then characterize the fit (rather than the other way around) appear to
result in more robust parameterization of the kinetics.
Another cautionary note is evident in our data for the interpolation method of averaging. This
method appears to return a substantially narrowed confidence interval for VO2P estimation
(Figure 3B, 7E and 8E). However, because the confidence interval is dependent on the
number of samples (i.e. breaths), interpolation artificially increases the sampling frequency of
the original data. The interpolation method therefore returns an artificial confidence interval
that is more dependent on the characteristics of the interpolation than on the original
measurements (21). The true confidence interval of parameter estimation for the interpolation
method is likely better reflected in the binned and stacked methods (Fig 3B), which were
substantially similar across all simulations.
Each data processing method investigated resulted in a similar degree of accuracy around the
true value, and therefore approaches to data processing should focus on attempts to optimize
the confidence of parameter estimation. As with data collection, valid and appropriate
processing methods that reduce breath-by-breath fluctuations in the data will result in
increased confidence.
Data fitting: We found that empirical time removal methods to isolate the 2 data for fitting
bi-exponential fit, or statistical and time-derivative methods to identify the 1-2 transition
followed by a mono-exponential fit to the isolated 2 data. The majority of published
experimental studies that have quantified the kinetics of VO2P have used such empirical time
removal methods (usually removing the first 20 s of data), and so researchers have
historically used the 2 isolation method that we have now shown provides the most accurate
and precise estimations of VO2P. Furthermore, this empirical time removal approach is far
simpler to implement than the bi-exponential, statistical or time-derivative methods. Previous
recommendations have been to remove at least 20 s of data from the beginning of the dataset
in order to completely remove 1 data, even though some data from the start of 2 may also
be removed (7, 57). However, our results suggest that, somewhat counter-intuitively, it is
better to include a small amount of data from the end of 1 in the fitting procedure than
exclude data from the start of 2. This is seen in Figs. 5B and 6B, where 1 amplitude and 2
VO2P estimation for exercise from unloaded pedaling was more precise and accurate when
the initial 15 s of data were removed than when the initial 25 s of data were removed (the true
1-2 transition for these data occurred at 19.5 ± 3.3 s). We suggest that this is because the
inherent fluctuations in the VO2P data means that including a small amount of 1 data in the
fit has minimal effect on the resultant 1 amplitude and 2 VO2P estimation. The rapidly
changing initial portion of 2 data (which changes rapidly with respect to the
breath-by-breath fluctuations at the end of 1) is key to obtaining accurate and precise estimations.
Qualitatively similar results were found for exercise that started from a raised work rate, but
here the best VO2P estimation was with the removal of the first 15 s of data (Fig. 8F). This is
likely due to the increased baseline work rate elevating cardiac output, which reduces
muscle-to-lung blood transit times and, therefore, the cardiodynamic 1 duration. Nevertheless, the
accuracy and precision of VO2P estimation was statistically similar for WR-WR transitions
on the side of caution when isolating 2 VO2P data and remove no more than 20 s of data to
optimize VO2P estimation.
Implications for interpretation of 2 VO2P kinetics: There are two significant findings from
our simulations that have implications for interpretation of 2 VO2P kinetics. Firstly, we
found that, on average, 2 VO2P was overestimated in all the data collection and handling
strategies investigated. This overestimation can be explained, at least in part, by the
two-phase VO2P response and the non-exponentiality of 2 (3, 5, 8, 25; cf. 18). Figure 9 shows
the effects on 2 VO2P estimation when the mono-exponential Equation (2) is fit to clean
simulation output data from different points throughout the VO2P response. If the
mono-exponential fit is started during 1 (i.e. from any point before 19.4 s in this example) then the
estimated 2 VO2P is larger than true, due to the inclusion of some 1 data in the fit. If the
fit is started after the 1-2 transition, then the 2 VO2P estimation is also larger than true,
becoming larger as the fit is started further from the 1-2 transition, because the underlying
2 response is not a pure exponential; it initially increases more rapidly than a
mono-exponential before slowing down as it reaches the steady-state (8). Only a fit that starts
exactly at the 1-2 transition returns the true 2 VO2P. For these clean simulated data,
inaccurate identification of the 1-2 transition by just 2 s can result in a 2 VO2P estimation
that is 1.6 s larger than the true value; the influence of noise in experimentally-obtained data
may exacerbate this error. Because of these effects on 2 VO2P estimation, when using the
identified optimal data processing and fitting procedures we were only able to estimate 2
VO2P to within 2 s of true in 47% of the 104 UP-WR simulations, and in 62% of the 104
WR-WR simulations [2 s represents an effect size of ~10% for a healthy young human,
where VO2P is typically ~20 s (45)]. Extrapolating this analysis further, we calculated the
Figs. 8B, D and F); VO2P estimates from outside this confidence interval are statistically
likely to come from a different distribution/population. These 95% confidence limits, for
VO2P estimates using our predetermined optimal data processing and fitting procedures, are
± 4.08 s and ± 4.51 s from the mean, for transitions from unloaded pedaling or a raised work
rate respectively (Table 3). We therefore propose that the minimally important difference for
a significant change in VO2P, e.g. during interventional and comparative studies, should be
5.0 s. If the number of averaged bouts is reduced from the optimum of four, this minimally
important difference should be increased in accordance with the confidence limits shown in
Table 3.
The second implication for interpretation of VO2P from our data is to question whether an
exponential fit should be used at all. We have previously shown that the dynamics and
mixing of circulatory compartments between muscle and lung distort the
approximately-exponential muscle VO2 kinetics into a non-exponential 2VO2P response at the lung (8). A
recent meta-analysis of available data measuring both muscle and lung VO2 kinetics during
cycling and knee extension exercise demonstrates a wide variability of VO2 between muscle
and lung (27). Some have proposed alternative methods to assess kinetic responses, such as
the time to steady state (45). However, such approaches have been demonstrated to be both
inherently more variable than relying on a method that maximizes the utility of available
non-steady-state data (24, 47) and is conceptually flawed on the basis that the time to steady state
of a non-exponential process is continually changing (8). Alternative approaches to kinetics
estimation using, for example, pseudorandom binary sequence exercise testing and
time-series analysis may allow for muscle VO2 to be resolved by alternative methods (24, 31). It
remains to be determined whether such methods provide increased accuracy for non-invasive
step transitions. Our simulations here demonstrate that a mono-exponential fit to 2VO2P is a
useful and concise method for accurately describing the overall kinetics of the
exponential-like pulmonary 2VO2 kinetic response.
Limitations: The means and SDs of the parameters used in our Monte Carlo simulations were
representative of healthy young adults (8, 22). Quantitatively different results may be found
for other populations with different 2 VO2P kinetic parameters, such as the elderly or heart
failure patients who have slowed VO2P kinetics (9, 39). Nevertheless, our main qualitative
findings will still be pertinent when collecting, processing and fitting VO2P data from these
other populations. In particular, our main point regarding optimal data collection and
processing methods – that methods should be employed to minimize breath-by-breath
fluctuations and that it is essential to include all 2 VO2P data in the fit – will more than
likely stand for these populations, as it is still expected that the (potentially slowed) initial
portion of 2 VO2P will change rapidly with respect to the noise in the data at the end of 1.
For populations where individuals are expected to have a reduced cardiac output and slowed
cardiac output kinetics, and a concomitant prolongation of 1 duration compared to young
healthy adults [such as heart failure patients (52)], the use of a bi-exponential fit, or statistical
or derivative methods, to automatically identify the 1-2 transition is inherently attractive.
However, our results highlight that the noise in the VO2P data limit the ability of these
methods to correctly identify the 1-2 transition, reducing the accuracy and precision of
subsequent VO2P estimation. In this study, the empirical time-removal methods (removal of
the first 20 s of data for exercise from unloaded pedaling, or 15 s if exercise was started from
a raised baseline) were the only methods that gave statistically similar VO2P estimates to
be determined whether removal of the first 20 s of data results in the most accurate and
precise VO2P estimations for populations where 1 is prolonged, but it may be necessary to
compensate for the prolonged 1 duration when removing 1 data from the fitting window.
Only on-transient exercise in the moderate intensity domain was simulated in this study. It is
still to be determined whether the identified optimal fitting procedures will produce the most
accurate and precise VO2P estimations for on-transient data in higher exercise intensity
domains where fitting can be complicated by the emergence of a VO2P slow component (40,
45). Similarly, the applicability of our identified optimal procedures for off-transient data,
where cardiac output is expected to be initially elevated and so produce a much shorter 1,
potentially influencing the amount of data that should be removed before fitting, is still to be
determined.
CONCLUSIONS
We used a validated computational model together with a Monte Carlo approach to assess the
accuracy and the precision of various averaging and fitting procedures on the estimation of
VO2P kinetics. Our analyses showed that four bouts of exercise was the optimal number to
average in order to increase accuracy and precision of VO2P estimation. Choice of averaging
strategy was not so critical, with interpolation, bin averaging and stacking all giving
quantitatively similar VO2P estimates. The interpolation, binning and stacking methods did,
however, allow more confident parameter estimates when compared to analyzing repeated
bouts separately. Data collection and processing strategies should therefore focus on
increasing the signal-to-noise ratio in the collected data. Contradictory to previous advice that
that data fitting procedures should remove no more than 20 s of data, as this provided the
most precise and accurate estimates of VO2P. Our analyses showed the widely used standard
approaches for data collection, processing and fitting, while often different between
laboratories, did not have a substantial effect on the quantitation of 2 VO2P kinetics per se.
However, we found that even this optimal procedure yielded VO2P estimates that were
within ± 2 s of true in only 47-62% of simulations. Thus, we identified the minimally
GRANTS
This work was supported by a Biotechnology and Biological Science Research Council UK
research grant (BR/I00162X/1) and a University of Leeds International Research
Collaboration Award.
DISCLOSURES
No conflicts of interest, financial or otherwise, are declared by the authors.
AUTHOR CONTRIBUTIONS
All authors conceived and designed the study; A.P.B. carried out the simulations and
processed and analyzed the collected data; all authors interpreted the results of the
simulations; A.P.B. prepared the figures and the first draft of the manuscript; all authors
REFERENCES
1. Babcock MA, Paterson DH, Cunningham DA, Dickinson JR. Exercise on-transient
gas exchange kinetics are slowed as a function of age. Med Sci Sports Exerc 26:
440-446, 1994.
2. Bangsbo J, Krustrup P, González-Alonso J, Boushel R, Saltin B. Muscle oxygen
kinetics at onset of intense dynamic exercise in humans. Am J Physiol Regul Integr
Comp Physiol 279: R899-R906, 2000.
3. Barstow TJ, Lamarra N, Whipp BJ. Modulation of muscle and pulmonary O2 uptakes
by circulatory dynamics during exercise. J Appl Physiol 68: 979-989, 1990.
4. Barstow TJ, Molé PA. Linear and nonlinear characteristics of oxygen uptake kinetics
during heavy exercise. J Appl Physiol 71: 2099-2106, 1991.
5. Barstow TJ, Molé PA. Simulation of pulmonary O2 uptake during exercise transients in
humans. J Appl Physiol 63: 2253-2261, 1987.
6. Beaver WL, Lamarra N, Wasserman K. Breath-by-breath measurement of true
alveolar gas exchange. J Appl Physiol 51: 1662-1675, 1981.
7. Bell C, Paterson DH, Kowalchuk JM, Padilla J, Cunningham DA. A comparison of
modelling techniques used to characterise oxygen uptake kinetics during the on-transient
of exercise. Exp Physiol 86.5: 667-676, 2001.
8. Benson AP, Grassi B, Rossiter HB. A validated model of oxygen uptake and
circulatory dynamic interactions at exercise onset in humans. J Appl Physiol 115:
743-755, 2013.
9. Bowen TS, Cannon DT, Murgatroyd SR, Birch KM, Witte KK, Rossiter HB. The
heart failure is related to the severity of the condition. J Appl Physiol 112: 378-387,
2012.
10. Bringard A, Adami A, Moia C, Ferretti G. A new interpolation-free procedure for
breath-by-breath analysis of oxygen uptake in exercise transients. Eur J Appl Physiol
114: 1983-1994, 2014.
11. Bruce EN. Temporal variations of breathing pattern. J Appl Physiol 80: 1079-1087,
1996.
12. Brunner-La Rocca HP, Weilenmann D, Follath F, Schlumpf M, Rickli H, Schalcher
C, Maly FE, Candinas R, Kiowski W. Oxygen uptake kinetics during low level
exercise in patients with heart failure: relation to neurohormones, peak oxygen
consumption, and clinical findings. Heart 81: 121-127, 1999.
13. Capelli C, Cautero M, di Prampero PE. New perspectives in breath-by-breath
determination of alveolar gas exchange in humans. Pflugers Arch 441: 566-577, 2001.
14. Capelli C, Cautero M, Pogliaghi S. Algorithms, modelling and VO kinetics. Eur J
Appl Physiol 111: 331-342, 2011.
15. Casaburi R, Daly J, Hansen JE, Effros RM. Abrupt changes in mixed venous blood
gas composition after the onset of exercise. J Appl Physiol 67: 1106-1112, 1989.
16. Chechile RA. Pooling data versus averaging model fits for some prototypical
multinomial processing tree models. J Math Psychol 53: 562-576, 2009.
17. Dunn WL, Shultis JK.Exploring Monte Carlo Methods. Amsterdam, The Netherlands:
Elsevier, 2012.
18. Francescato MP, Cettolo V, di Prampero PE. Oxygen uptake kinetics at work onset:
role of cardiac output and of phosphocreatine breakdown. Respir Physiol Neurobiol 185:
19. Francescato MP, Cettolo V, Bellio R. Assembling more O2 uptake responses: Is it
possible to merely stack the repeated transitions? Respir Physiol Neurobiol 200: 46-49,
2014.
20. Francescato MP, Cettolo V, Bellio R. Confidence intervals for the parameters
estimated from simulated O2 uptake kinetics: effects of different data treatments. Exp
Physiol 99: 187-195, 2014.
21. Francescato MP, Cettolo V, Bellio R. Interpreting the confidence intervals of model
parameters of breath-by-breath pulmonary O2 uptake. Exp Physiol 100:475, 2015.
22. Grassi B, Poole DC, Richardson RS, Knight DR, Erickson BK, Wagner PD. Muscle
O2 uptake kinetics in humans: implications for metabolic control. J Appl Physiol 80:
988-998, 1996.
23. Grassi B, Porcelli S, Marzorati M, Lanfranconi F, Vago P, Marconi C, Morandi L.
Metabolic myopathies: functional evaluation by analysis of oxygen uptake kinetics. Med
Sci Sports Exerc 41: 2120-2127, 2009.
24. Hoffmann U, Drescher U, Benson AP, Rossiter HB, Essfeld D. Skeletal muscle VO2
kinetics from cardio-pulmonary measurements: assessing distortions through O2
transport by means of stochastic work-rate signals and circulatory modelling. Eur J Appl
Physiol 113: 1745-1754, 2013.
25. Hughson RL. Oxygen uptake kinetics: historical perspective and future directions. Appl
Physiol Nutr Metab 34: 840-850, 2009.
26. Keir DA, Murias JM, Paterson DH, Kowalchuk JM. Breath-by-breath pulmonary O2
uptake kinetics: effect of data processing on confidence in estimating model parameters.
27. Koga S, Rossiter HB, Heinonen I, Musch TI, Poole DC. Dynamic heterogeneity of
exercising muscle blood flow and O2 utilization. Med Sci Sports Exerc 46: 860-876,
2014.
28. Kohl J, Koller EA, Jäger M. Relation between pedaling- and breathing rhythm. Eur J
Appl Physiol 47: 223-237, 1981.
29. Koppo K, Bouckaert J, Jones AM. Effects of training status and exercise intensity on
phase II VO2 kinetics. Med Sci Sports Exerc 36: 225-232, 2004.
30. Korzeniewski B, Rossiter HB. Each-step activation of oxidative phosphorylation is
necessary to explain muscle metabolic kinetic responses to exercise and recovery in
humans. J Physiol 593: 5255-5268, 2015.
31. Koschate J, Drescher U, Baum K, Eichberg S, Schiffer T, Latsch J, Brixius K,
Hoffmann U. Muscular oxygen uptake kinetics in aged adults. Int J Sports Med 37:
516-524, 2016.
32. Lamarra N. Variables, constants, and parameters: clarifying the system structure. Med
Sci Sports Exerc 22: 88-95, 1990.
33. Lamarra N, Whipp BJ, Ward SA, Wasserman K. Effect of interbreath fluctuations on
characterizing exercise gas exchange kinetics. J Appl Physiol 62: 2003-2012, 1987.
34. Lamarra N, Whipp BJ, Ward SA, Wasserman K. The effect of hyperoxia on the
coupling of ventilator and gas-exchange dynamics in response to impulse exercise
testing. In: Concepts and Formalizations in the Control of Breathing, edited by
Benchetrit G, Baconnier P, Demongeot J. Manchester, UK: Manchester University Press,
1987.
35. Lewis RM, Torczon V, Trosset MW. Direct search methods: then and now. J Comput