Statistics
in focus
INDUSTRY, TRADE
AND SERVICES
4
THEME 4 - 2 6 / 1 9 9 9
SECTORIAL PROFILES
C o n t e n t s
One million people working in the 'passenger land transport' sector. High selfemployment rate (38%) among taxis 2 Low turnover per person employed in the 'passenger land transport' sector — at EU level: 65% lower than in the transport sector as a whole 4 Highest wage adjusted labour productivity in Finland. Luxem bourg has the highest per
capita productivity 5
Taxis dominate the number of
enterprises 6
* * + * * * ir * * * • *
■ H
eure
»stat
Jr
Manuscript completed on: 06.06.1999 ISSN 1561-4840Catalogue number: CA-NP-99-026-EN-C Price in Luxembourg per single copy (excl.VAT):EUR6
Transport Business
Statistics
Taxi drivers: high wage adjusted labour productivity, but
low per capita productivity
* * * t t t * t « « * * * * * e * * * * * t · * · * * *
Aurora Ortega Sanchez
There are over one million people working in more than 200 thousand enterprises in the 'passenger land transport' sector (the sum of 3 NACE sectors: 60.21 buses & urban railways, etc + 60.22 taxis + 60.23 coach charter, etc). Note that rail transport, other than urban rail (tramway and underground), is not covered here.
The taxi drivers dominate (85%) the number of enterprises. The self-employment rate among taxi drivers is relatively high, 38%. The number of taxi drivers employed per enterprise is close to 1. The taxi drivers have a high wage adjusted labour productivity (185%), but a low per capita productivity (12 thousand ECU). This may be due to high competition among the cars and the persons employed and the low skill level required.
Number of enterprises
Number of persons employed
Number of employees
Turnover
Value added at factor cost [
Personnel costs f
MJ
o%
2 5 % 5 0 % 7 5 % 100%D 60.21 buses & urban railway, etc ■ 60.22 taxis
Π 60.23 coach charter, etc
Figure 1: Sub-sector distribution for the 'passenger land transport' sector at EU level
In the 'passenger land transport' sector the wage adjusted labour productivity is 107%, higher than in the transport sector as a whole (94%). As mentioned before, the taxi drivers and also the 'coach charter' sector have a high wage adjusted labour productivity.
One million people working in the 'passenger land transport' sector.
High self-employment rate (38%) among taxi drivers.
41 persons employed per enterprise in the 'buses & urban railway' sector.
In 1995 the European Single Market numbered more than 142 million persons occupied, 94 million of them in market and non-market services. Market services alone gave work to almost 65 million people in the EU in 1995. Transport services employed 6.5 million persons. Nearly 4 million people were employed in the 'land transport' sector. The 'passenger land transport' enterprises in the EU employed 1.04 million persons.
The biggest sub-sector within
passenger land transport is 'buses & urban railway' (60.21) accounting for
67% or 696 thousand persons
employed. Second is 'taxis' (60.22) with 25% or 260 thousand persons employed.
There are 890 thousand employees in the 'passenger land transport' sector in the EU. Among them, 73% or 653 thousand work in the 'buses & urban railway' (60.21) sector. 18% or 160 thousand employees work with 'taxis' (60.22).
Average number of
Year
EU-15 1996
EUR-11 1996
Β DK D EL E F IRL I L NL A Ρ FIN S UK
1995 1996 1996 1996 1996 1996 1996 1995 1996 1996 1996 1996 1997 1996 1996
Nace Rev. 1
(60.2A) (60.21) (60.22) (60.23) (60.2A) (60.21) (60.22) (60.23)
(60.2A)
Number of persons employed
1 040 000
696 00C 260 000 84 000
840 000
555 000 212 000
73 000
27 299
173 305
134 451
1 867
35 613
18 044
Ratio Number of employees / employees
890 000
653 000
160 000
77 000
720 000
532 000 120 000 68 000
24 843
146 248
110 851
1 689
31 910
13 584 35 321
employed
0.86
0.94 0.62 0.92
0.86
0.96 0.57 0.93
0.91
0.84
0.82 0.90
0.90
0.75
persons employed per enterprise
5.0
40.9 1.5 5.6
4.5 46.3
1.3 6.1
5.1
6.3 10.6
7.8
2.2
The self-employment rate for
'passenger land transport' at EU and euro-zone level is 14%. 'Taxis'
account for the highest
self-employment rate, 38% at EU-level. The two other sub-sectors have a
relatively low level of
self-employment.
(60.22)
25%
(60.21)
[image:2.595.37.559.65.785.2]67%
Figure 2: Sub-sector distribution of number of persons employed for the 'passenger land transport ' sector in
the EU
Table 1: Number of persons employed and employees in the' passenger land transport ' sector (60.2A) and its sub-sectors: 'Buses & urban railway ' (60.21),
'taxis' (60.22) and 'coach charter' (60.23)
50%
40%
30%
20%
10%
(60.2A) (60.21) (60.22) (60.23)
Β EU-15 D EUR-11
Figure 3: Self-employment in the 'passenger land transport ' sector
and its sub-sectors
Statistics in focus — Theme 4 — 26/1999 ·
50
40
30
-20
10
0
|
I
1
I
■n 11 __^M1
(60.2A) (60.21) (60.22) (60.23)
S EU-15 Π EUR-11
Figure 4: Average number of persons employed per enterprise in the 'passenger land transport ' sector
and its sub-sectors
m
[image:2.595.34.574.490.811.2]There ¡s an average of 5.0 persons employed per enterprise in the 'passenger land transport' sector, at EU-15 level. For 'buses & urban railway' (60.21) the average is much higher, 41 persons employed per enterprise. On the other end of the scale is 'taxis' (60.22) with just 1.5 persons employed per enterprise. This figure goes hand in hand with the high self-employment figure for this sub-sector.
Data are available only for 6 countries. Among them, the Member State with the highest number of persons employed is France, with 173 thousand. Italy is second with 136 thousand.
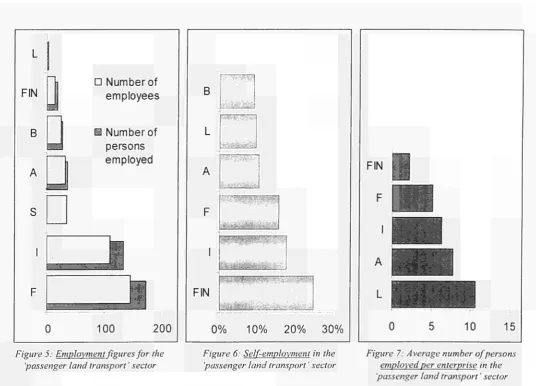
Finland records having the highest self-employment rate for the 'passenger land transport' sector under those countries for which data is already available.
Italy and France are second and third with self-employment rates of 18% and 16% respectively for the 'passenger land transport' sector.
Italy, the only Member State with data available for the sub-sectors, records a high self-employment rate in 'taxis' (60.22), 8 1 % . The self-employment rate is there also relatively high (43%) for 'coach charter' (60.23). In the sub-sector 'buses & urban railway' (60.21) the self-employment rate is below 3%.
Belgium records the lowest self-employment rate (9%) for the 'passenger land transport' sector followed by Luxembourg, with a 10% share.
Facing only a low number of enterprises, Luxembourg has the highest number of employed per enterprise (10.6 persons) for the 'passenger land transport' sector.
In Italy, the only country with data available, the sub-sector 'buses & urban railway' (60.21) showed a high level of persons employed per enterprise, 44. The other sub-sectors recorded few persons employed per enterprise: 1.3 for 'taxis' (60.22) and close to 3 in the case of 'coach charter' (60.23).
FIN
Β
D Number of employees
M Number of persons employed
[image:3.595.30.567.396.782.2]0
100
200Figure 5: Employment figures for the 'passenger land transport ' sector
im
eurostat
Β
A
*!Ρ9Ρ11
■
.
0%
10%
20%
30%
Figure 6: Self-employment in the 'passenger land transport ' sector
FIN
0
10
15
Figure 7: Average number of persons employed per enterprise in the 'passenger land transport ' sector
I
Low turnover per person employed in the 'passenger land transport' sector
at EU level: 65% lower than in the transport sector as a whole.
Year
EU-15 1996
EUR-11 1996
Nace Rev. 1
(60.2A) (60.21) (60.22) (60.231 (60.2A) (60.21) (60.22) (60.23)
(million ECU*
employed M 000 ECU»
45 000 33 000 7 000 5 000 35 000 26 000 5 000 4 000
43.3 47.4 26.9 59.5 41.6 46.8 23.6 54.8
Β 1995(60.2A) DK 1996
D 1996 EL 1996 E 1996 F 1996 IRL 1996
I 1996 L 1996 NL 1996 A 1995 Ρ 1996 FIN 1997 S 1996 UK 1996
Turnover Turnover per person
1 557 57.0 Figure 8: Sub-sector distribution of turnover for the 'passenger land
transport ' sector in the EU
7 903
3 465 66 1 630 1 606
928 3 285 6 127
45.6
25.5 35.6
45.1
51.6
(60.2A) (60.21) (60.22) (60.23)
■ EU-15 O EUR-11
Table 2: Turnover in the 'passenger land Figure 9: Turnover per person employed transport ' sector (J 000 ECU)
Turnover per Turnover
person employed ■ T u r n o v e r per person
(1000 ECU) D T u r n o v e r ' (billion ECU)
60
40
20
0
12
8
Turnover in the 'passenger land transport' at EU level amounts to 45 bn ECU. The majority, 73% or 33 bn ECU, goes into the 'buses & urban railway' (60.21) sub-sector.
Turnover per person employed in the 'passenger land transport' sector is 43.3 thousand ECU, 65% lower than in the transport sector as a whole. In the sub-sector 'coach charter' (60.23) the level of turnover is relatively high, 59.5 thousand ECU per person employed. In 'taxis' (60.22) it is particularly low, just below 27 thousand ECU per person employed.
In the Member States with data available, turnover per person employed for the 'passenger land transport' sector never exceeds the average for the whole transport sector (125 thousand ECU / person employed).
The Member State with the highest turnover per person employed is Belgium, with 57 thousand ECU. Second is Finland, with 52 thousand ECU per person employed. Italy has the lowest turnover per person employed, 25 thousand ECU.
France has the highest turnover (7.9 bn ECU) among Member States with data available for the 'passenger land transport' sector. The United Kingdom is second with 6.1 bn ECU and Italy is third with 3.5 bn ECU.
0
UK
S
NL
Β FIN F
A
L
I
Figure 10: Turnover per person employed (1000 ECU on the left scale) and turnover (billion ECU on the right scale)
Statistics in focus — Theme 4 — 26/1999
[image:4.595.31.559.9.830.2]Highest wage adjusted labour productivity in Finland for the 'passenger land transport
sector. Luxembourg has the highest per capita productivity.
Year
EU-15 1996
EUR-11 1996
Β DK D EL E F IRL I L NL A Ρ FIN S UK
1995 1996 1996 1996 1996 1996 1996 1996 1996 1996 1995 1996 1997 1996 1996
Nace Rev. 1
(60.2A) (60.21) (60.22) (60.23) (60.2A) (60.21) (60.22) (60.23) (60.2A)
Value added at factor cost (million ECU) 25 000
20 200
3 000
2 000
20 000
17 000
2 000
1 000
1 038
4 350
4 698
76
1 762
1 193
676 823
3 518
Personnel costs (million ECU) 20 000
18 000
1 000
1 000
16 000
14 000
1 000
1 000
825
4 851
4 016
59
1 194
826
340
1 087
2 240
Wage adjusted labour productivity
(%)
107 104 185 183 107
116
113 93
114
76
96 117
129
150
Per captia productivity
(1000 ECU) 24 29
12
24 24 31 c 14 38
25
35 41 33 37
Personnel costs
per employee (1000 ECU) 22 28 6 13 22 26 8 15 33
33 36 35
26
25
31
Table 3: Value added at factor cost and personnel costs for the 'passenger land transport ' sector Note: For UK the Value added is measured at basic prices.
30 25 20
15
10
(60.2A) (60.21) (60.22) (60.23) ■ Value-added at factor cost □ Personnel costs
Figure 11: Value-added at factor cast and personnel costs at EU-level for
'passenger land transport ' (billion ECU)
I EUR-11 EU-15 Β L A FIN
[image:5.595.35.549.23.825.2]— — _
1
|| ι
The wealth created, measured by the value-added at factor cost, by EU passenger land transport enterprises amounts to 25 bn ECU. The sub-sector with the highest value-added is 'buses & urban railway' (60.21) with 80% or 20 bn. Personnel costs for the EU passenger land transport enter-8 prises amount to nearly 20 bn.
Almost 18 bn or 90% of these costs comes from the 'buses & urban railway' (60.21) sub-sector.
Where data is available (or publish-able), the wage adjusted labour productivity is highest in Finland (150%).
50 100 150
EU-15 EUR-11 F A I FIN Β L
_ _
I
MM M M M M M I
0 10 20 30 40 50
eurostat
Figure 12: Wage adjusted labour productivity (%)
Figure 13: Per capita productivity (1000 ECU)
<
Wage adjusted labour productivity for the 'passenger land transport' at EU level is 107% as well as within the euro-zone. This is higher than in the EU transport sector (94%). The sub-sector with the highest wage adjusted labour productivity is 'taxis' (60.22) with 185%. Second is 'coach charter' (60.23) with 183% and third 'buses & urban railway' (20.21) with 104%.
As stated before Finland is the Member State with the highest wage adjusted labour productivity. Second is Austria with 129% and third is Luxembourg with 117%. France has the lowest value with 76% under the countries for which data is available.
Another way of calculating labour productivity is to divide the value-added at factor cost by the number of persons employed making the 'per capita productivity'.
The EU per capita productivity for the 'passenger land transport' sector is 24 thousand ECU. This is one third lower than for the whole transport sector (35 thousand ECU). The sub-sector with the highest per capita productivity is 'buses & urban railway' (60.21) with 29 thousand ECU. Second is 'coach charter' (60.23) with 24 thousand ECU. The third and last sub-sector is 'taxis' (60.22) with just 12 thousand ECU. This low value can be due to high competition in some Member States.
Highest per capita productivity among Member States occurs in Luxembourg (41 thousand ECU), followed by Belgium (38 thousand ECU). France has the lowest value (25 thousand ECU) under those countries for which data is available.
The personnel costs per employee for the 'passenger land transport' amounts to 22 thousand ECU, which is lower than in the transport sector as a whole (31 thousand ECU). Where data is available the personnel costs per employee are highest in Italy (36 thousand ECU) and Luxembourg (35 thousand ECU). Personnel costs per employee are lowest in Austria (26 thousand ECU).
Taxis dominate the number of enterprises.
EU-15
EUR-11
Nace Rev. 1 (60.2A) (60.21) (60.22) (60.23) (60.2A) (60.21) (60.22) (60.23)
Number of enterprises 210 000 17 000 178 000 15 000 186 000 12 000 162 000 12 000
Β DK D EL E F IRL I L NL A Ρ FIN S UK
Jahr 1996 1996 1996 1996 1997 1996 1996 1996 1996 1995 1996 1996 1997 1996 1996
Land verkehr
.60)
203 351 79 488 2 593 139 012 578 10 866 9 398 17 056 20 316 26 242 47 566
Personenbe förderung im
Landverkehr .60.2A)
66 911 33 713
22 859 176 2 808 4 593
» 8 645
9 594 8 4 1 2
Figure 14: Sub-sector distribution of the number of enterprises for the 'passenger
land transport ' sector in the EU
There are 210 thousand 'passenger land transport' enterprises active in the EU-15, 89% within the euro-zone. The sub-sector with the highest number of enterprises is 'taxi operation (60.22) accounting for 85% or 178 thousand enterprises.
The Member State with the highest number of enterprises in the 'passenger land transport' sector is Spain with 67 thousand. Second is France with 34 thousand. The figure for the UK seems to be very low, but is the reported one from the Member State.
Table 4: Number of enterprises for the 'passenger land transport ' sector
Statistics in focus — Theme 4 — 26/1999 ·
L
NL
A
□
:
UK
FIN
m
s
ι
F
E
D
■ . .
-_ ■
0
: I
25 50 75
Figure 15: Number of enterprises for the 'Passenger land transport ' sector
[image:6.595.34.552.299.772.2]> ESSENTIAL INFORMATION - METHODOLOGICAL NOTES
Per capita productivity
e » a a .> a
60.2A 'Passenger land transport' (without 'road haulage transport' or 'transport via railways')
Self-employed person
This is a sum of three sectors in the NACE Rev. 1 - the statistical classification of economic activities. It is at 4-digit level. These groups include: 60.2A =
60.21 ('Other scheduled passenger land transport' or the popular term used here: 'buses & urban railway') +
Self-employed persons are defined as persons who are the sole owners, or joint owners, of the unincorporated enterprise in which they work.
16 11 0 Number of persons employed
This covers all persons - both employed and self-employed.
60.22 (Taxi operation' or the popular term 12 11 0 Turnover
used here: 'taxis') +
60.23 ('Other land passenger transport' or the popular term used here: 'coach charter').
The term comes from the 'Council Regulation No 58/97 concerning structural business statistics. However there it is called 'Other land transport' without 'freight transport by road'. Member States supply Eurostat with data on this aggregate. Few Member States supply with data for the three sub-sectors.
Examples of activities: (sub)urban transport of passengers on scheduled routes carried out with motor bus, tramway, street car, trolley-bus, underground and elevated railways, etc; interurban transport, except by rail, of passenger on scheduled routes; operation of school buses, town-to-airport/station lines, funicular railways, aerial cable-ways, etc. Taxi operation also includes other rental of private cars with operator. Other land passenger transport includes other non-scheduled passenger road transport, charters, excursions and other occasional coach services.
Nace codes 60.1 'transport via railways' and 60.24 - 'road haulage transport' are excluded.
1613 0 Number of employees
This heading is defined as a count of the number of employees. Employees are defined as all persons who, by agreement, work for another resident institutional unit and receive remuneration.
Turnover comprises the totals invoiced by the observation unit during the reference period, and this corresponds to market sales of goods or services supplied to third parties.
12 14 0 Value added at basic prices
Value added at basic prices is calculated as follows: Turnover - Purchases of goods and services +/- Change in stocks of goods and services + Capitalised production + Operating subsidies linked to products.
12 15 0 Value added at factor cost
Value added at factor cost is calculated as follows: Value added at basic prices + Operating subsidies linked to production -Duties and taxes linked to production (other than VAT and other taxes directly linked to turnover) linked to production.
13 31 0 Personnel costs
Personnel costs are defined as the total remuneration, in cash or in kind, payable by an employer to an employee in return for work done by the latter during the reference period. Personnel costs can be calculated as follows: Wages and salaries + Social security costs
Wage adjusted labour productivity
According to the "Database of concepts and definitions, CODED - Business Methods": "Value added at factor cost" / ("Personnel costs" * ("Number of persons employed" / "Number of employees"))
According to the same manual this ratio should be: "Value added at market prises" / "Number of persons employed". Proxy used in this statistics in focus is: "Value added at factor cost" / "Number of persons employed".
Estimations
All EU-15 and EUR-11 figures are estimated, by summing available and estimated data.
All estimated figures are marked with grey background.
Figures for missing Member States have been estimated using known data from "bigger" aggregates or similar aggregates to create ratios and weighted structures. The weighted structure means a ratio between two variable's jointly available figures.
Estimating missing values for Number of persons employed: weighted structure using available data in NACE code 60.
Estimating missing values for Number of employees: weighted structure using available data for Number of persons employed.
Estimating missing values for Turnover: weighted structure using available data in Number of Enterprises.
Estimating missing values for Value-added at factor cost: weighted structure using available and estimated data in Turnover.
Estimating missing values for Personnel costs: weighted structure using available and estimated data for Value-added at factor cost.
Estimating missing values for Number of enterprises: weighted structure using available data in NACE code 60.
Further information:
D a t a b a s e s
New Cronos D o m a i n : SBS
To obtain information or to order publications, data bases and special sets of data, please contact the Data S h o p network: B E L G I Q U E / B E L G I Ë
Eurostat Data Shop Bruxelles/Brossel Chaussée d'Etterbeek 13 Etterbeeksesteenweg 13 B1049 BRUXELLES /BRUSSEL
Tel. (32-2)29966 66 Fax (32-2) 295 01 25
EMail:
datashop.brussels@eurostaLcec.be I T A L I A M i l a n o ISTAT
Centro dl Informazione Statistica Sede dl Milano, Eurostat Data Shop Piazza della Repubblica, 22 I20124 MILANO
Tel. (39-02] 65 95 133/134 Fax (39-02) 65 30 75
Email: mileuro@6n.it S U O M I / F I N L A N D
D A N M A R K D E U T S C H L A N D E S P A N A F R A N C E I T A L I A R o m a DANMARKS STATISTIK
Bibliotek og Information Eurostat Data Shop Sejregade 11 DK2100 KØBENHAVN 0 Tel. (4539)17 30 30 Fax (4539) 17 30 03 EMail: bibgdsLdk
STATISTISCHES BUNDESAMT Eurostat Data Shop Berlin OttoBraunStraße 7072 D10178 BERLIN Tel. (4930) 23 24 64 27/28 Fax (4930) 23 24 64 30 EMail:
stbaberlin.datashop@tonline.de
INE Eurostat Data Shop Paseode la Castellana, 183
Oficina 009
Entrada por Estèbanez Calderón E28046 MADRID
Tel. (3491) 583 91 67 Fax (3491) 579 71 20
INSEE Info Service Eurostat Data Shop 195, rue de Bercy Tour Gamma A F75582 PARIS CEDEX 12 Tel. (331)53 17 86 44 Fax (331) 53 17 88 22 EMail: datashop.eurostat@ine.es EMail: datashop@insee.fr
LUXEMBOURG NEDERLAND NORGE PORTUGAL
Eurostat Data Shop Luxembourg BP453
L2014 LUXEMBOURG 4, rue A. Weicker L2721 LUXEMBOURG Tel.(352)43 35 22 51 Fax (352) 43 35 22 221 EMail: dslux@euroslaLdatashop.lu
S V E R I G E
STATISTICS NETHERLANDS Eurostat Data ShopVoorburg pò box 4000
2270 JM VOORBURG Nederland
Tel. (31-70) 337 49 00
Fax (3170) 337 59 84 EMail: datashop@cbs.nl
Statistics Norway Library and Information Centre Eurostat Data Shop Kongens gate 6 P. b. 8131, dep. N0033 OSLO Tel. (4722) 86 46 43 Fax (4722) 86 45 04 EMail: biblioteket@ssb.no
Eurostat Data Shop Lisboa INEJServiço de Difusão Av. António José de Almeida, 2 P1000043 LISBOA Tel. (3511) 842 61 00 Fax (3511) 842 63 64 EMail: data.shop@ine.pt
ISTAT
Centro di Informazione Statistica Sede di Roma, Eurostat Data Shop Via Cesare Balbo. 11a 100184 ROMA Tel. (3906) 46 73 31 05/02 Fax (3906) 46 73 31 07/01 EMail: dipdiff@istat.it
S C H W E I Z / S U I S S B S V I Z Z E R A Statistisches Amt des Kantons Zürich, Eurostat Data Shop Bleicherweg 5
CH8090 Zürich Tel. (411) 225 1212 Fax (411) 225 12 99 EMail: datashop@zh.ch Internetadresse: http://www.zh.cn/slabstik U N I T E D K I N G D O M U N I T E D K I N G D O M U N I T E D S T A T E S O F A M E R I C A
Eurostat Data Shop, Tilastokirjasta Postiosoite: PL 2B
FIN0O022 Tilastokeskus Käyntiosoite: Tyftpajakalu 13 Β, 2 krs Helsinki
Tel. (3589)17 34 22 21 Fax (3589) 17 34 22 79
Spoatl dfttaahcp tilastokeskus@blaslokeskijs li Internetadresse:
h!tp/Mw*WaslokoskusMMk/dalaiihopMrrf
STATISTICS SWEDEN Information service Eurostat Data Shop Karlavagen 100 Box 24 300 S104 51 STOCKHOLM Tel. (468) 783 48 01 Fax (468) 783 48 99 EMail: infoservice@scb.se Media Support Eurostat (for professional journalists only). Bech Building Office A3/48 · L2920 Luxembourg · Tel. (352) 4301 33408
Eurostat Data Shop Enquiries & advice and publications
Office for National Statistics Customers & Electronic Services Unit 1 Drummond Gate Β1Λ5 UKLONDON SW1V2QQ Tel. (44171) 533 56 76 Fax (44171) 533 56 88 EMail: gloria.ryan@ons.gov.uk
Eurostat Data Shop Electronic Data Extractions, Enquiries & advice · R.CADE Unii 1L Moun^oy Research Centre University of Durham UK DURHAM DH1 3SW Tel: (44191) 374 7350 Fax: (44191) 384 4971 EMail: rcade@dur.ac.uk URL: http://wwwrcade.dur.ac.uk
HAVER ANALYTICS Eurostat Data Shop 60 East 42nd Street Suite 3310
USANEW YORK, NY 10165 Tel. (1212)986 93 00 Fax (1212) 986 58 57 EMail: eurodata@haver.com
Fax (352) 4301 32649 · email: media.support@eurostatcec.be For information on methodology:
Aurora ORTEGA-SANCHEZ, Eurostat/D2, L-2920 Luxembourg, tel. (352) 4301 32032, e-mail: Aurora.Ortega-Sanchez@eurostat cec be Peter LINDMARK
ORIGINAL: English
Please visit our web site al http://europa.eu.int/eurostat.html for further information !
A list of worldwide sales outlets is available at the Office for Official Publications of the European Communities.
2 rue Mercier L2985 Luxembourg Tel. (352) 2929 42118 Fax (352) 2929 42709 Internet Address http://europ.eu.int/frlgeneral/sad.htm email: info.info@opoce.cec.be
Order form
?!L®QÌI B B E L G i e - DANMARK - DEUTSCHLAND - GREECE/ELLADA - ESPANA - FRANCE - IRELAND - ITALIA - LUXEMBOURG - NEDERLAND ÖSTFRRFIPH
PORTUGAL - SUOMI/FINLAND - SVERIGE - UNITED KINGDOM - ¡SLAND - NORGE - SCHWEIZ/SUISSE/SVIZZERA - BALGARIJA - C E S ^ E P U B U l S f ^ U S EESTI - HRVATSKA - MAGYARORSZÂG - MALTA - POLSKA - ROMANIA - RUSSIA - SLOVAKIA - ^ ^ ^ » m t ^ m m ^ ^ ^ m ^ t ISRAËL-JAPAN - MALAYSIA - PHILIPPINES - SOUTH KOREA - THAILAND - UNITED STATES OF AMERICA " " 'ND'A
α Please send me a free copy of"'ÉurostaÏMÎni-G~uÎder "(catalogue
containing a selection of Eurostat products and services) Language required: Π DE Π EN Π FR
I would like to subscribe to Statistics in focus (from 1.1.1999 to 31.12.1999): (for the Data Shop and sales office addresses see above)
□ Formula 1 : All 9 themes (approximately 90 issues) □ Paper: 360 EUR
Π PDF: 264 EUR
Π Paper + PDF: 432 EUR
Language required: □ DE Π EN □ FR
ΠΙ Formula 2: One or more of the following seven themes: □ Theme 1 'General statistics'
Π Paper: 4 2 EUR Π PDF: 30 EUR D Combined: 54 EUR
Π Theme 2 'Economy and finance'
□ Theme 3 'Population and social conditions' Π Theme 4 'Industry, trade and services □ Theme 5 'Agriculture and fisheries' □ Theme 6 'External trade'
□ Theme 8 'Environment and energy
□ Paper: 84 EUR Π PDF: 60 EUR O Combined: 114 EUR
Language required: □ DE □ EN D FR
□ I would like a free subscription to 'Statistical References', the information letter on Eurostat products and services
Language required: □ DE Π EN Π FR
Π Mr Π Mrs □ Ms
(Please use block capitals)
Name: First name:
ComPany: Department:
Function:
Address: Post code: Country:
Tel.:
Town:
Fax: E-mail:
Payment on receipt of invoice, preferably by: Π Bank transfer
Π Visa O Eurocard
£ fr d N o : Expires on: Please confirm your intraCommunity VAT n u m b e r


![Crystal structure of dimethyl 3,3′ [(4 chlorophenyl)methylene]bis(1H indole 2 carboxylate)](data:image/gif;base64,R0lGODlhAQABAIAAAP///wAAACH5BAEAAAAALAAAAAABAAEAAAICRAEAOw==)