This is a repository copy of High glucose–induced ROS activates TRPM2 to trigger
lysosomal membrane permeabilization and Zn2+-mediated mitochondrial fission.
White Rose Research Online URL for this paper:
http://eprints.whiterose.ac.uk/119819/
Version: Accepted Version
Article:
Abuarab, N, Munsey, TS, Jiang, L-H orcid.org/0000-0001-6398-0411 et al. (2 more
authors) (2017) High glucose–induced ROS activates TRPM2 to trigger lysosomal
membrane permeabilization and Zn2+-mediated mitochondrial fission. Science Signaling,
10 (490). eaal4161. ISSN 1945-0877
https://doi.org/10.1126/scisignal.aal4161
Copyright © 2017 The Authors, some rights reserved; exclusive licensee American
Association for the Advancement of Science. This is an author produced version of a
paper published in Science Signalling. Uploaded in accordance with the publisher's
self-archiving policy.
eprints@whiterose.ac.uk https://eprints.whiterose.ac.uk/
Reuse
Unless indicated otherwise, fulltext items are protected by copyright with all rights reserved. The copyright exception in section 29 of the Copyright, Designs and Patents Act 1988 allows the making of a single copy solely for the purpose of non-commercial research or private study within the limits of fair dealing. The publisher or other rights-holder may allow further reproduction and re-use of this version - refer to the White Rose Research Online record for this item. Where records identify the publisher as the copyright holder, users can verify any specific terms of use on the publisher’s website.
Takedown
If you consider content in White Rose Research Online to be in breach of UK law, please notify us by
One-sentence summary: ROS produced in response to high glucose trigger mitochondrial fragmentation through a TRPM2-mediated pathway.
Editor’s summary:
Fragmented by diabetic stress
The high circulating glucose concentrations characteristic of diabetes induce the excessive production of reactive oxygen species (ROS), which triggers mitochondrial fragmentation. The cation channel TRPM2 is activated by ROS, leading Abuarab et al. to investigate the role of this channel in mitochondrial fragmentation in endothelial cells, which become dysfunctional in diabetics. In response to high glucose–induced oxidative stress, Ca2+ influx through TRPM2 channels caused lysosomal permeabilization and redistribution of lysosomal Zn2+ to mitochondria. The increase in mitochondrial Zn2+ led to the recruitment of the fission factor Drp-1, resulting in mitochondrial
fragmentation. This pathway may play a role in the pathology of aging-associated diseases that are characterized by increased mitochondrial fragmentation.
High glucose-induced ROS activates TRPM2 to trigger lysosomal membrane
permeabilization and Zn2+-mediated mitochondrial fission
Nada Abuarab1,2,4, Tim S. Munsey1, Lin-Hua Jiang1, Jing Li2,3and Asipu Sivaprasadarao1,2,*
1School of Biomedical Sciences, Faculty of Biological Sciences, 2Multidisciplinary
Cardiovascular Research Centre,3School of Medicine, University of Leeds, LS2 9JT, Leeds,
U.K. 4College of Science and Health Professions, King Saud bin Abdulaziz University for
Health Sciences, P.O.Box 9515, Jeddah 21423, Saudi Arabia.
Corresposnding author:
Professor Asipu Sivaprasadarao
School of Biomedical Sciences
G6.44d, Garstang Building
University of Leeds
Leeds
LS2 9JT UK
Tel: +44-(0)-113-3434326
Fax: +44-(0)-113-3431407
ABSTRACT
Diabetic stress increases the production of reactive oxygen species (ROS), leading to
mitochondrial fragmentation and dysfunction. We hypothesized that ROS-sensitive TRPM2
channels mediated diabetic stress-induced mitochondrial fragmentation. We found that
chemical inhibitors, RNAi silencing and genetic knock-out of TRPM2 channels abolished the
ability of high glucose to cause mitochondrial fission in endothelial cells, a cell type that is
particularly vulnerable to diabetic stress. Similar to high glucose, increasing ROS in
endothelial cells by applying H2O2 induced mitochondrial fission. Ca2+ that entered through
TRPM2 induced lysosomal membrane permeabilization, which led to the release of
lysosomal Zn2+ and a subsequent increase in mitochondrial Zn2+. Zn2+ promoted the
recruitment of the fission factor Drp-1 to mitochondria to trigger their fission. This signaling
pathway may operate in aging-associated illnesses in which excessive mitochondrial
INTRODUCTION
About 10% of the global population currently suffers from diabetes. Diabetes is a major risk
factor for many late-onset diseases that include cardiovascular diseases, neuronal diseases
and cancer (1-3). In diabetic patients, tissues are exposed to abnormally high blood amounts
of glucose, fats and pro-inflammatory cytokines (collectively known as ‘diabetic milieu’) (1, 4,
5). Tissues exposed to diabetic milieu experience oxidative stress due to increased
production of reactive oxygen species (ROS) (4-6). ROS target various mechanisms that
contribute to diabetes-associated diseases, among which mitochondrial dynamics is
emerging as an important disease mechanism (7, 8). By triggering abnormal mitochondrial
fragmentation, ROS impair mitochondrial function, thereby contributing to disease states (
8-12). That mitochondrial dynamics contributes to the disease state is highlighted by the
rescue of oxidative stress-induced dysfunction of many cell types by inhibition of
mitochondrial fragmentation (13-15). Thus mitochondrial dynamics represents an attractive
therapeutic target for many late-onset diseases (8, 9, 16, 17). To fully realise this potential,
however, requires a better understanding of the molecular and cellular mechanisms
responsible for abnormal mitochondrial fragmentation.
Eukaryotic cells maintain a healthy mitochondrial network by regulating the balance between
mitochondrial fusion and fission processes, collectively known as mitochondrial dynamics (
7-10, 18). Oxidative stress, including that imposed by the diabetic milieu, tips this balance
towards mitochondrial fission, leading to fragmented, dysfunctional mitochondria in the cell
(7-9, 11-13, 18, 19). Mitochondrial fusion is mediated by three GTPases: Mfn1, Mfn2 and
Opa1 (8-10, 16, 18). Fission is mediated by the dynamin-related protein (Drp)-1, another
GTPase that forms oligomeric spirals to constrict mitochondria at sites where specific
adaptors (Mff, Mid49-51 and Fis1) are located (9, 16). Under normal conditions, Drp-1 is
mainly localised to the cytoplasm, but during oxidative stress, it is recruited to the network at
sites marked and pre-constricted by the ER tubules (20). Drp-1 recruitment to mitochondria
is regulated and Ca2+dependent (21, 22).
In this study, we hypothesised that ROS-sensitive TRPM2 ion channels mediated oxidative
stress-induced mitochondrial fission because oxidative stress stimulates TRPM2 channels,
and activation of TRPM2 increases intracellular cytosolic Ca2+ concentrations (23-25)
required for mitochondrial fission (21, 22). To address our hypothesis, we selected
endothelial cells, because these cells are harmed by the diabetic milieu. When exposed to
high glucose, they display extensive mitochondrial fragmentation and do not respond to
agonist-stimulated activation of nitric oxide synthase and cGMP production, an effect that is
TRPM2 channels are present in endothelial cells (26). Our results demonstrate a role for
TRPM2 channels in oxidative stress-induced mitochondrial fragmentation, and reveal a
signalling cascade that links oxidative stress to mitochondrial fission.
RESULTS
TRPM2 channels mediate oxidative stress-induced mitochondrial fragmentation
To test our hypothesis, we transfected HUVECs (human umbilical vein endothelial cells) with
pmito-Cherry, a plasmid construct that allows labelling of mitochondria with the cherry
fluorescent reporter protein. Consistent with previous reports, high glucose (33 mM) caused
extensive breakdown of the mitochondrial network, resulting in small, rounded structures
(Fig. 1A). By contrast, cells exposed to normal glucose concentration (5.6 mM), or normal
glucose plus mannitol (to exclude potential osmotic effects by the excess glucose), displayed
a healthy mitochondrial network comprising long, branched tubular networks. High glucose
caused a significant reduction in both the aspect ratio (length to width ratio) and the form
factor (a measure of degree of branching) of mitochondria (Fig. 1, B to D). Inhibition of
TRPM2 channels with the nonspecific channel inhibitor 2-aminoethoxydiphenyl borate
(2-APB) (27) or TRPM2 silencing RNA (fig. S1, A and B), prevented mitochondrial
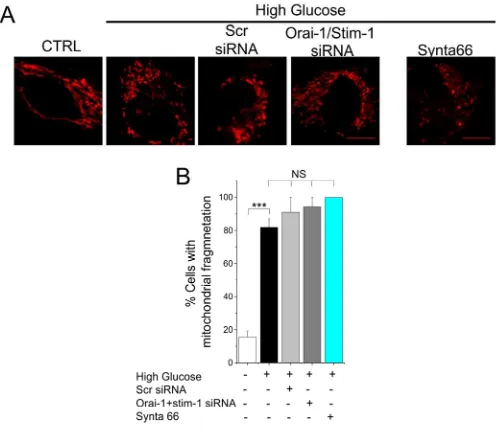
fragmentation (Fig. 1 A to E). By contrast, siRNA-mediated silencing of Stim-1 and Orai-1,
which play a major role in store-operated Ca2+ entry in endothelial cells, or their selective
inhibition with Synta66 (28), failed to prevent high glucose-induced mitochondrial
fragmentation (fig. S2, A and B). These data indicate that TRPM2 channels play a key role in
high glucose-induced mitochondrial fragmentation.
High glucose is not a direct activator of TRPM2 channels, but, as reported previously (12,
29), high glucose increased ROS production within cells (Fig. 1F). The high glucose-induced
increase in ROS thus appeared to be sufficient to activate TRPM2 channels and thereby
cause mitochondrial fragmentation. Consistent with this argument, quenching of ROS with
N-acetyl cysteine prevented high glucose-induced mitochondrial fragmentation (Fig. 1G and
H). Acute activation of TRPM2 channels with H2O2caused mitochondrial fragmentation in a
manner that was blocked by 2-APB or TRPM2 siRNA (fig. S1, C to E), supporting a role for
these channels in mitochondrial dynamics.
To seek further evidence for the role of TRPM2 channels in mitochondrial dynamics, we also
used HEK-293 cells which lack TRPM2 channels (30, 31). H2O2did not affect mitochondrial
morphology in these cells, but heterologous expression of TRPM2 channels led to extensive
on the mitochondrial network of primary endothelial cells from wild-type mice with those from
TRPM2 knock-out (TRPM2-KO) mice. We confirmed the identity of isolated endothelial cells
by immunostaining for the endothelial marker CD-31 (also known as PECAM-1). Similar to
HUVECs, MitoTracker Red staining showed that high glucose caused extensive
mitochondrial fragmentation in primary endothelial cells from wild-type mice (Fig. 2, A to C).
Endothelial cells isolated from TRPM2-KO mice, however, were remarkably resistant to high
glucose-induced mitochondrial fragmentation (Fig. 2, D to F). Finally, mitochondria in the
endothelial cells of intact aorta from TRPM2-KO mice did not undergo fragmentation in
response to high glucose (fig. S3). Together, we provided several lines of evidence
(pharmacological, siRNA, knock-out and HEK cell data) to support our hypothesis that
TRPM2 channels play a key role in oxidative stress-induced mitochondrial fragmentation.
TRPM2 channels regulate mitochondrial fragmentation through Ca2+-induced changes
in Zn2+dynamics
Ca2+ is required for mitochondrial fragmentation (21, 22). However, TRPM2 channels not
only conduct Ca2+, but also regulate intracellular Zn2+ dynamics (23, 24, 31, 32). To exclude
a role for Zn2+, we used DTPA (diethylenetriaminepentaacetic acid) and TPEN
(N,N,N',N'-tetrakis(2-pyridinylmethyl)-1,2-ethanediamine) (31). Chelation of extracellular Zn2+ with
DTPA failed to prevent H2O2-induced mitochondrial fission (fig. S8), suggesting that
extracellular Zn2+entry did not contribute to mitochondrial fission. By contrast, TPEN, which
unlike DTPA also chelates intracellular Zn2+, abolished the ability of high glucose and H
2O2
to induce mitochondrial fragmentation (Fig. 3, A to D; fig. S4, A to D), suggesting that Zn2+
was likely released from an intracellular site. The effect of TPEN was not due to Ca2+
chelation, because the concentation used here is too low (0.3 µM) to bind Ca2+(30, 31, 33) .
Furthermore, the Zn2+ chelating agent clioquinol (31) also prevented H
2O2-induced
mitochondrial fission (fig. S4, A to D). In addition, raising the cytosolic concentrations of Zn2+
with the Zn2+-specific ionophore pyrithione (Zn-PTO) (30) caused extensive mitochondrial
fragmentation, and this effect was rescued by TPEN (Fig. 3, E and F). Together, these data
revealed a role for Zn2+ in oxidative stress-induced mitochondrial dynamics, prompting
further investigation into the relative roles of Ca2+and Zn2+.
We were unable to directly test the role of Ca2+ in mitochondrial fragmentation, because the
currently available Ca2+ chelators, including BAPTA-AM, binds Zn2+ more avidly than Ca2+
(33) and thus are not selective for Ca2+ (30). As an alternative approach, we increased the
cytosolic concentrations of Ca2+using the Ca2+ionophore A23187 (Fig. 3, G to I). Consistent
with previous reports (34, 35), A23187 induced significant mitochondrial fragmentation (Fig.
3, J and K). However, unlike Zn-PTO, A23187 required longer incubation times to cause
entry stimulates intracellular Zn2+release (31). We therefore asked whether A23187-induced
mitochondrial fission could be mediated by Ca2+-induced changes in intracellular Zn2+
dynamics. Consistent with this possibility, TPEN significantly reduced A23187-induced
mitochondrial fission (Fig. 3, J and K). Finally, RNAi silencing of TRPM2 did not prevent
mitochondrial fragmentation induced by A23187 (fig. S5, A and B) and Zn-PTO (fig. S5, A
and C) indicating that TRPM2 channels did not contribute to ionophore-induced effects on
mitochondria. Together, these data indicate that TRPM2-mediated Ca2+ entry affects
intracellular Zn2+dynamics, and thereby mitochondrial fragmentation.
TRPM2 activation and Ca2+entry cause lysosomal membrane permeabilisation
To understand how oxidative stress affects the Zn2+ dynamics, we first examined the
intracellular distribution of free Zn2+. Co-staining for Zn2+ and organelle markers revealed
that, as with other cell types (31, 36), free Zn2+largely localised to lysosomes in HUVECs as
was apparent from the overlap (yellow) of Zn2+ staining (FluoZin-3, green) with lysosomal
staining (LysoTracker Red) (fig. S6A). Exposure to high glucose (but not to mannitol) caused
a decrease in the number of vesicles containing free Zn2+, which was accompanied by a
parallel decrease in the number of LysoTracker Red-positive vesicles (Fig. 4, A and B).
Similar results were obtained when oxidative stress was directly imposed with H2O2(fig. S6,
B and C). The decrease in the number of LysoTracker Red positive vesicles was not an
artefact resulting from reduced uptake of the LysoTracker Red dye because H2O2 caused
release of cathepsin B from lysosomes (fig. S7, A and B). These results suggest that high
glucose and H2O2, like other oxidative insults (37), induce lysosomal membrane
permeabilisation and that lysosomal membrane permeabilisation causes loss of lysosomal
Zn2+.
Our data suggested that TRPM2-mediated Ca2+ entry affects intracellular Zn2+ dynamics
(Fig. 4, A; fig. S6, B). Because lysosomal membrane permeabilisation mobilised lysosomal
Zn2+, we examined the role of TRPM2 channels and Ca2+ entry on lysosomal membrane
permeabilisation. TRPM2-siRNA, but not scrambled siRNA, inhibited lysosomal membrane
permeabilisation induced by both high glucose (Fig. 4, A and B) and H2O2(fig. S6, B and C)
and the associated loss of lysosomal Zn2+. To confirm the role of TRPM2 in lysosomal
membrane permeabilisation, we used HEK-293-TRPM2tet cells, which express TRPM2
channels only when induced with tetracycline. In the absence of tetracycline, H2O2 did not
affect the number of lysosomes, but when TRPM2 expression was induced with tetracycline,
cells displayed robust lysosomal membrane permeabilisation (Fig. 4, C and D). Together,
these results provide evidence that lysosomal membrane permeabilisation is not a
nonspecific process, but is regulated by a Ca2+ channel. To demonstrate that Ca2+ entry
Ca2+ with A23187, which triggered lysosomal membrane permeabilisation (Fig. 4, E and F).
siRNA-mediated silencing of TRPM2 chanels failed to prevent A23187-induced lysosomal
permeabilisation, indicating that TRPM2 acts upstream in the signalling cascade (Fig. 4G).
Together, our data demonstrate that oxidative stress causes lysosomal membrane
permeabilisation by stimulating TRPM2-mediated extracellular Ca2+ entry. Although the
precise mechanisms by which Ca2+ entry induces lysosomal membrane permeabilisation
remain to be investigated, these results demonstrate that Ca2+-induced lysosomal
membrane permeabilisation leads to the mobilisation of lysosomal Zn2+.
TRPM2-induced lysosomal membrane permeabilisation is accompanied by an
increase in mitochondrial Zn2+
Although lysosomal membrane permeabilisation caused release of lysosomal Zn2+, there
was no detectable increase in cytosolic Zn2+(Fig. 4, A; fig. S6, B). Because mitochondria can
sequester free Zn2+ (31, 38), and because mitochondrial fission was prevented by Zn2+
chelation (Fig. 3, A to F, J and K), we asked whether Zn2+ released during lysosomal
membrane permeabilisation was removed by mitochondria. To test this notion, we
co-stained high glucose-treated cells with FluoZin-3 and MitoTracker Red to label Zn2+ (green)
and mitochondria (red) respectively. The numerous yellow puncta in merged images of high
glucose-treated cells indicated the presence of Zn2+in fragmented mitochondria. By contrast,
in control and mannitol-treated cells, the mitochondrial network was intact and there was no
detectable free Zn2+ in mitochondria (Fig. 5, A to C). We also examined high glucose- and
H2O2-induced increases in mitochondrial Zn2+ using cells expressing modest amounts of
Mito-Cherry. We selected cells showing partial fragmentation to visualise mitochondria on
their way to full fragmentation using instant Structured Illumination Microscopy (iSIM) (39).
The resulting high resolution images showed the presence of Zn2+ in partially broken
mitochondria (Fig. 5, D). These data suggest that an increase in mitochondrial Zn2+ likely
triggered mitochondrial fragmentation. To confirm that lysosomal membrane
permeabilisation contributed to the increase in mitochondrial Zn2+, we blocked the lysosomal
membrane permeabilisation-mediated lysosomal Zn2+ release with TRPM2 siRNA, which
attenuated high glucose-induced mitochondrial Zn2+ accumulation and as expected, was
accompanied by inhibition of mitochondrial fragmentation (Fig. 5, A to C). Similar results
were obtained in H2O2-treated cells (fig. S9, A and B). Together, these data indicate that Zn2+
released during lysosomal membrane permeabilisation is redistributed to mitochondria.
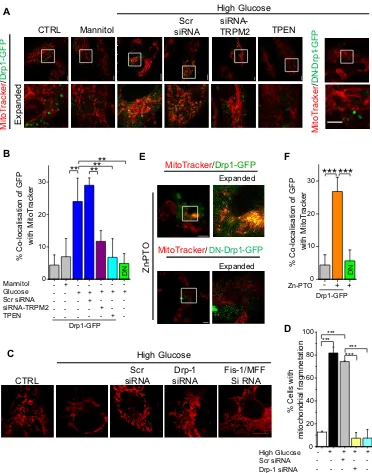
TRPM2 dependent increase in mitochondrial Zn2+promotes Drp-1 recruitment
Mitochondrial fragmentation is initiated by the recruitment of Drp-1, a GTPase that catalyses
increase in mitochondrial Zn2+induced Drp-1 recruitment. To test this notion, we transfected
HUVECs with Drp-1-GFP (a construct that suppresses the activity of endogenous Drp1) (22)
and monitored its recruitment from the cytoplasm to mitochondria. High glucose, but not
mannitol, promoted Drp-1 mitochondrial recruitment, as assessed by the co-localisation of
fluorescence of MitoTracker Red with that of Drp-1-GFP (Fig. 6, A and B). TRPM2-siRNA
suppressed recruitment of Drp-1-GFP, but not the dominant negative Drp-1-GFP, in
response to high glucose (Fig. 6, A and B). Furthermore, RNAi silencing of Drp-1, as well as
its partners, Fis-1 and MFF, prevented high glucose-induced mitochondrial fragmentation
(Fig. 6, C and D). Together, these results suggested that TRPM2 activation leads to Drp-1
recruitment and mitochondrial fragmentation.
We next asked whether Zn2+contributes to Drp-1 recruitment. Chelation of Zn2+with TPEN
markedly inhibited high glucose-induced Drp-1-GFP recruitment (Fig. 6, A and B).
Furthermore, delivery of Zn2+through Zn-PTO stimulated mitochondrial recruitment of
Drp-1-GFP, but not its dominant negative version (Fig. 6, E and F). Together, we conclude that
TRPM2-mediated increase in mitochondrial Zn2+ promotes Drp-1 recruitment and
subsequent mitochondrial fragmentation.
DISCUSSION
Hyperglycaemia is a major risk factor for various human diseases. Multiple studies have
reported that mitochondrial dynamics play a key role in the pathophysiology of diabetes and
diabetes-associated complications (7, 8). Cell-based studies have shown that
hyperglycaemic conditions cause abnormal mitochondrial fragmentation by increasing the
production of ROS (11, 12, 29). However, the underlying signalling mechanisms are not fully
understood. Using endothelial cells as a model system (12), we report a signalling pathway
that linked high glucose-induced ROS production to mitochondrial fragmentation (fig. S10).
The pathway entailed extracellular Ca2+ entry through ROS-activated TRPM2 channels,
Ca2+-induced lysosomal membrane permeabilisation, redistribution of lysosomal Zn2+ to
mitochondria, and Zn2+-induced mitochondrial recruitment of Drp-1 and mitochondrial
fragmentation.
Using pharmacological, RNA-interference and gene knock-out approaches, we
demonstrated that ROS-sensitive TRPM2 channels mediate oxidative stress (high glucose
and H2O2)-induced mitochondrial fragmentation (Fig. 1, A to E, Fig. 2, A to G, fig. S1, C to F
and fig. S3). To gain insight into the underlying mechanism, we examined the roles of Ca2+
and Zn2+ because the intracellular concentrations of both of these ions are increased by
TRPM2 activation (23, 24, 30-32). Although Ca2+is implicated in mitochondrial fragmentation
prevent mitochondrial fragmentation (Fig. 3, A to D and fig. S4, A-D). This role for Zn2+ was
further supported by the finding that delivery of Zn2+ through the zinc ionophore, Zn-PTO,
caused mitochondrial fragmentation (Fig. 3, E and F). The lack of Ca2+-specific chelators
(30, 33) prevented us from directly testing the role of TRPM2-mediated Ca2+ entry in
mitochondrial fission. We have therefore used the Ca2+-ionophore, A23187, which raises
cytosolic concentrations of Ca2+, but not Zn2+(30). Consistent with the previous reports (34,
35), A23187 caused mitochondrial fission, but required longer incubation times (>2 hrs) to
elicit this effect (Fig. 3, J and K), which was inhibited by the Zn2+ chelator TPEN (Fig. 3, J
and K). These results imply that Zn2+ plays a crucial role in Ca2+-induced mitochondrial
fission.
Although TRPM2 channels can promote Zn2+ entry (31, 32), chelation of extracellular Zn2+
with the membrane impermeable DTPA reagent failed to prevent mitochondrial
fragmentation (fig. S8), suggesting that the free Zn2+ required for mitochondrial
fragmentation must come from an intracellular site. The majority of intracellular Zn2+ is
protein bound (33) except in lysosomes where the acidic pH allows Zn2+ to exist in its free
state (31, 36). We asked whether lysosomal Zn2+ was mobilised to affect mitochondrial
dynamics. We found that both high glucose and H2O2 trigger lysosomal membrane
permeabilisation, resulting in the loss of lysosomal Zn2+ (Fig. 4, A and B; fig. S6, B and C).
These results were not surprising because oxidative stress causes lysosomal membrane
permeabilisation (37, 43, 44) and because both high glucose and H2O2 are stress inducing
substances. Unexpectedly, however, we found that pharmacological inhibition or knockdown
of TRPM2 channels prevented high glucose- and H2O2 -induced lysosomal membrane
permeabilisation and the consequent loss of lysosomal Zn2+(Fig. 4, A and B, fig. S6, B and
C). These findings demonstrate that lysosomal membrane permeabilisation is not a
nonspecific process (37), but is regulated by an ion channel. Because the TRPM2 channel is
primarily a Ca2+ channel, we suspected that extracellular Ca2+ entry could stimulate
lysosomal membrane permeabilisation by activating lipases such as phospholipase A2,
sphingomyelinase and phospholipase C (43, 45). Indeed, increased cytosolic Ca2+ with
A23187 caused a marked increase in lysosomal membrane permeabilisation (Fig. 4, E and
F). Together, our results indicate that TRPM2-mediated Ca2+ entry stimulates lysosomal
membrane permeabilisation. These findings are important from a pathophysiological
perspective because lysosomal membrane permeabilisation is linked to various human
diseases, including vascular diseases (44).
Although lysosomal membrane permeabilisation led to the loss of lysosomal Zn2+, we found
an increase in mitochondrial Zn2+, rather than in cytoplasmic Zn2+. Inhibition of lysosomal
-induced increase in mitochondrial Zn2+ (Fig. 5, A and B; fig. S9, A and B) indicating
mobilisation of lysosomal Zn2+to mitochondria. Although how this transfer occurs remains to
be investigated, mitochondria have several transport mechanisms, such as the mitochondrial
Ca2+uniporter (38), to facilitate Zn2+uptake. Regardless of how Zn2+enters mitochondria, we
did not see mitochondrial fragmentation in the absence of an increase in mitochondrial Zn2+.
Thus, our results indicate that, by raising the mitochondrial Zn2+, TRPM2-mediated
lysosomal membrane permeabilisation causes mitochondrial fission.
A critical step in mitochondrial fission is the recruitment of Drp-1 from the cytoplasm to
mitochondria (8, 9, 16). Accordingly, high glucose increased the recruitment of
heterologously expressed Drp-1-GFP to mitochondria (Fig. 6, A and B). Moreover, inhibition
of TRPM2 channels and hence of lysosomal membrane permeabilisation or chelation of Zn2+
prevented Drp-1-GFP recruitment (Fig. 6, A and B), suggesting that mobilisation of
lysosomal Zn2+to mitochondria is essential for mitochondrial fission. The importance of Zn2+
was confirmed by the robust recruitment of Drp-1-GFP to mitochondria by direct delivery of
Zn2+ through Zn-PTO (Fig. 6, E and F). Together, our data indicate that during oxidative
stress, TRPM2-mediated mobilisation of lysosomal Zn2+ to mitochondria promotes Drp-1
recruitment and subsequent mitochondrial fragmentation.
In summary, we described a signalling pathway by which oxidative stress causes
mitochondrial fragmentation (fig. S10). We showed that plasma membrane TRPM2 channels
responded to oxidative stress to generate Ca2+signals, which induced lysosomal membrane
permeabilisation leading to the mobilisation of lysosomal Zn2+ to mitochondria, where Zn2+
promotes Drp-1 recruitment and mitochondrial fission. For Drp-1 to catalyse fission, ER
tubules need to wrap around and pre-constrict the mitochondria. In this study, we found that
in addition to the ER, plasma membrane and lysosomes play crucial roles in transmitting
oxidative stress signals to mitochondria. Thus our study illustrates how the interplay between
various organelles, in conjunction with Ca2+ and Zn2+ signals, regulates mitochondrial
dynamics. Furthermore, our study raises several questions. First, how is lysosomal Zn2+
mobilised to mitochondria? Does it require close proximity of lysosomes to mitochondria?
Second, what is the molecular route through which Zn2+ enters mitochondria? Third, how
does Zn2+ promote mitochondrial Drp-1 recruitment? Does Zn2+influence post-translational
modifications of Drp-1 (8, 9, 18) required for its recruitment to mitochondria? Or does it affect
other aspects of mitochondrial fission, such as ER-assisted constriction (20) or the
recruitment of dynamin-2 (46)?. Notwithstanding these questions, given the growing
recognition that abnormal mitochondrial fragmentation is a recurring theme in the
may have translational potential for age-related illnesses in which mitochondrial dynamics
plays a crucial role.
MATERIALS AND METHODS
Reagents and plasmid constructs
LysoTracker® Red DND-99, MitoTracker® Red CMXROS, Opti-MEM®, Pluronic®F127,
Fura-2-AM, Fluo-4-AM and Fluozin3™-AM, Hoechst 33342, H2DCFDA and Lipofectamine®
2000 were purchased from Life Technologies™. DAPI
(4,6-diamidino-2-phenylindole)-Fluoromount-G™ was purchased from Southern Biotech. Human TRPM2-siRNA
(ON-TARGETplus Human TRPM2 (7226)) was from Thermo Scientific. TRPM2 siRNA-2 (5 - GAAAGAAUGCGUGUAUUUUGUAA -3 ) was custom-made by Dharmacon. Scrambled
siRNA was from Ambion (4390846). SiRNA for Drp-1 (Cat no. S1I02661365,
5’-CAGGAGCCAGCTAGATATTAA-3’), Fis-1 (Cat. No. SI04356751
5’-AAGGCCATGAAGAAAGATGGA-3’) and MFF (Cat no. SI04320386,
5’-AACGCTGACCTGGAACAAGGA-3’) were from Qiagen . All other chemicals were either
from Sigma-Aldrich® or Calbiochem. Stock solution of zinc pyrithione was prepared by
mixing aqueous solution of ZnCl2 with pyrithione made up in ethanol. pMito-Cherry was
constructed from pECFP-Mito (Clontech). Drp-1-GFP clone containing shRNA to
knock-down the endogenous Drp-1, and its dominant negative (K38A) version (22), was a kind gift
from Dr S Strack, University of Iowa.
Isolation of lung endothelial cells
Mice were killed by cervical dislocation. Lung microvascular endothelial cells (lung ECs)
were isolated from 8-10 week old wild-type (C57BL/6) and TRPM2 knock-out (TRPM2 KO)
male mice by immunoselection with anti-CD146 antibody coated magnetic beads (Miltenyi
Biotec) according to the protocol described previously (47). Generation of TRPM2 KO mice
has been described (31). Mice were bred and maintained under UK Home Office licence and
ethical procedure.
Cell culture and transfections
Freshly isolated lung endothelial cells and human umbilical vein endothelial cells (HUVECs;
Lonza) were grown in the EGM-2 medium ((Endothelial cell Basal Medium-2 (EBM-2)
supplemented with endothelial growth supplements (Lonza)). The medium was changed
every 24 and 48 hr for lung endothelial cells and HUVECs respectively. For experiments,
lung endothelial cells were seeded onto 1:500 fibronectin (F114, Sigma) coated coverslips
grown in the EGM-2 medium. HUVECs were used within passage 3-6. HEK293 cells
expressing tetracycline-inducible human TRPM2 (HEK293-TRPM2tet cells) (31) were
cultured in Dulbecco’s modified Eagle medium (DMEM with GlutaMAX, Invitrogen)
supplemented with 10% foetal bovine serum (Sigma), 50 units/ml penicillin, and 50 µg/ml
streptomycin, 200 µg/ml Zeocin and 0.4 µg/ml blasticidin (InvivoGen). To induce TRPM2
expression, cells were incubated for 48 hr with 1 µg/ml tetracycline. All cells were grown at
37ºC under 5% CO2and humidified atmosphere.
HUVECs were grown on FluoroDishTM dishes to 50-70% confluency. Cells were transfected
with Drp1-GFP or pMito-Cherry using Lipofectamine 2000. Where appropriate
co-transfections were performed with 25 nM human TRPM2 siRNA or scrambled siRNA.
Medium was replaced 7 hr after transfection, and incubation continued for 48 to 72 hr during
which cells were treated as required before imaging.
Immunostaining
For immunostaining experiments, cells were grown on coverslips. Following the desired
treatments (see figure legends), cells were washed with PBS, fixed with 2% PFA (10 min)
and permeabilised with 0.25% Triton X-100/10 mM Tris/150 mM NaCl, pH7.4 (5 min).
Nonspecific binding sites were blocked with 1% ovalbumin/PBS for 1 hr before incubation for
2 hr with rabbit antibody against CD31 (1:300; Abcam) diluted in 1% ovalbumin/PBS. After
washing thrice with PBS, cells were incubated in the dark with Alexa Fluor488 conjugated
donkey antibody against rabbit IgG (1:500; Life Technologies) diluted in 1% ovalbumin/PBS.
After washing, cover slips were mounted onto microscope slides in DAPI-Fluoromount-G
and imaged.
Intracellular Zn2+redistribution
Intracellular distribution of Zn2+ was assessed by live imaging after staining the cells with
FluoZin-3 for Zn2+ and organelles with vital stains (31). HUVECs grown on FluoroDishTM
dishes were washed with EBM-2 medium and incubated at 37C for 4 hr in the dark in
EBM-2 containing 1 µM FluoZin-3-AM and 0.0EBM-2% (w/v) Pluronic F-1EBM-27. Cells were then washed
twice (15 min each) with EBM-2 and incubated at 37C for 30 min with organelle marker
dyes: MitoTracker Red CMXROS (200 nM) or LysoTracker Red DND-99 (200 nM) diluted in
EBM-2. After washing with EBM-2, cells were imaged. HEK-293 cells were similarly loaded,
but using the relevant medium.
To examine the effect of glucose, HUVECs were incubated in EGM-2 (5.6 mM glucose) or
EGM-2 containing 33 mM glucose, or 5.6 mM glucose plus 27.4 mM mannitol for 42 hr at
media as described above. The total incubation time including all steps was 48 hr. For
ionophore mediated Zn2+ loading, cells were incubated in EGM-2 or EGM-2 containing 0.7
µM ZnCl2plus 0.5 µM pyrithione for 2 hr at 37C, prior to washing and loading FluoZin-3-AM
(2 hr) and organelle markers. Where appropriate, cells were co-treated with TRPM2 channel
inhibitors or metal chelators, or pre-transfected with siRNA (see relevant figure legends for
details). Images were captured at 37ºC using Zeiss LSM700 confocal microscope fitted with
a 63× oil objective. Co-localisation of Zn2+ fluorescence and organelle fluorescence was
determined using the Imaris software.
Mitochondrial fragmentation
Morphology of mitochondria was assessed from images of cells stained with MitoTracker
Red or transfected with p-Mito-Cherry. Aspect ratio (ratio between the major and minor axis)
and form factor (degree of branching) were determined using NIH ImageJ 1.44p from
individual mitochondria after reducing nonspecific noise of the fluorescence signal as
reported previously (48). Form foctor is defined as ((Perimeter2)/(4 *Area)). Mitochondrial
morphology measurements were made from over 70 individual mitochondria of cells
sampled from from 3 independent experiments. Mitochondria were counted as fragmented if
the form factor was below 2.5. A cell is considered as its mitochondria fragmented when ≥
50% of its total number of mitochondria is fragmented (49).
Drp-1 recruitment to mitochondria
To examine high glucose-induced Drp-1 recruitment to mitochondria, cells were transfected
with Drp1-GFP or DN-Drp1 (K38A)-GFP with and without human TRPM2 siRNA or
scrambled siRNA. 48 hrs post-transfection, cells were incubated in EGM-2 or EGM-2
containing desired additives for a further 24 hr period. Cells were then stained with
MitoTracker Red, washed and imaged in EBM-2 for Drp1-GFP and MitoTracker Red.
ROS measurement
Total ROS was determined by staining cells with the H2DCFDA reagent. Cells grown in a 96
well plate were treated or not treated (control) with the test substances (see relevant figure
legends). They were then incubated with 10 µM H2DCFDA diluted in EBM-2 for 30 min at
37˚C followed by three washes with EBM-2. Cells were imaged using EVOS®FLCell Imaging System (Life technologies) fitted with a 40× lens. Images were analysed with Image
J software. The results were expressed as the mean fluorescence intensity/cell.
Image acquisition and analysis
Images were collected with a LSM700 Zeiss inverted laser scanning confocal microscope
emission) was excited with a diode laser at 405 nm, fitted with a 420-440 nm emission filter.
MitoTracker Red, LysoTracker Red, Mito-Cherry (548 nm excitation, 562 nm emission) were
excited using a He-Ne laser fitted with 543 nm filters. Alexa Fluor488and FluoZin-3 (494 nm
excitation, 519 nm emission) were excited with an Argon laser at 488 nm, fitted with a
500-530 nm emission filter. Images were acquired with ZEN lite 2011 and analysed using Image
J/Imaris software. Some images were collected using iSIM (instant Structured Illumination
Microscope) fitted with a Olympus Water Immersion Objective 60x/1.2 NA Uplsapo 60xw,
and 488 nm and 561 nm lasers(39).
Intracellular Ca2+measurements
Intracellular changes in [Ca2+] were monitored using Fura-2-AM (30). HUVECs grown in 96
well plates, were incubated with Fura-2-AM (2 µM) in SBS containing 0.02% Pluronic F-127
for 1 hr at 37°C. After washing twice with SBS (10 mM HEPES, 130 mM NaCl, 1.2 mM KCl,
8 mM glucose, 1.5 mM CaCl2, 1.2 mM MgCl2, pH 7.4) for 30 min, 200 µl of SBS was added
to each well. Fluorescence was recorded using the Flexstation® II multi-mode microplate
reader (Molecular Devices, California, USA). Fluorescence was measured at 5-10 s intervals
using excitation wavelengths of 340 and 380 nm and an emission wavelength of 510 nm for
Ca2+. After taking several control measurements, 50 l of the desired reagents made up at
5-fold the required final concentration were added to wells. Ratio of fluorescence intensities at
340 and 380 nm (F340/F380) was calculated. For imaging cells were loased with Fluo-4-AM
(1 µM) and images were collected with EVOS®FLCell Imaging System (Life technologies).
Data analysis
Co-localisation analysis was performed using the Imaris software (Bitplane). Image J was
used for quantification of mitochondrial morphology, Zn2+ uptake by mitochondria and ROS
levels. All experiments were performed at least 3 times (n) and the values presented as
mean ± SEM; n/N in figure legends indicate the number of independent experiments (n) over
the number of cells (N) analysed. Statistical significance was assessed using the Student’st
-test or One-way Anova, followed by Tukey post-hoc -test. Probability (P) values are indicated
with , , , which correspond to values of 0.05, 0.01, 0.001 and 0.0001
respectively.
SUPPLEMENTARY MATERIALS
Fig. S1 TRPM2 channels mediate mitochondrial fragmentation.
Fig. S2 SOCE channels do not contribute to high glucose-induced mitochondrial
Fig. S3 Genetic deficiency of TRPM2 prevents high glucose-induced mitochondrial
fragmentation in endothelial cells of intact aorta.
Fig. S4 Zn2+chelation prevents H
2O2-induced mitochondrial fragmentation.
Fig. S5 Ca2+ and Zn2+ ionophores induce mitochondrial fragmentation independently of
TRPM2.
Fig. S6 Activation of TRPM2 channels reduces the number of lysosomes.
Fig. S7 H2O2-induced lysosomal permeabilization and release of cathepsin B.
Fig. S8 Extracellular Zn2+ does not contribute to the H
2O2-induced increase in mitochondrial
Zn2+and mitochondrial fragmentation.
Fig. S9 H2O2-induced increase in mitochondrial Zn2+is TRPM2 dependent.
Fig. S10 Signaling cascade associated with oxidative stress-induced mitochondrial
fragmentation.
REFERENCES AND NOTES
1. M. Brownlee, Biochemistry and molecular cell biology of diabetic complications.
Nature414, 813-820 (2001); published online EpubDec 13 (10.1038/414813a).
2. A. D. Deshpande, M. Harris-Hayes, M. Schootman, Epidemiology of diabetes and diabetes-related complications. Phys Ther 88, 1254-1264 (2008); published online EpubNov (10.2522/ptj.20080020).
3. E. Orgel, S. D. Mittelman, The links between insulin resistance, diabetes, and cancer.
Curr Diab Rep 13, 213-222 (2013); published online EpubApr
(10.1007/s11892-012-0356-6).
4. C. J. Rhodes, Type 2 diabetes-a matter of beta-cell life and death? Science 307, 380-384 (2005); published online EpubJan 21 (10.1126/science.1104345).
5. D. Mathis, L. Vence, C. Benoist, beta-Cell death during progression to diabetes.
Nature414, 792-798 (2001); published online EpubDec 13 (10.1038/414792a).
6. B. B. Lowell, G. I. Shulman, Mitochondrial dysfunction and type 2 diabetes. Science 307, 384-387 (2005); published online EpubJan 21 (10.1126/science.1104343). 7. Y. Yoon, C. A. Galloway, B. S. Jhun, T. Yu, Mitochondrial dynamics in diabetes.
Antioxidants & redox signaling 14, 439-457 (2011); published online EpubFeb 1
(10.1089/ars.2010.3286).
8. S. L. Archer, Mitochondrial dynamics--mitochondrial fission and fusion in human diseases. N Engl J Med 369, 2236-2251 (2013); published online EpubDec 5 (10.1056/NEJMra1215233).
9. J. R. Friedman, J. Nunnari, Mitochondrial form and function. Nature 505, 335-343 (2014); published online EpubJan 16 (10.1038/nature12985).
10. M. A. Kluge, J. L. Fetterman, J. A. Vita, Mitochondria and endothelial function.
Circulation research 112, 1171-1188 (2013); published online EpubApr 12
(10.1161/CIRCRESAHA.111.300233).
11. A. J. Molina, J. D. Wikstrom, L. Stiles, G. Las, H. Mohamed, A. Elorza, G. Walzer, G. Twig, S. Katz, B. E. Corkey, O. S. Shirihai, Mitochondrial networking protects beta-cells from nutrient-induced apoptosis. Diabetes 58, 2303-2315 (2009); published online EpubOct (10.2337/db07-1781).
contributes to endothelial dysfunction in diabetes mellitus. Circulation 124, 444-453 (2011); published online EpubJul 26 (10.1161/CIRCULATIONAHA.110.014506). 13. H. F. Jheng, P. J. Tsai, S. M. Guo, L. H. Kuo, C. S. Chang, I. J. Su, C. R. Chang, Y.
S. Tsai, Mitochondrial fission contributes to mitochondrial dysfunction and insulin resistance in skeletal muscle. Mol Cell Biol 32, 309-319 (2012); published online EpubJan (10.1128/MCB.05603-11).
14. P. M. Rappold, M. Cui, J. C. Grima, R. Z. Fan, K. L. de Mesy-Bentley, L. Chen, X. Zhuang, W. J. Bowers, K. Tieu, Drp1 inhibition attenuates neurotoxicity and
dopamine release deficits in vivo. Nat Commun 5, 5244
(2014)10.1038/ncomms6244).
15. J. Rehman, H. J. Zhang, P. T. Toth, Y. Zhang, G. Marsboom, Z. Hong, R. Salgia, A. N. Husain, C. Wietholt, S. L. Archer, Inhibition of mitochondrial fission prevents cell cycle progression in lung cancer. FASEB J 26, 2175-2186 (2012); published online EpubMay (10.1096/fj.11-196543).
16. E. Schrepfer, L. Scorrano, Mitofusins, from Mitochondria to Metabolism. Molecular cell61, 683-694 (2016); published online EpubMar 3 (10.1016/j.molcel.2016.02.022). 17. J. Zhao, J. Zhang, M. Yu, Y. Xie, Y. Huang, D. W. Wolff, P. W. Abel, Y. Tu,
Mitochondrial dynamics regulates migration and invasion of breast cancer cells.
Oncogene32, 4814-4824 (2013); published online EpubOct (10.1038/onc.2012.494).
18. R. J. Youle, A. M. van der Bliek, Mitochondrial fission, fusion, and stress. Science 337, 1062-1065 (2012); published online EpubAug 31 (10.1126/science.1219855). 19. T. Yu, S. S. Sheu, J. L. Robotham, Y. Yoon, Mitochondrial fission mediates high
glucose-induced cell death through elevated production of reactive oxygen species.
Cardiovasc Res 79, 341-351 (2008); published online EpubJul 15
(10.1093/cvr/cvn104).
20. J. R. Friedman, L. L. Lackner, M. West, J. R. DiBenedetto, J. Nunnari, G. K. Voeltz, ER tubules mark sites of mitochondrial division. Science 334, 358-362 (2011); published online EpubOct 21 (10.1126/science.1207385).
21. G. M. Cereghetti, A. Stangherlin, O. Martins de Brito, C. R. Chang, C. Blackstone, P. Bernardi, L. Scorrano, Dephosphorylation by calcineurin regulates translocation of Drp1 to mitochondria. Proceedings of the National Academy of Sciences of the
United States of America 105, 15803-15808 (2008); published online EpubOct 14
(10.1073/pnas.0808249105).
22. A. M. Slupe, R. A. Merrill, K. H. Flippo, M. A. Lobas, J. C. Houtman, S. Strack, A calcineurin docking motif (LXVP) in dynamin-related protein 1 contributes to mitochondrial fragmentation and ischemic neuronal injury. The Journal of biological
chemistry 288, 12353-12365 (2013); published online EpubApr 26
(10.1074/jbc.M113.459677).
23. N. Takahashi, D. Kozai, R. Kobayashi, M. Ebert, Y. Mori, Roles of TRPM2 in oxidative stress. Cell calcium 50, 279-287 (2011); published online EpubSep (10.1016/j.ceca.2011.04.006).
24. A. Sumoza-Toledo, R. Penner, TRPM2: a multifunctional ion channel for calcium signalling. The Journal of physiology 589, 1515-1525 (2011); published online EpubApr 1 (10.1113/jphysiol.2010.201855).
25. B. A. Miller, J. Y. Cheung, TRPM2 protects against tissue damage following oxidative stress and ischaemia-reperfusion.The Journal of physiology594, 4181-4191 (2016); published online EpubAug 1 (10.1113/JP270934).
26. C. M. Hecquet, M. Zhang, M. Mittal, S. M. Vogel, A. Di, X. Gao, M. G. Bonini, A. B. Malik, Cooperative interaction of trp melastatin channel transient receptor potential (TRPM2) with its splice variant TRPM2 short variant is essential for endothelial cell apoptosis. Circulation research 114, 469-479 (2014); published online EpubJan 31 (10.1161/CIRCRESAHA.114.302414).
pharmacology 143, 186-192 (2004); published online EpubSep (10.1038/sj.bjp.0705914).
28. J. Li, R. M. Cubbon, L. A. Wilson, M. S. Amer, L. McKeown, B. Hou, Y. Majeed, S. Tumova, V. A. Seymour, H. Taylor, M. Stacey, D. O'Regan, R. Foster, K. E. Porter, M. T. Kearney, D. J. Beech, Orai1 and CRAC channel dependence of VEGF-activated Ca2+ entry and endothelial tube formation.Circulation research 108, 1190-1198 (2011); published online EpubMay 13 (10.1161/CIRCRESAHA.111.243352). 29. T. Yu, J. L. Robotham, Y. Yoon, Increased production of reactive oxygen species in
hyperglycemic conditions requires dynamic change of mitochondrial morphology. Proceedings of the National Academy of Sciences of the United States of America 103, 2653-2658 (2006); published online EpubFeb 21 (10.1073/pnas.0511154103). 30. F. Li, N. Abuarab, A. Sivaprasadarao, Reciprocal regulation of actin cytoskeleton
remodelling and cell migration by Ca2+ and Zn2+: role of TRPM2 channels. Journal
of cell science 129, 2016-2029 (2016); published online EpubMay 15
(10.1242/jcs.179796).
31. P. T. Manna, T. S. Munsey, N. Abuarab, F. Li, A. Asipu, G. Howell, A. Sedo, W. Yang, J. Naylor, D. J. Beech, L. H. Jiang, A. Sivaprasadarao, TRPM2 mediated intracellular Zn2+ release triggers pancreatic beta cell death. The Biochemical
journal466, 537-546 (2015); published online EpubJan 6 (10.1042/BJ20140747).
32. P. Yu, Q. Wang, L. H. Zhang, H. C. Lee, L. Zhang, J. Yue, A cell permeable NPE
caged ADP-ribose for studying TRPM2. PLoS One 7, e51028
(2012)10.1371/journal.pone.0051028).
33. S. L. Sensi, P. Paoletti, A. I. Bush, I. Sekler, Zinc in the physiology and pathology of the CNS. Nat Rev Neurosci 10, 780-791 (2009); published online EpubNov (10.1038/nrn2734).
34. J. R. Hom, J. S. Gewandter, L. Michael, S. S. Sheu, Y. Yoon, Thapsigargin induces biphasic fragmentation of mitochondria through calcium-mediated mitochondrial fission and apoptosis.J Cell Physiol212, 498-508 (2007); published online EpubAug (10.1002/jcp.21051).
35. Q. Shen, K. Yamano, B. P. Head, S. Kawajiri, J. T. Cheung, C. Wang, J. H. Cho, N. Hattori, R. J. Youle, A. M. van der Bliek, Mutations in Fis1 disrupt orderly disposal of defective mitochondria. Mol Biol Cell 25, 145-159 (2014); published online EpubJan (10.1091/mbc.E13-09-0525).
36. I. Kukic, S. L. Kelleher, K. Kiselyov, Zn2+ efflux through lysosomal exocytosis prevents Zn2+-induced toxicity. Journal of cell science 127, 3094-3103 (2014); published online EpubJul 15 (10.1242/jcs.145318).
37. P. Boya, K. Andreau, D. Poncet, N. Zamzami, J. L. Perfettini, D. Metivier, D. M. Ojcius, M. Jaattela, G. Kroemer, Lysosomal membrane permeabilization induces cell death in a mitochondrion-dependent fashion. The Journal of experimental medicine 197, 1323-1334 (2003); published online EpubMay 19 (10.1084/jem.20021952). 38. L. M. Malaiyandi, O. Vergun, K. E. Dineley, I. J. Reynolds, Direct visualization of
mitochondrial zinc accumulation reveals uniporter-dependent and -independent transport mechanisms. Journal of neurochemistry 93, 1242-1250 (2005); published online EpubJun (10.1111/j.1471-4159.2005.03116.x).
39. A. Curd, A. Cleasby, K. Makowska, A. York, H. Shroff, M. Peckham, Construction of an instant structured illumination microscope. Methods 88, 37-47 (2015); published online EpubOct 15 (10.1016/j.ymeth.2015.07.012).
40. E. Smirnova, L. Griparic, D. L. Shurland, A. M. van der Bliek, Dynamin-related protein Drp1 is required for mitochondrial division in mammalian cells. Mol Biol Cell 12, 2245-2256 (2001); published online EpubAug (
41. G. Szabadkai, A. M. Simoni, K. Bianchi, D. De Stefani, S. Leo, M. R. Wieckowski, R. Rizzuto, Mitochondrial dynamics and Ca2+ signaling. Biochimica et biophysica acta
1763, 442-449 (2006); published online EpubMay-Jun
42. X. J. Han, Y. F. Lu, S. A. Li, T. Kaitsuka, Y. Sato, K. Tomizawa, A. C. Nairn, K. Takei, H. Matsui, M. Matsushita, CaM kinase I alpha-induced phosphorylation of Drp1 regulates mitochondrial morphology.The Journal of cell biology182, 573-585 (2008); published online EpubAug 11 (10.1083/jcb.200802164).
43. P. Boya, G. Kroemer, Lysosomal membrane permeabilization in cell death.
Oncogene 27, 6434-6451 (2008); published online EpubOct 27
(10.1038/onc.2008.310).
44. H. Appelqvist, P. Waster, K. Kagedal, K. Ollinger, The lysosome: from waste bag to potential therapeutic target. J Mol Cell Biol 5, 214-226 (2013); published online EpubAug (10.1093/jmcb/mjt022).
45. U. Repnik, M. Hafner Cesen, B. Turk, Lysosomal membrane permeabilization in cell death: concepts and challenges. Mitochondrion 19 Pt A, 49-57 (2014); published online EpubNov (10.1016/j.mito.2014.06.006).
46. J. E. Lee, L. M. Westrate, H. Wu, C. Page, G. K. Voeltz, Multiple dynamin family members collaborate to drive mitochondrial division. Nature 540, 139-143 (2016); published online EpubOct 31 (10.1038/nature20555).
47. J. Li, B. Hou, S. Tumova, K. Muraki, A. Bruns, M. J. Ludlow, A. Sedo, A. J. Hyman, L. McKeown, R. S. Young, N. Y. Yuldasheva, Y. Majeed, L. A. Wilson, B. Rode, M. A. Bailey, H. R. Kim, Z. Fu, D. A. Carter, J. Bilton, H. Imrie, P. Ajuh, T. N. Dear, R. M. Cubbon, M. T. Kearney, K. R. Prasad, P. C. Evans, J. F. Ainscough, D. J. Beech, Piezo1 integration of vascular architecture with physiological force.Nature 515, 279-282 (2014); published online EpubNov 13 (10.1038/nature13701).
48. W. J. Koopman, S. Verkaart, H. J. Visch, F. H. van der Westhuizen, M. P. Murphy, L. W. van den Heuvel, J. A. Smeitink, P. H. Willems, Inhibition of complex I of the electron transport chain causes O2-. -mediated mitochondrial outgrowth. American
journal of physiology. Cell physiology 288, C1440-1450 (2005); published online
EpubJun (10.1152/ajpcell.00607.2004).
49. K. Trudeau, A. J. Molina, S. Roy, High glucose induces mitochondrial morphology and metabolic changes in retinal pericytes. Investigative ophthalmology & visual
science52, 8657-8664 (2011); published online EpubNov 07 (10.1167/iovs.11-7934).
ACKNOWLEDGMENTS
We thank Dr M. Ludlow and Dr G. Howell, University of Leeds, for advice with data analysis
using Imaris/ImageJ software. We thank Dr A. Curd and Dr R Hughes, University of Leeds,
for advice with iSIM, and Dr S Strack, University of Iowa, for providing Drp-1-GFP clone.
FUNDING
This work was supported by the British Heart Foundation (PG/10/68/28528) and King Saud
bin Abdulaziz University for Health Sciences, Ministry of Higher Education for Saudi Arabia
for a studentship (NA).
AUTHOR CONTRIBUTIONS
A.S. and N.A. conceived the study. A.S., N.A., J.L. and L.-HJ. designed the experiments.
N.A. performed the experiments. N.A. and T.M. analyzed the data. N.A. and A.S. wrote the
manuscript.
The authors declare that they have no competing interests.
FIGURE LEGENDS
Fig. 1. Inhibition of TRPM2 channels prevents high glucose-induced mitochondrial
fragmentation. (A) HUVECs expressing mitochondria-targeted mito-Cherry protein were
incubated with Endothelial Cell Growth Medium-2 (EGM2) (CTRL, 5.6 mM), or EGM2
supplemented with mannitol (27.4 mM) or high glucose (27.4 mM) for 24 hrs. Where
indicated, cells were co-transfected with siRNA or treated with 37.5 µM 2-APB.
Representative confocal images are shown; scale bar, 10 µm. Boxed regions are magnified
in the lower panels. Scale bar, 5 µm. (B) Plots of form factor against aspect ratio calculated
from the images in A. (C-D) Mean ± SEM of aspect ratio (C) and form factor (D) calculated
from the data in (A), analysed as in (B); n=3 independent experiments, N=9 cells in total. (E)
Mean ± SEM of percent cells displaying mitochondrial fragmentation determined from data in
(A); n = 3 independent experiments, N=130 cells in total. (F) ROS production in HUVECs
following the treatments as in (A). Cells were stained with H2DCF-DA (DCF) and mean ±
SEM of fluorescence per cell are presented; n = 3 independent experiments, N = 180 cells in
total. (G) Representative confocal images of HUVECS exposed to high glucose with and
without the ROS scavenger NAC. (H) Mean ± SEM of percent cells displaying mitochondrial
fragmentation determined from the data in (G); n=3 independent experiments, N=70 cells in
total. Statistical analysis was performed by one-way ANOVA with Tukey’s post-hoc test. *p
<0.05, **P< 0.01, ***P< 0.001, and ****P< 0.0001. NS, not significant.
Fig. 2. Knock-out of TRPM2 channels prevents high glucose-induced mitochondrial
fragmentation in mouse pulmonary endothelial cells. (A toF) Effect of high glucose on
mitochondrial fragmentation of primary endothelial cells isolated from wild-type (WT) mice (A
to C) or TRPM2 knock-out (TRPM2 KO) mice (D to F). Cells were incubated with 5.6 mM
glucose (CTRL), mannitol (27.4 mM) or high glucose (27.4 mM) for 72 hrs and stained with
MitoTracker Red (red, mitochondria), rabbit antibodies against CD31 (green, endothelial
cells) and DAPI (nuclei, blue). (A and D) show representative images; scale bar, 10 µM.
Boxed regions in the merged images are expanded in the bottom panels; scale bar, 5 µm. (B
and E) Plots of form factor against aspect ratio calculated from the images in (A) and (D)
respectively. (C and F) Mean ± SEM of aspect ratio and form factor calculated from data
analysed as in (B) and (E) respectively; (n=3 independent experiments; cells from 2-3 mice
were pooled for each experiment); N=9 cells in total. (G) Comparison of aspect ratio and
form factor of mitochondria of endothelial cells isolated from WT and TRPM2 KO mice,
one-way ANOVA with Tukey’s post-hoc test. *p <0.05, **P < 0.01, and ***P < 0.001. NS, not
significant.
Fig. 3. High glucose-induced mitochondrial fragmentation is mediated by Zn2+. (A)
Representative images of the effect of the Zn2+ chelator TPEN (0.3 M) on HUVECs
expressing mito-Cherry and incubated with 5.6 mM glucose (CTRL) or high glucose (33 mM
glucose). (BandC) Mean ± SEM of form factor (B) and aspect ratio (C) calculated from the
data in (A); n=3 independent experiments, N=9 cells in total. (D) Mean ± SEM of percent
cells showing mitochondrial fragmentation, calculated from the data in (A), n = 3
independent experiments, N=130 cells in total. (E) Representative images of the effect of
delivering Zn2+ through pyrithione (Zn-PTO: 0.7 µM Zn2+: 0.5 µM pyrithione) on HUVECs
expressing mito-Cherry, in the presence or absence of TPEN (0.3 µM). (F) Mean ± SEM of
percent cells showing mitochondrial fragmentation, calculated from the data in (E), n = 3
independent experiments, N=170 cells in total. (G) A23187 (1 µM) application, shown with a
horizontal bar, causes an increase in cytosolic Ca2+ (Ca2+
i). (H) Mean ± SEM of change in
Ca2+ fluorescence calculated from the data in (G), n=3 independent experiments. (I)
Representative confocal images of cells treated with vehicle (CTRL) or A23187 (1 µM) and
stained for Ca2+. (J) Representative confocal images of HUVECs treated with vehicle (CTRL)
or 1 µM A23187 for the indicated times and stained for mitochondria, in the presence or
absence of TPEN (0.3 µM). (K) Mean ± SEM of percent cells showing mitochondrial
fragmentation, calculated from the data in (J); n = 3 independent experiments, N=170 cells in
total. In representative confocal images, scale bar = 10 µm; in images in which boxed
regions are expanded, scale bar = 5 µm. Statistical analysis was performed by one-way
ANOVA with Tukey’s post-hoc test (B to D, F and K) or Students t-test (H); *p <0.05, **P <
0.01 and ***P< 0.001. NS, not significant.
Fig. 4. High glucose induces lysosomal membrane permeabilisation through TRPM2
mediated Ca2+rise.(A) Representative confocal images of HUVECs incubated with 5.6 mM
glucose (CTRL), mannitol (27.4 mM) or high glucose (27.4 mM) for 24 hours and stained for
Zn2+ (FluoZin-3; green) and lysosomes (LysoTracker Red, red). (B) Mean ± SEM of the
percentage of LysoTracker Red-positive lysosomes per cell, calculated from the data from
(A), n=3 independent experiments; N = 100 cells in total. (C) HEK293-TRPM2tet were not
induced (-Tet) or induced (+Tet) with tetracycline before exposure to H2O2(200 µM, 90 min)
and staining for lysosomes. (D) Mean ± SEM of the percentage of LysoTracker Red-positive
lysosomes per cell, calculated from the data from (C), n=3 independent experiments; N =
100 cells in total. (E) Representative confocal images of cells exposed to EGM2 alone or
EGM2 supplemented with 1 µM A23187 for 2 or 4 hrs before staining with LysoTracker Red.
calculated from the data in (E) (n =3 independent experiments; N = 100 cells in total). (G)
HUVECs transfected with scrambled siRNA or TRPM2-siRNA were treated with A23187 for
4 hrs and stained as in (E). Mean ± SEM percentage of LysoTracker Red-positive lysosomes
per cell from 3 independent experiments is shown; N = 100 cells in total. In representative
confocal images, scale bar = 10 µm; in images in which boxed regions are expanded, scale
bar = 5 µm. Statistical analysis was performed by one-way ANOVA with Tukey’s post-hoc
test. *p<0.05, **P< 0.01 and ***P< 0.001. NS, not significant.
Fig. 5. High glucose increases mitochondrial Zn2+ and fragmentation through TRPM2
channel activation. (A) HUVECs were incubated with 5.6 mM glucose (CTRL), mannitol
(27.4 mM) or high glucose (27.4 mM) for 24 hours and stained for Zn2+ (FluoZin-3; green)
and mitochondria (MitoTracker Red, red). Representative confocal images are shown; scale
bar, 10 µm. Boxed regions in the merged images are magnified in the far right panels. Scale
bar, 5 µm. (B) Mean ± SEM of percent localisation of Zn2+with mitochondria calculated from
the data in (A). N=3 independent experiments. CTRL, 155 cells; Mannitol, 91 cells; high
glucose, 119 cells; scrambled (Scr) siRNA, 108 cells; siRNA-TRPM2, 148 cells. (C)
Percentage of cells showing mitochondrial fragmentation, calculated from the data in (A), n =
3 independent experiments, N=160 cells in total. Statistical analysis for B and C was
performed by one-way ANOVA with Tukey’s post-hoc test, *p <0.05, **P < 0.01 and ***P <
0.001. (D) iSIM images of HUVECs showing localization of Zn2+ in mitochondria following
high glucose and H2O2-induced stress. HUVECs expressing Mito-Cherry were treated with
high glucose (33 mM, 24 hrs) or H2O2(200 µM, 2 hrs) before staining for Zn2+with FluoZin-3.
Representative images (n = 3 independent experiments) are shown; scale bar = 10 µM.
Fig. 6. High glucose-induced TRPM2 activation and rise in Zn2+ promotes
mitochondrial Drp-1 recruitment. (A) Representative confocal images of HUVECs
transfected with Drp-1-GFP or dominant negative (DN)-Drp1-GFP and incubated with 5.6
mM glucose (CTRL), mannitol (27.4 mM) or high glucose (27.4 mM) for 24 hours. TPEN (0.3
µM) was included as indicated. (
B
) Mean ± SEM of percentage co-localization of GFP withMitoTracker Red calculated from the data in (A); n=3 independent experiments; N= 50 cells
in total. (C) Representative iSIM fluorescent images of mitochondrial fragmentation in
HUVECs co-transfected with pMitoCherry and siRNA targeting Drp1, Fis-1 and/or MFF and
exposed to high glucose for 48 hrs. (
D
) Mean ± SEM data for percent cells withmitochondrial fragmentation from experiments performed as in (C); n = 3 independent
experiments, N = 60 cells in total. (E) Representative confocal images of HUVECs
transfected with Drp-1-GFP or DN-Drp1-GFP, treated with Zn-PTO for 1 hr and stained for
calculated from the data in (E); n=3 independent experiments; N=50 cells in total. In
representative confocal images scale bar = 10 µm. Statistical analysis was performed by
CTRL Mannitol si-TRPM2 High Glucose (HG)
2-APB Scr siRNA Expanded A B
0 3 6 9 12 0 3 6 9 12 Form Factor Aspect Ratio CTRL
0 3 6 9 12 0 3 6 9 12 Aspect Ratio Form Factor Mannitol
0 3 6 9 12 0 3 6 9 12 Aspect Ratio Form Factor HG
0 3 6 9 12 0
3 6 9
12 HG + 2-APB
Aspect Ratio
Form Factor 0 3 6 9 12
0 3 6 9 12 Aspect Ratio Form Factor HG +siRNA-TRPM2
0 3 6 9 12 0 3 6 9 12 Aspect Ratio Form Factor HG +Scr siRNA
E
0 30 60 90
% Cells with mitochondrial
fragmentation -+ -+ -+ -+ -+ + -+ -+ -Mannitol High Glucose Scr siRNA siRNA-TRPM2 2-APB -*** **** **** NS **** 0 2 4 6 Form Factor Mannitol High Glucose Scr siRNA siRNA-TRPM2 2-APB -+ -+ -+ -+ -+ + -+ -+ -** * NS D C 0 1 2 3 4 5 Aspect Ratio Mannitol High Glucose Scr siRNA siRNA-TRPM2 2-APB -+ -+ -+ -+ -+ + -+ -+ -* NS **** 0.00 0.04 0.08 0.12 0.16 NS *** DCF fluorecence/cell Mannitol High Glucose + - - + F
Fig. 1
High Glucose NAC G 0 20 40 60 80 100 ***% Cells with mitochondrial
[image:24.442.32.406.42.589.2]5 10 15 0 3 6 9 12 Form Factor Aspect Ratio
TRPM2 WT : HG
0 5 10 15
0 3 6 9 12 Aspect Ratio Form Factor
TRPM2 WT : Mannitol
0 5 10 15
0 3 6 9 12 Aspect Ratio Form Factor
TRPM2 WT : CTRL B
0 5 10 15
0 3 6 9 12 Aspect Ratio Form Factor
TRPM2 KO : Mannitol
0 5 10 15
0 3 6 9 12 Aspect Ratio Form Factor
TRPM2 KO : CTRL
0 5 10 15
0 3 6 9 12 Aspect Ratio Form Factor
TRPM2 KO : HG E
F
CTRL MAN HG 0 1 2 3 4 Aspect Ratio TRPM2 KO NS NS
CTRL MAN HG 0
2 4 6
8 TRPM2 KO
[image:25.442.28.414.81.599.2]CTRL TPEN HG A Expanded TPEN 0 30 60 + + Glucose TPEN
% Cells with mitochondrial
fragmentation + -*** 0 2 4 6 Form Factor + + Glucose TPEN + -* 0 2 4 Aspect Ratio + + HG
TPEN +
-**
B C D
Zn-PTO
TPEN
E
Expanded
TPEN
50 100 150 200
1.5 1.8 2.1 A23187 Ca 2+ i [F ratio] Time (Sec) CTRL
1 mM A23187
0 20 40 60 80 100 ****
% Cells with mitochondrial
fragmentation Zn-PTO TPEN - + + - + + **** F 0.0 0.2 0.4 0.6
A23187 - +
D Ca
2+ i [F]
*** H G A23187 CTRL I 0 20 40 60 80 100 4h 4h ******* **** + + + -+ -A23187 TPEN
% Cells with mitochondrial
fragmentation -NS 2h J K
Fig. 3
Expanded CTRL A231872 hr 4 hr
TPEN
[image:26.442.24.412.67.551.2]0 20 40 60 80 100 120 ** % L ysoT racker Red positive vesicles/cell + +
A23187
-* *** 2h 4h F 0 30 60 90 120 150 180 * -+ -+ -+ + -+ -+ -% L ysoT racker positive vesicles/ cell Mannitol High glucose Scr siRNA siRNA TRPM2 -* NS FluoZin-3 LysoTracker Merge
Mannitol CTRL Scr siRNA siRNA -TRPM2 HG
A Expanded B
-Tet CTRL H2 O2 DIC +Tet C D Expanded 2 h A23187 4 h E
Fig. 4
G 0 40 80 120 % L ysoT racker Red positive vesicles/cell ** NS Tetracycline O [image:27.442.31.418.68.630.2]0 10 20 30 40 50
*
% Colocalisation of FluoZin-3
with MitoT racker -+ -+ -+ + -+ -+ -Mannitol High glucose Scr siRNA TRPM2 siRNA
-*
NS FluoZin-3 MitoTracker MergeMannitol CTRL Scr siRNA TRPM2 siRNA High Glucose
A Expanded B
Fig. 5
0 10 20 30 40 50 60 *** ***% Cells with
mitochondrial fragmentation Mannitol High Glucose Scr siRNA TRPM2 siRNA + -- -- + + + + -- -- -- -- + NS *** C CTRL High Glucose
H2O2
Mitocherry LysoTracker Merge
[image:28.442.52.392.101.564.2]0 10 20 30
% Co-localisation of GFP
with MitoT racker -DN
***
***
Zn-PTO + +
Drp1-GFP F B 0 10 20 30
% Co-localisation of GFP
with MitoT racker ** ** ** DN Drp1-GFP -+ -+ -+ -+ -+ -+ + -+ -+ -Mannitol Glucose Scr siRNA siRNA-TRPM2 TPEN
-** MitoTracker/Drp1-GFP
Zn
-PT
O MitoTracker/ DN-Drp1-GFP
E
Expanded
Expanded
Fig. 6
Scr
siRNA siRNA Drp-CTRL High Glucose C 1 Fis-1/MFF Si RNA 0 20 40 60 80 100 ******
% Cells with
mitochondrial fragmnetation - - - - + + + -High Glucose Scr siRNA Drp-1 siRNA Fis1/MFF siRNA - + + + + *** *** D MitoT racker / DN -Drp1 -GFP High Glucose
CTRL Mannitol siRNAScr siRNA-TRPM2
[image:29.442.36.408.72.545.2]Fig. S1. TRPM2 channels mediate mitochondrial fragmentation.(A) Demonstration of silencing of TRPM2 mRNA expression by RNAi. Lanes 1-3: RT-PCR products from mRNA isolated from untransfected HUVECs (lane 1) or HUVECs transfected with scrambled (negative control) siRNA (lane 2) or siRNA targeted to TRPM2 (lane 3). The TRPM2 band (lane 3) is absent in TRPM2 siRNA transfected samples, but not scrambled siRNA controls (lane 2); n=2 independent experiments. (B) Demonstration of RNAi silencing of TRPM2 by calcium imaging. Cells transfected with scrambled siRNA or siRNA targeted to the TRPM2 channel were loaded with Fura-2-AM and the effect of 3 mM H2O2application (shown with horizontal bar) on Ca2+rise was recorded using FlexStation II. n=3
independent experiments. (C) Inhibition of TRPM2 channels prevents H2O2-induced mitochondrial
fragmentation. HUVECs were transfected with pMito-Cherry (mitochondrial marker) and incubated with 1 mM H2O2for 3 hr at 37°C in the presence and absence of a non-specific TRPM2 blocker (37.5
M 2-APB). Cells were co-transfected with pMito-Cherry and scrambled siRNA or siRNA targeted to
TRPM2 channels before exposing to 1 mM H2O2for 3 hr at 37°C. Representative confocal images are
shown. Scale bar, 10 µm. Boxed regions are magnified in the lower panels. Scale bar, 5 µm. (D) Mean ± SEM of aspect ratio and form factor calculated from experiments performed as in C; n = 3 independent experiments; N = 9 total number of cells. (E) Mean ± SEM of percent cells displaying mitochondrial fragmentation determined from data in C, n = 3 independent experiments, N=100 total number of cells. (F) HEK293-TRPM2tetcells were either not induced (+tetracycline) or induced (-tetracycline) to express TRPM2 channels with tetracycline. Cells were incubated with standard buffered saline (SBS) alone (CTRL) or 200 µM H2O2in SBS for 90 min and then labelled with
Fig. S3. Genetic deficiency of TRPM2 prevents high glucose-induced mitochondrial
fragmentation in endothelial cells of intact aorta.Slices of aortas isolated from wild-type (TRPM2
WT) and TRPM2 knock-out (TRPM2 KO) mice were stainedin situfor mitochondria with