A STUDY ON IRON STATUS & THYROID
FUNCTION : ? MUTUAL RELATIONSHIP IN
HYPOTHYROIDISM
Dissertation submitted for
M.D. BIOCHEMISTRY
BRANCH – XIII DEGREE EXAMINATION
THE TAMILNADU DR.M.G.R.MEDICAL UNIVERSITY
CHENNAI – 600 032
TAMILNADU
BONAFIDE CERTIFICATE
This is to certify that this dissertation work entitled “A STUDY ON IRON STATUS & THYROID FUNCTION : ? MUTUAL RELATIONSHIP IN HYPOTHYROIDISM” is the original bonafide work done by Dr. K.S.GOKILAVENI, Post Graduate Student, Institute of Biochemistry, Madras Medical College, Chennai under our direct supervision and guidance.
Prof. Dr. K.Ramadevi. MD.,.Ph.D.,, (Guide) Director & Professor,
Institute of Biochemistry, Madras Medical College, Chennai-600 003.
Dr .R. Jayanthi, MD., FRCP(Glasg) Dean ,
Madras Medical College and
DECLARATION
I, Dr. K.S.GOKILAVENI, Post Graduate , Institute of Biochemistry, Madras Medical College, solemnly declare that the dissertation titled “A STUDY ON IRON STATUS & THYROID FUNCTION : ? MUTUAL RELATIONSHIP IN HYPOTHYROIDISM” is the bonafide work done by me at Institute of Biochemistry, Madras Medical College under the expert guidance and supervision of our Director and Prof. Dr. K.RAMADEVI M.D,.Ph.D.,, Institute of Biochemistry, Madras Medical College. The dissertation is submitted to the Tamil Nadu Dr. M.G.R Medical University towards partial fulfillment of requirement for the award of M.D., Degree (Branch XIII) in Biochemistry.
Place: Chennai
SPECIAL ACKNOWLEDGEMENT
ACKNOWLEDGEMENT
The author expresses her warmest respects and profound gratitude to Dr. K. Ramadevi, M.D,.Ph.D.,, Director and Professor, Institute of Biochemistry, Madras Medical College, Chennai, for her able guidance, constant encouragement, support and valuable time but for which this dissertation could not have been made possible.
The author expresses her heartfelt gratitude to her co -guide Dr. A. Veena Juliette Assistant Professor, Institute of Biochemistry, Madras Medical College, Chennai, for her constant and valuable guidance, unfailing support, encouragement and inspiration throughout the period of her study.
The author in particular, is extremely thankful to Dr. Sripriya M.D, Institute of General Medicine & Professor Dr.Tito, Head of the department, Department of Endocrine Surgery, Rajiv Gandhi Government General Hospital, Chennai, for granting permission to obtain blood samples from the patients.
The author expresses her warm respects and sincere thanks to Dr.V.Ananthan and Dr. K.R.Minu Meenakshi Devi, Assistant Professor, Institute of biochemistry, Madras Medical College for their guidance regarding the practical issues of research which is beyond the scope of textbooks.
The author expresses her respects and sincere thanks to all other Assistant Professors Institute of Biochemistry, Madras Medical College, for their guidance and support.
The author expresses warm respects to the members of the Institutional Ethics committee for approving the study. The author is indebted to the patients and persons from whom blood samples were collected for conducting the study. The author expresses her special thanks to Biochemistry Laboratory Staff, for their timely help and cooperation during sample collection.
The author gratefully acknowledges the help rendered by Dr.S.Boobala Aravinthan M.D., for the statistical analysis of the study.
CONTENTS
SI.
NO TITLE PAGE NO.
1 INTRODUCTION 1
2 REVIEW OF LITERATURE 5
3 AIM & OBJECTIVES 42
4 MATERIALS & METHODS 43
5 STATISTICAL ANALYSIS 57
6 RESULTS 58
7 DISCUSSION 75
8 CONCLUSION 80
9 LIMITATION OF THE STUDY 82
10 FUTURE PROSPECTS 83
11 BIBLIOGRAPHY 84
ABBREVIATIONS
1. Apo - apolipoprotein2. BMR - Basal metabolic rate 3. CBC - Complete blood count 4. Cp - Ceruloplasmin
5. DIT - Diiodothyronine
6. DMT - Divalent metal transporter
7. ELISA - Enzyme linked immune sorbent assay 8. EDTA - Ethyelene diamine tetra acetic acid 9. ER - Endoplasmic reticulum
10. FeOOH - Ferric oxyhydroxide
11. FSH - Follicle stimulating hormone 12. HCG - Human chorionic gonadotropin 13. HCP - Heme carrier protein
14. Hb - Hemoglobin
15. HH - Hereditary Hemochromatosis 16. HRP - Horse radish peroxidase 17. HMP - Hexose monophosphate 18. IDA - Iron deficiency anemia 19. IRE - Iron regulatory element 20. IRP - Iron regulatory protein 21. kDa - Kilo Dalton
22. LH - Luetinising hormone 23. MIT - Mono iodo thyronine
26. PAX-8 - Paired box gene 8 27. PTH - Parathormone 28. RNA - Ribonucleic acid 29. RBC - Red blood cells
30. sTfR - Soluble transferrin receptor protein 31. TPO - Thyroid peroxidase
32. TBG - Thyroid binding globulin 33. T3 - triiodothyronine
34. T4 - Tetraiodothyronine 35. fT3 - free triiodothyronine 36. fT4 - free Tetraiodothyronine 37. TR - Thyroid receptor
38. TRH - Thyrotropin releasing hormone 39. TSH - Thyroid stimulating hormone 40. TfR - transferrin receptor
41. Tf - Transferrin
42. TIBC - Total iron binding capacity 43. TMB - Tetramethylbenzidine 44. UTR - untranslated region
1
INTRODUCTION
Thyroid diseases are common worldwide. In India also we have significant burden of thyroid diseases among which hypothyroidism is common that can be easily diagnosed and is a treatable condition. It often presents with non specific symptoms and hence diagnosed by measuring the thyroid hormone levels in blood(1). Hypothyroidism when left untreated leads to myxedema, cardiac failure, coma and death.
Thyroid hormones are very important to regulate the metabolism of human body. Hypothyroidism is a clinical entity that develops due to low level of circulating thyroid hormones. Normal thyroid hormone levels depend on many trace elements such as iron, iodine, selenium and zinc both for the synthesis and metabolism of thyroid hormones(1). Deficiencies of these elements can impair thyroid functions (2).
Among the micronutrients, iron is important for various functions of our human body. It is essential for cellular growth and differentiation, oxygen binding, transport & storage, enzymatic reactions, immune function, cognitive functions such as mental as well as physical growth. So deficiency of iron by both physiological and pathological means affects mental and physical growth resulting in decreased learning capacity and work productivity(3).
2
deficiency(4). In India prevalence of IDA (iron deficiency anemia) is around 56% (64 million girls) (5).
Iron deficiency is said to manifest due to the depletion of body’s iron stores resulting in deficient iron supply to the tissues which need iron for many of its intracellular pathways .
Iron is very intricately related to the thyroid metabolism(6). Many human and animal studies shows that iron deficiency impairs thyroid metabolism(2). Iron deficiency has been shown to affect the levels of thyroxine and triiodothyronine and peripheral conversion of T4 to T3 is also affected significantly(1).
3
On treating with thyroxine, levels of erythropoietin improves , enhancing erythropoiesis. This leads to further increased demand for iron stores ,aggravating iron deficiency(6). Also in hypothyroidism, lack of stimulation of erythroid colony development resulting in decreased level of erythropoietin will lead to the development of anemia and thus affecting iron metabolism.
This leads to a viscious cycle where iron deficiency may be a cause for hypothyroidism or hypothyroidism may cause iron deficiency anemia (6).
There are other mechanisms also by which IDA causes hypothyroidism. Studies shows that the IDA may also lower the levels of 5’deiodinase enzyme which is involved in the peripheral conversion of T4 to T3(2). There arises a question for the existence of a mutual relationship between hypothyroidism and iron deficiency anemia
4
5
REVIEW OF LITERATURE
THE THYROID GLAND
The thyroid gland is one of the important endocrine glands of the body. Main function of thyroid is to regulate the metabolism at tissue level through thyroid hormones(9).
EMBRYOLOGY OF THYROID GLAND(10)
Thyroid gland develops from the floor of pharynx . The development starts from 24th day of intrauterine life. In due course, the thyroid descends in front of the hyoid bone and laryngeal cartilages. Finally it reaches in front of trachea in the seventh week which has now acquired a small median isthmus and two lateral lobes. By the end of third month at which time the thyroid gland begins to function, the first follicle containing colloid becomes visible. Follicular cells has the colloid which acts as the source for thyroxine hormones.
6
Both fetal thyroid stimulating hormone and thyroxine are needed for the normal intrauterine development of central nervous system and skeleton(9).
ANATOMY OF THYROID GLAND(11)
The thyroid gland is a butterfly shaped structure with two lobes. The two lobes are connected by a bridge of tissue called isthmus. The thyroid gland weighs approximately 25 g. It has a rich source of blood supply mainly from thyrocervical arteries and innervations by autonomic nervous system.
The region which is concerned with thyroxine production consists of multiple acini called as follicles. Each follicle is surrounded by epithelial cells and are filled by pink proteinaceous material called colloid. The colloid is rich in thyroglobulin which is a glycoprotein. When the gland is inactive, the follicles expands and when it is active, the follicle shrinks, the colloid is actively reabsorbed into the thyrocytes. Special cells called parafollicular cells are present between the follicles which secrete calcitonin.
7
The expression of the thyroid follicle cells are mainly regulated by three nuclear transcription factors (11) :
Thyroid transcription factor 1
Thyroid transcription factor 2
Paired box gene 8 (PAX- 8)
FORMATION OF THYROID HORMONE(12)
The products secreted by thyroid glands are iodothyronines : 3,5,3’,5’ tetraiodothyronine : thyroxine T4
3,5,3’ triiodothyronine : T3 3,3’,5’ Reverse T3 : rT3
The primary hormone secreted by thyroid is thyroxine with lesser amounts of T3 and minimally reverse T3. The thyroid hormones are the iodinated forms of the amino acid tyrosine.
T3 is biologically more active than T4 as it is produced in the peripheral areas from T4 by deiodination. rT3 is not active biologically.
Substrates for thyroid hormone synthesis : 1. Iodine
8
IODINE
The dietary iodine is converted to iodide and is absorbed from the gut. The normal daily requirement of iodine is 100 to 200µg . Minimum requirement is 25 µg. Sources are drinking water, fish, cereals, vegetables and iodinated salt. It is a very scarce element and so humans have developed a complex mechanism to
utilize this element in its most suitable form.
TYROSINE
It is an aromatic semi essential amino acid which can be iodinated to form
the thyroid hormones. Thyroglobulin forms the main source for the tyrosine
residues. Thyroglobulin is the precursor of T4 and T3. It is a large iodinated,
glycosylated protein with a molecular mass of 660 kDa. It is composed of two
large subunits. It contains 115 tyrosine residues, each of which is a potential site
of iodination.
STEPS IN THYROID HORMONE SYNTHESIS (12) :
1.IODIDE TRAPPING
9
2.OXIDATION OF IODIDE :
Iodide can be oxidized to any of the three forms :
iodinium ion or
free hypoiodite or
both or a free iodine radical.
TPO enzyme uses hydrogen peroxide to oxidize the tyrosine residue to a free tyrosine radical before it starts reacting with the active iodine. The hydrogen peroxide is obtained from NADPH which is generated from the HMP pathway.
This happens at the interface between the colloid and follicle. After getting oxidized to iodine , it goes and attaches with the 3C of tyrosine residues of the thyroglobulin molecule with the help of the TPO enzyme. This process is called as organification of iodine.
3.IODINATION
Iodination of the tyrosine residues in thyroglobulin occurs first in the third position of the aromatic nucleus forming “monoiodotyrosine”. It is then iodinated at the fifth position forming “diiodotyrosine.” This is also mediated by the enzyme TPO.
4.COUPLING OF IODOTYROSINE
10
T3. Reverse T3 is formed when DIT combines with MIT. In peripheral tissues, the deiodination of the outer ring of T4 by 5’ deiodinase produces T3. The human thyroid secretes around 80µg of T4, 4 µg of T3, and 2 µg of reverse T3 per day
MODEL OF IODIDE METABOLISM IN CELL
11
TRANSPORT
About 99% of the iodothyronine (T4 and T3) is protein bound. Remaining 1% is unbound or free form. Only the protein bound form is active.
Proteins binding the thyroid hormones are: 1. Thyroxine binding globulin. (TBG)
2. Thyroxine binding prealbumin also known as “transthyretin” 3. Albumin
SIGNIFICANCE OF THYROID PEROXIDASE(13)
TPO enzyme catalyzes almost the entire metabolism of thyroid hormone synthesis. It is a hemoprotein. It requires many co factors for its functioning such as iron, selenium and zinc. The role of iron as the cofactor plays the basis for pathophysiology in our study.
METABOLISM OF THYROID HORMONES
The primary step in peripheral metabolism of thyroxine is deiodination. T4 is deiodinated in liver, kidney and many other tissues through which we get T3. Only about 13% of T3 is secreted by the thyroid gland while the remaining 87% is formed during this peripheral conversion.
Three different deiodinases are seen :D1, D2, D3 deiodinase D1 : Liver, kidneys, thyroid and pituitary
12
MECHANISM OF ACTION OF THYROID HORMONES(14) :
Thyroid hormones bind to their high affinity receptors intracellularly within the nucleus. Thyroid receptors are : TRα ,TRβ1 and TRβ2(15). When thyroid hormone binds with the intranuclear receptor, the receptor-ligand complex accumulate within the nucleus. This complex then binds to the specific DNA regulatory sequences : Hormone responsive element (11). This activates the promoter sequences and increasing the transcription followed by synthesis of more specific proteins i.e., the enzymes. Thus the biological effect occurs.T3 has ten times more affinity than T4 and is biologically more active.
REGULATION OF THYROID HORMONES(9)
Thyroid hormone secretion is regulated at three levels.
1. Hypothalamus: Thyrotropin Releasing Hormone (TRH) 2. Pituitary : Thyroid Stimulating Hormone (TSH)
3. 3.Negative feedback by the thyroid hormones.
13
THYROTROPIN RELEASING HORMONE
Thyrotropin releasing hormone is secreted by the hypothalamus. It is a tripeptide (pyro-glutamyl-histidyl-proline amide). TRH stimulates the synthesis of TSH from anterior pituitary. TRH exerts its action by binding to its receptors in the anterior pituitary. This in turn activates the second messenger system , phospholipase C which causes release of inositol triphosphate and diacyl glycerol which releases calcium thus activating protein kinases thereby promoting the release of TSH from anterior pituitary(16).
THYROID STIMULATING HORMONE :
TSH produced by anterior pituitary is also known as thyrotropin . It is a glycoprotein with a molecular weight of about 28kDa. It shares the α subunit with LH ,FSH, hCG. The β subunit is unique to these hormones. Its main function is to promote the synthesis of T4 and T3 . It is the physiological marker for thyroid hormone action.
The mechanism by which it promotes thyroid hormone synthesis are : 1. Increased proteolysis of thyroglobulin
2. Increased activity of the iodide pump 3. Increasing tyrosine iodination
4. Increasing the size as well as secretory activity of thyroid follicles.
5. Changing the thyroid cells from cuboidal to columnar thereby increasing overall secretory activity of thyroid gland mediated by cAMP (16)
14
THYROXINE and TRIIODOTHYRONINE(17)
Plasma binding proteins have high affinity for the thyroid hormones. Because of this, they are released very slowly particularly T4. Thyroxine is released every 6 days to the cells whereas T3 is released daily. The hypothalamo – pituitary- thyroid axis is responsible for the blood homeostasis of T4 and T3.
KINETICS OF THYROID HORMONE : T3 and T4
S.No. KINETIC VRIABLE T4 T3
1 Volume of distribution 1L 40L
2 Extrathyroidal pool 800 µg 54µg
3 Daily production 80 µg 30 µg
4 Fractional turnover per day 10% 60%
5 Metabolic clearance per day 1.1L 24L
6 Half life 7 days 1 day
7 Amount bound 99.96% 99.6%
8 Biological potency Less potent More potent
9 Oral absorption 75 to 90% 95%
10 Serum hormone levels
TOTAL 5 to 12 µg/dL
FREE 0.9 to 1.7ng/dL
TOTAL 80 to 220 µg/dL
15
FEEDBACK EFFECT OF THYROID HORMONES ON TRH & TSH
The day to day homeostasis of thyroid hormones is by the negative feedback on TRH & TSH. When thyroid hormone synthesis rate > 1.75 times of the normal, TSH secretion almost becomes nil. Thyroid hormones exerts its effect directly on anterior pituitary as well as on hypothalamus.
Thus excess thyroid hormone inhibits TSH and TRH and vice versa happens in case of thyroid insufficiency.
EFFECTS OF THYROID HORMONES
CELLULAR METABOLISM
Increases mitochondria Increases glucose absorption, gluconeogenesis, glycogenolysis Increases lipolysis & protein synthesis Increases the BMR
Increases O2 consumption
CARDIOVASCULAR SYSTEM
Increases cardiac output Increases heart rate Increases heart strength Increases tissue blood flow Increases respiration
CENTRAL NERVOUS SYSTEM Increases rapidity of cerebration promoting normal brain development
GROWTH Responsible for skeletal and bone
development
SEXUAL DEVELOPMENT
Lack of thyroxine in women : menorrhagia, polymenorrhea In men : lack of libido
EFFECT ON OTHER ENDOCRINE GLANDS
16
HYPOTHYROIDISM :CLASSIFICATION(18)
PRIMARY HYPOTHYROIDISM
It occurswhen a disease or treatment destroys the thyroid gland resulting in defective hormone synthesis. It can be of autoimmune origin which may be associated with goiter (hashimoto’s or goitrous thyroiditis) or at the end stage, with minimal residual tissue (atrophic thyroiditis)(16) or can be of iatrogenic which develops usually following radioiodine therapy.
SECONDARY HYPOTHYROIDISM
It is due to the disease of pituitary or hypothalamic disorders because of inadequate or absent secretion of TRH or TSH from hypothalamus or anterior pituitary correspondingly resulting in defective thyroid hormone synthesis indirectly.
SUBCLINICAL HYPOTHYROIDISM
Patients who present with bnormal T3 and T4 levels along with raised TSH levels are said to have subclinical hypothyroidism. The thyroid hormones are maintained to normal levels for sometime due to the stimulation of TSH from anterior pituitary. These patients will have very mild to no symptoms.
CLINICAL / OVERT HYPOTHYROIDISM
17
CONGENITAL HYPOTHYROIDISM (19)
Causes include: thyroid gland dysgenesis in 80 to 85 % , inborn defects in thyroid hormone synthesis in 10 to 15% , and TSH –R antibody in 5%
Study by A Hawke et al states that congenital hypothyroidism can occur due to the transplacental passage of anti thyroid peroxidase( TPO) antibodies in maternal hypothyroidism(20).
CONDITION TSH fT4 fT3
NORMAL LEVELS 0.3 TO 4.2
µIu/mL 0.9 TO 1.7 ng/dL
3.2 TO 6.8 pmol/L PRIMARY
HYPOTHYROIDISM Increased Decreased Decreased
SECONDARY
HYPOTHYROIDISM Decreased Decreased Decreased
CLINICAL FEATURES OF HYPOTHYROIDISM
Lethargy Weight gain Cold intolerance Pallor
Puffy face and hands Bradycardia
Constipation Ascites Ileus
18
IRON DEFICIENCY ANEMIA (21)
Iron deficiency anemia is the most common cause of nutritional anemia worldwide. The main function of body iron is to carry oxygen along with hemoglobin. Many cellular enzymes are dependent on iron for their action. In case of iron deficiency , electron transport and energy metabolism is affected. In RBC’s , hemoglobin synthesis is deficient resulting in poor oxygen delivery to the tissues leading to anemia. Around 20 mL of senescent RBC’s are cleared off daily and 20mg of iron is recycled for the production of new RBC’s. Since iron forms a part of hemoglobin it is highly essential for heme synthesis.
IRON CYCLE IN HUMANS
Two third of body’s iron is seen as part of hemoglobin, 15 to 30 % is stored as ferritin and hemosiderin. Absorption of iron takes place in the duodenum. Remaining iron is in myoglobin(21). The iron absorbed from the diet or released from the ferritin circulates in the form of transferrin. The circulatory form of iron is “transferrin ”
19
diabetes mellitus(23). Whereas increased intake of dietary iron is not a risk factor for diabetes mellitus(23).
Absorption occurs in duodenum. Regulation of iron occurs at the absorption level so “it is a one way element”. When iron stores in the body are depleted, absorption is enhanced. When adequate quantity of iron is stored, absorption is decreased. This is called mucosal block theory”(24)(25). Only ferrous form of iron is absorbed. Ferric form is reduced to ferrous form by the enzyme ferric reductase. A protein called DMT -1 carries the ferrous iron from intestinal lumen into the mucosal cell. Within the cell, ferrous is converted to ferric form which binds with apoferritin to form ferritin. Another transport protein called ferroportin then releases the iron from ferritin into the blood stream. In blood it is reoxidised to ferric state and transported by transferrin.
TRANSFERRIN
20
The turn over time for transferrin bound iron is 60 to 90 mins. It plays a main role in iron distribution because it transfers the iron from intestine to the reticuloendothelial cells, to the erythroid cells for synthesizing hemoglobin. Normally iron binding transferrin turns over at a rate of 6 to 8 times per day. The amount of iron passing through the transferrin pool is 20 to 24 mg/day(27).
TRANSFERRIN RECEPTOR(28,29)
Transferrin delivers iron to the erythroid or non erythroid cells after interacting with a special type of specific receptor known as the soluble transferrin receptor on the surface of the cell membrane. The receptor is a transmembrane protein which shows its expression in cells requiring iron. The receptor comprises two disulfide linked between cysteines monomers 89 and 98, each containing 760 aminoacids and organized into three major portions (30) :
A large C terminal extracellular domain of 671 aminoacids
Tarnsmembrane domain with 2 amino acids
N terminal cytoplasmic domain of 61 amino acids Structure of human
21
Image showing transferrin receptor and cleavage of it to yield soluble
transferrin receptor protein
Image courtesy : “https://www.rndsystems.com/resources/articles/solube-transferrin-receptor-stfr”
Image showing cleavage of transferrin receptor to yield soluble
transferrin receptor protein
22
The receptor undergoes proteolytic cleavage by a matrix metallo proteinase between arginine -100 and leucine -101 of the extracellular domain gives off soluble transferrin receptor protein (sTfR)(31). Production of Tf receptor is regulated at the level of mRNA based on the intracellular iron content.(32). When the level of intracellular iron is low, the iron responsive element increases further facilitating the translation of RNA coding for the ferritin molecule and the reverse happens in case of increased cellular iron concentration. The receptor expression is increased in proximal small intestine especially crypts of the proliferating cells. Erythroblasts are the cells having highest number of receptors (3,00,000 to 4,00,000 /cells). The total body iron stores and the receptor expression is inversely related(33).
23
24
Image courtesy : “Marijn M. Speeckaert et al.”
SOLUBLE TRANSFERRIN RECEPTOR PROTEIN (sTfR)
25
in two lobes due to the amino acids surrounding them known as second shell(38). The distribution of the sTfR pool is 27% diferric, 23% monoferric N lobe, 11% monoferrric C lobe and 40% apo. At pH 7.4 diferric Tf binds to the TfR with nanomolar affinity. The binding of monoferric species is 40 times weaker and apo Tf did not compete for binding(38). It is encoded by human TfR gene on chromosome 3. It does not contain the cysteine residues at 89 and 98 position . The concentration of sTfR quantitated has been found to be directly proportional to the number of the transferrin receptors . Plasma sTfR reflects the receptor density on the cells and the number of cells expressing the receptors (31) .
REFERENCE RANGES (39)
The reference range of sTfR for human serum and plasma in Indian population is between 0.3 to 2.9 mg/L (40). Unlike ferritin it does not vary between sex groups(40).
26
CLINICAL CONDITIONS CAUSING ALTERED LEVELS OF sTfR
LEVELS(29)
sTfR levels
INCREASED
Due to decrease in tissue iron Iron deficiency anemia
Pregnancy
Increased erythropoiesis
Autoimmune hemolytic anemia Hereditary spherocytosis
β thalassemia/HbE HbH disease Sickle cell disease Polycythemia vera
NORMAL TO INCREASED
Idiopathic myelofibrosis Myelodysplastic syndrome Chronic lymphocytic leukemia
NORMAL
Hemochromatosis
Acute and chronic myeloid leukemia Most lymphoid malignancies
Solid tumours
Anemia of chronic disease
DECREASED
Chronic renal failure Aplastic anemia
Post bone marrow transplantation
FERRITIN (41) ,(42)
27
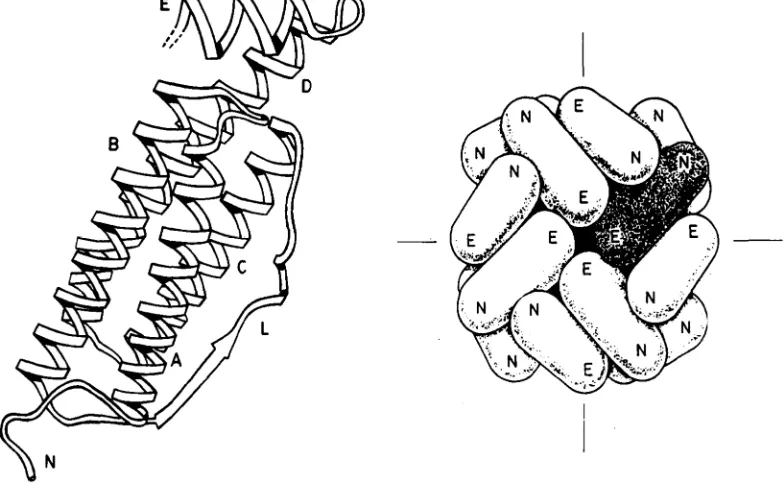
Ferritin is present both extra and intracellularly. Apoferritin forms a shell within which iron is stored in the core. Apoferrition is the iron free form and the iron containing is termed as “holoferritin or simply ferritin”(44). Ferritin has 24 protein subunits arranged in 432 symmetry to give a hollow shell with a 80A◦ diameter cavity capable of storing upto 4500 Fe(III) as inorganic complex. The shell is an apoferritin shell composing of 24 subunits which are of either Oblong (H) or light (L) chain or the interior is a ferric oxyhydroxide crystalline core (45). The shell is arranged in a way as to resemble a sphere or snubbled cube consisting of 6 facets(21). Each facet is formed by a group of 4 apoferritin monomers and a pore in the centre which is 10 A◦ diameter. The two iron binding sites are present in these pore channel(46).
28
STRUCTURE OF FERRITIN
[image:39.595.112.504.151.394.2]Image courtesy : “The structure and function of ferritin by Pauline m. Harrison”
Figure : 1” Main features are the five helices A to E and long inter helix loop , L. The loop L and the N terminal end, N lie on the outside of the protein shell. Helix E runs from the outside to the inside, so that the C-terminal end of the chain is at the inside surface of the molecule.”
29
The features of the H and L monomers of apoferritin is given below (44) :
Features H Monomer L Monomer
Molecular weight 21,000 18,500
Aminoacid composition 182 175
Chromosome location 11 19
Hydrophilic residues 7 15
Iron binding histidyl unit Present Not present
Ferroxidase site Present Not present
Nuclear site Not present Present
Iron turnover
Takes up more iron readily and retain it less
avidly
Very slow
Function More active in iron
metabolism
Long term storage function
Site Heart Major iron storage organs
mainly liver & spleen
30
PLASMA AND TISSUE FERRITIN
BIOCHEMICAL CHARACTERISTICS(48)
Plasma ferritin has a lower affinity than tissue ferritin consequently plasma ferritin has low iron content in contrast to tissue iron (48)
Migration pattern of plasma ferritin in isoelectric focusing is similar to that of apoferritin (48)
High proportion of the plasma ferritin binds to concanavallin A indicating the presence of carbohydrate (48)
Plasma ferritin is synthesized by the rough endoplasmic reticulum whereas intracellular ferritin is produced by the smooth ER.
It is said that both are encoded by different genes(49)
31
REGULATION OF FERRITIN SYNTHESIS
Ferritin is an intracellular iron storage protein whose synthesis is regulated post-transcriptionally by a mechanism that involves binding of cytoplasmic iron regulatory protein (IRP) to iron-responsive element (IRE) in the 5′ untranslated region of ferritin mRNA(50).
Iron regulatory protein-1 (IRP-1) is a cytosolic RNA-binding protein that is a regulator of iron homeostasis in mammalian cells. IRP-1 binds to RNA structures, known as iron-responsive elements, located in the untranslated regions of specific mRNAs known as iron-responsive elements (IRE) . These IRE regulates the translation or stability of these mRNAs(51) (52).
IREs are 30 nucleotide long RNA motifs that form special stem-loop structures. IREs occur in either the 3’-UTR (untranslated region) or 5’-UTR of an mRNA(52). Transcripts containing IREs include those encoding(52):
Ferritin subunits L and H (expressed in liver and heart, respectively),
which mediate iron storage.
Transferrin, which binds extracellular iron and circulates it in blood
plasma.
Transferrin receptor (expressed on plasma membrane), which controls
iron uptake into a cell by binding to iron-bound transferrin.
Ferroportin, and iron exporter expressed on the surface of gut
32
Divalent metal transporter 1 (DMT1), a ferrous iron transporter that
functions in intestinal iron absorption.
Mitochondrial aconitase
Succinate dehydrogenase
Erythroid aminolevulinic acid synthetase, which catalyses the first step
in tetrapyrrole synthesis.
Alzheimer's amyloidprecursor protein.
Inhibiting translation: IRP binding IRE within 5’-UTR of mRNA
In iron-deficient cells, the binding of an IRP to an IRE sequence found in the 5’UTR of an mRNA prevents its translation by blocking the mRNA from binding to the ribosome. In iron-replete cells, the absence of IRP binding allows these transcripts to be freely translated. Transcripts that carry IRE in their 5’-UTR include ferritin H and L subunits and aminolevulinic acid synthetase(52).
Promoting translation: IRP binding IREs within 3’-UTR of mRNA
33
In iron-replete cells, the absence of IRP binding makes these transcripts susceptible to endonuclease attack and subsequent rapid degradation. Transcripts carrying IREs in their 3’-UTR include the transferrin receptor (5 copies) and the DMT1 transporter(52).
Image courtey : “https://www.researchgate.net/figure/Illustration-of-IRP-IRE-regulatory-system’
34
HEMOSIDERIN
Insoluble, aggregated form of partially deproteinated ferritin is known as hemosiderin. It contains mainly aggregates of the FeOOH core crystals. Due to the smaller surface/volume ratio of hemosiderin , iron will be released only slowly. It has a higher iron content and slower turnover rate than ferritin. Together with ferritin it can be visualized in electron microscopy as membrane bound bodies : siderosomes derived from secondary lysosomes(21).
REFERENCE RANGE FOR SERUM FERRITIN LEVELS :
ng/mL µg/L
NEWBORN 25 to 200 25 to 200
1 MONTH 200 to 600 200 to 600
2 TO 5 MONTHS 50 to 200 50 to 200
6 MONTHS – 15 YEAR 7 to 140 7 to 140
ADULT MAN 20 to 250 20 to 250
ADULT WOMAN 20 to 200 20 to 250
IRON OVERLOAD ADULT MAN ADULT WOMAN
>400 >200
>400 >200
35
CLINICAL SIGNIFICANCE OF FERRITIN(53),(54)
Usually the level of ferritin in blood is very low. It is the most simple test for estimating the iron stores It is used to
1.To diagnose iron deficiency anemia.
Ferritin is done after evaluating hemoglobin, hematocrit using CBC and a peripheral smear . Ferritin levels are found to be low in IDA and decline even before changes in hemoglobin, red cell size and serum iron is manifested.
2. Depletion of iron stores
Serum ferritin <15µg/L indicates depletion of iron stores. The patient may or may not have anemia. This cut off is valid only for patients without any concomitant disease that may affect the ferritin levels. A normal ferritin does not exclude iron deficiency.
3.In the differential diagnosis of hypochromic microcytic anemia(55)
In hypochromic anemia not caused by iron deficiency ( thalassemia, sideroblastic anemia , tumour or infection related) ferritin level is normal or elevated but not low.
4.To monitor the response to iron therapy
36
within the normal reference range. It is mandatory to do ferritin measurements periodically.
5. Iron overload(56)
Ferritin concentration above 400µg/L is suggestive of iron overload. Further investigations are required to investigate this and the cause should be determined.
1. Hereditary hemochromatosis
2. Secondary iron overload ( secondary to repeated blood transfusion) 3. To monitor iron mobilization therapy ( deironing )
During monitoring the treatment for HH, ferritin should decrease in response to reduction in iron stores.(55) Being an acute phase reactant, ferritin is affected by chronic disease and inflammation(31) The plasma ferritin levels can be increased in various conditions as given below and can mask the iron deficiency status:
Inflammation (acute and chronic)
Significant tissue destruction
In case of hepatic cell damage such as hepatitis in which the elevated levels of ferritin makes it difficult in diagnosing hereditary hemochromatosis (HH)
37
Therapy with iron supplements
Heterophile antibodies in human serum can react with reagent immunoglobulins interfering with immunoassays.
Plasma ferritin should always be correlated with clinical and pathological findings. In hereditary hemochromatosis, ferritin is less sensitive than serum iron, TIBC and % transferrin saturation which provides the earliest indicator of HH(57). Measurement of iron in liver biopsy remains the gold standard for diagnosis.
CLINICAL CAUSES FOR CHANGE IN SERUM FERRITIN LEVELS
DECREASED INCREASED
Iron deficiency anemia Ascorbate deficiency Hypothyroidism
Fever
Acute infection Rheumatoid arthritis
Chronic inflammatory conditions Hyperferritinemia with cataracts Hereditary hemochromatosis Hodgkin’s lymphoma
Leukemia
38
STfR- FERRITIN INDEX (28) ,(58), (59), (37)
Many literatures show the evidence that a new index called sTfR /log Ferritin is an evolving tool to diagnose iron deficiency anemia with greater accuracy especially when the levels of ferritin or sTfR are inconclusive. Since there is an inverse relationship between ferritin and sTfR in iron deficiency (increase of sTfR and decrease in ferritin), the ratio between these two parameters , sTfR/log of ferritin ratio helps in improving the diagnostic accuracy of iron deficiency anemia thus strongly differentiating it from anemia of chronic disease(31). This index provides an estimate of the body iron over a wide range of normal and depleted iron stores(60). The normal reference range for the sTfR/log ferritin index in Indian population is : 0.16 to 1.8 (61).However anemia is clinically manifested when this ratio exceeds 3.1(62).
FERRITIN AND sTfR IN IRON DEFICIENCY ANEMIA
Ferritin levels are decreased in iron deficiency anemia (48). It detects the fall in iron stores at an earlier stage(48). but since it is an acute phase reactant , low ferritin levels alone may not be equivocal to diagnose iron deficiency(44).
39
The affinity of the transferrin to the receptor is dependent on the loading state of the receptor. As explained previously, majority of these receptors are located on the erythropoietic cells. The sTfR reflects the TfR level which is a measure of the body iron stores. Also in contrast to ferritin , sTfR concentration is not affected by acute phase reactions, acute liver function disorders, or malignant tumours. When iron deficiency exists, the sTfR concentration rises even before the significant decrease of hemoglobin concentration(63).
Therefore “sTfR reflects the body’s functional iron status whereas ferritin reflects the iron storage status”(63).
“In case of iron deficiency anemia , ferritin levels decrease and the sTfR levels increases.”
CONDITION sTfR LEVELS FERRITIN sTfR/log Ferritin
Iron deficiency
40
?A MUTUAL RELATIONSHIP BETWEEN IRON DEFICIENCY
ANEMIA AND HYPOTHYROIDISM : PATHOGENESIS
It has been explained elaborately that the key enzyme involved in thyroid metabolism is thyroperoxidase. This enzyme is dependent on many cofactors for its synthesis . It is a heme containing enzyme. It is highly dependent on iron (64). Thus it is obvious that iron deficiency can result in the poor performance of thyroperoxidase enzyme. This affects the synthesis of the thyroid hormones resulting in hypothyroidism.. (64,65), (7)
It is also shown that iron deficiency significantly affects efficiency of 5’ deiodinase enzyme (65).This enzyme is involved in the peripheral conversion of T4 to T3 and also decreases the TSH response to thyroid releasing hormone (TRH)(2). This is the most accepted cause for iron deficiency resulting in hypothyroidism.
Lack of stimulation of the erythroid colony development by thyroid hormones in hypothyroidism decreases the erythropoietin levels. So there is a reduction of oxygen distribution to the tissues which further affects the iron metabolism. This is one of the cause for hypothyroidism resulting in iron deficiency anemia.
41
supplementing thyroxine to hypothyroid patients with iron deficiency anemia. Because thyroxine stimulates sympathetic activity so the symptoms of sympathetic over activity may still worsen for these patients.
Also thyroxine supplementation helps in improving erythropoiesis thus erythropoietin levels increase. Increased erythropoiesis results in increased production of RBC which require still more iron in already iron deficient patients. This further increases the iron deficiency anemia. This is the second cause explaining hypothyroidism and iron deficiency anemia (67).
42
AIM & OBJECTIVES
AIM OF THE STUDY
1. To study the iron status among hypothyroid patients
2. To correlate the ferritin & soluble transferrin receptor levels along with thyroid profile in hypothyroid patients
OBJECTIVES
1. To estimate thyroid hormone levels in all the selected subjects 2. To diagnose people with hypothyroidism
3. To classify the subjects into euthyroid and hypothyroid groups
4. To assess the iron status in healthy controls and hypothyroid patients using:
Measurement of CBC Performing peripheral smear Estimation of serum ferritin levels Estimation of sTfR levels
Calculation of sTfR – Ferritin index
Which is given by the formula : sTfR/ log of ferritin
5. To classify subjects into normal and iron deficiency anemia patients
43
MATERIALS AND METHODS
The study protocol was approved by the Institutional Ethics committee of Madras Medical College, Chennai and a copy of it has been enclosed.
STUDY DESIGN
Cross sectional study
STUDY PERIOD
May 2017 to December 2018
SUBJECT SELECTION
100 subjects were selected among which 50 subjects are hypothyroid and
50 subjects were healthy euthyroid controls.
INCLUSION CRITERIA
GROUP A : CASES
1. 15 to 60 years of age
2. Newly diagnosed hypothyroid patients
3. Not treated with any thyroid medication or lipid lowering drugs
4. Ambulatory out patients attending endocrinology outpatient department. 5. Hypothyroidism is diagnosed based on the TSH, FT3 and FT4 values GROUP B : CONTROLS
44
EXCLUSION CRITERIA
1. Pregnant or lactating females 2. Patients receiving iron supplements
3. Patients receiving drugs which may affect the thyroid status 4. Patients with acute illness
5. Patients diagnosed with diabetes mellitus 6. Patients with cardiovascular disease 7. Patients with thyroid malignancies
8. Patients with associated chronic medical conditions
SAMPLE COLLECTION
45
1.ESTIMATION OF SERUM sTfR LEVELS
METHOD - Enzyme Linked Immuno Sorbent Assay (ELISA) : Sandwich using ERBA ELISA washer and Bio rad ELISA reader.
PRINCIPLE
The ELISA wells are pre coated with sTfR monoclonal antibody. Sample containing sTfR is added to the microtitre wells which is precoated with the antibody and then left for incubation. After the period of incubation , biotin conjugated anti human sTfR antibody is added and it binds to the human sTfR. Leave for incubation at 37◦C. After incubation the unbound biotin conjugated anti human sTfR is washed away during a washing step. Streptavidin –HRP is added and binds to the biotin conjugated anti human sTfR antibody. After inubation unbound Streptavidin- HRP is washed away during another washing step. Substrate solution is then added and colour develops.
The intensity of colour developed is in proportion to the amount of human sTfR. The reaction is terminated by addition of acidic stop solution and absorbance is measured at 450nm.
REAGENTS
1. Standard solution (4.8 mg/L) 2. Standard Diluent
46
6. Substrate solution A 7. Substrate solution B
8. Wash buffer concentrate (30x)
9. Biotin conjugated anti – human sTfR antibody
REAGENT PREPARATION
All reagents should be brought to room temperature before use.
WASH BUFFER
Dilute 20ml of wash buffer concentration into deionized water to yield 500ml of wash buffer. If crystals have formed in the concentrate mix gently until the crystals have completely dissolved.
STANDARD PREPARATION
2.4mg/L Standard No.5 120μl Original Standard + 120μl Standard diluents
1.2mg/L Standard No.4 120μl Standard No.5 + 120μl Standard diluents 0.6mg/L Standard No.3 120μl Standard No.4 + 120μl Standard diluent
0.3mg/L Standard No.2 120μl Standard No.3 + 120μl Standard diluent
0.15mg/L Standard No.1 120μl Standard No.2 + 120μl Standard diluents
STANDARD S5 S4 S3 S2 S1
47
S.No Concentration of std
(mg/L)
Absorbance (OD)
1. 0.15 0.090
2. 0.3 0.105
3. 0.6 0.221
4. 1.2 0.718
5. 2.4 1.488
6. 4.8 2.247
STANDARD GRAPH OF sTfR ASSAY
0 1 2 3 4 5 6
0 0.5 1 1.5 2 2.5
A b so rb a n ce O D
Concentration of std(mg/L)
48
ASSAY PROCEDURE
1) Blank well: No sample, anti sTfR antibody labeled with biotin or streptavidin-HRP is added to comparison blank well except chromogen solution A & B and stop solution while taking the same steps that follow. 2) Standard solution well:
Add 50μl standard and streptomycin-HRP 50μl (biotin antibodies have
united in advance in the standard so no biotin antibodies are added.)
3) Sample well to be tested: Add 40μl sample and then 10μl sTfR antibodies,
50μl streptavidin-HRP. Then cover it with seal plate membrane.
4) Washing: Remove the seal plate membrane carefully, drain the liquid and shake off the remaining liquid. Fill each well with washing solution. Drain the liquid after 30 seconds’ standing.
Then repeat this procedure five times and blot the plate.
Shake gently to mix them up. Incubate at 37℃ for 60 minutes.
5) Color development: Add 50μl chromogen solution A firstly to each well and then add 50μl chromogen solution B to each well as well. Shake gently
to mix them up. Incubate for 10 minutes at 37℃ away from light for color
development.
6) Stop: Add 50μl Stop Solution to each well to stop the reaction (the blue color changes into yellow immediately at that moment).
49
SENSITIVITY OF THE ASSAY
Minimum sTfR detectable limit is: 0.005mg/L.
Assay range:0.01mg/L→4mg/L.
2. ESTIMATION OF SERUM FERRITIN LEVELS
METHOD
Enzyme Linked Immuno Sorbent Assay (ELISA), non competitive sandwich performed with ERBA ELISA washer and Bio rad reader.
PRINCIPLE
Ferritin in standard and test samples are captured by anti ferritin antibody coated on microtitre wells. Then a second antibody to ferritin conjugated with horse radish peroxidase to is added which binds with the immobilized ferritin, thus forming a sandwich of ferritin antigen between two anti- ferritin antibodies. Then substrate to the enzyme horse radish peroxidase is added resulting in the formation of a coloured complex.
The intensity of colour produced is directly proportional to concentration of ferritin in the sample. The absorbance is measured at 450 nm in an automated microplate reader.
REAGENTS
50
1. Standard solution 6 vials 2. Standard Diluent
3. Control 1Ml
4. Precoated ELISA plate 5. Streptavidin HRP 6. Stop solution
7. TMB Substrate solution 8. Wash buffer concentrate (30x)
PROCEDURE :
1. All reagents and samples should be brought to room temperature. 2. Standards are ready to use.
3. Add 20µL of standard to the corresponding standard wells. Then add 20µof sample to all wells
4. Add 100 µL of conjugate to each well.
5. Cover the wells and incubate for 1 hour at room temperature(22 to 28◦C) . 6. Remove the contents from each well after incubation
7. Wash the wells 3 times with 300 µL of diluted wash solution
8. During each washing step, the plae should be shaken gentlyfor 5 seconds and remove excess solution by tapping the inverted plate on an absorbent paper towel
9. Then add 100 µL TMB substrate to each well
51
11.Then add 100 µL of stop solution 12.Shake the plate gently
Absorbance is read at 450nm against a reference wavelength of 620nm to 630nm.
SENSITIVITY OF THE KIT
The lowest detecteble concentration of ferritin that can be distinguished from the calibrator 0 is 0.04µg/L at the 95% confidence
3.ESTIMATION OF TSH METHOD
Electro chemiluminescence immunoassay(ECLIA) – sandwich assay in COBAS 6000 automated hormone analyser.
PRINCIPLE
First incubation : 50µL of sample , a biotinylated monoclonal TSH- specific antibody and a monoclonal TSH- specific antibody labeled with a ruthenium complex react to form a sandwich complex.
Second incubation : after addition of streptavidin coated microparticles, the complex becomes bound to the solid phase via interaction of biotin and streptavidin.
52
Unbound substances are then washed away. Application of a voltage to the electrode then induces chemiluminescent emission which is measured by a photomultiplier
Results are determined via a calibration curve generated by 2 point calibration
REAGENTS:
Reagents are procured from Roche diagnostics limited 1. Streptavidin coated microparticles 0.72mg/Ml 2. Biotinylated anti – TSH- mouse Antibody 2mg/L
3. Monoclonal anti-TSH antibody labeled with ruthenium complex 1.2mg/L 4. Phosphate buffer 100mmol/L
SENSITIVITY OF THE KIT
53
ESTIMATION OF fT4 METHOD
Electro chemiluminescence immunoassay(ECLIA) – competitive assay in COBAS 6000 automated hormone analyser.
PRINCIPLE
First incubation : 15µL of sample and a T4 specific antibody labeled with a ruthenium complex.
Second incubation : after addition of biotinylated T4 and streptavidin coated microparticles, the still free binding sites of the labeled antibody become occupied, with formation of an antibody-hapten complex. The entire complex becomes bound to the solid phase via interaction of biotin and streptavidin.
The reaction mixture is aspirated into the measuring cell where the microparticles are magnetically captured onto the surface of the electrode. Unbound substances are then washed away. Application of a voltage to the electrode then induces chemiluminescent emission which is measured by a photomultiplier
54
REAGENTS:
Reagents are procured from Roche diagnostics limited 1. treptavidin coated microparticles 0.72mg/Ml 2. Biotinylated T4 2.5ng/mL
3. Polyclonal anti T4 antibody labeled with ruthenium complex 75ng/mL 4. Phosphate buffer 100mmol/L
MEASURING RANGE : 0.3 to 100 ng/dL
ESTIMATION OF fT3 METHOD
Electro chemiluminescence immunoassay(ECLIA) – competitive assay in COBAS 6000 automated hormone analyser
PRINCIPLE
First incubation : 15µL of sample and a anti T3 specific antibody labeled with a ruthenium complex
Second incubation : after addition of biotinylated T3 and streptavidin coated microparticles, the still free binding sites of the labeled antibody become occupied, with formation of an antibody-hapten complex. The entire complex becomes bound to the solid phase via interaction of biotin and streptavidin
55
electrode then induces chemiluminescent emission which is measured by a photomultiplier
Results are determined via a calibration curve generated by 2 point calibration
REAGENTS:
Reagents are procured from Roche diagnostics limited 1. Streptavidin coated microparticles 0.72mg/mL 2. Biotinylated T3 2.4ng/mL
3. Monoclonal anti T3 antibody labeled with ruthenium complex 18ng/mL 4. Phosphate buffer 100mmol/L
Measuring range : 0.4 to 50 pmol/L
ESTIMATION OF HEMOGLOBIN METHOD
Sysmex automated cell counter
PRINCILPE
56
Measurement at bichromatic wavelength is to decrease the interferences like turbidity in the sample, interference by hemoglobin variants like methemoglobin and carboxyhemoglobin.
SENSITIVITY
57
STATISTICAL ANALYSIS
The data was analysed using SPSS (Statistical Package for Social Science) Version16.01. The data collected was tabulated in excel sheet and analyzed.
Continuous variables were presented as mean ± SD (standard deviation) and categorical variables were represented as frequencies and percentages.
Gender was analyzed by Chi square test.
Age, TSH, FT3, FT4, Serum ferritin, serum soluble transferrin receptor levels and calculated stfr/log ferritin ratio mean was compared between study groups by student t test.
Pearson Correlation was used to find out the relationship between variables
S. NO AGE SEX Hb in
CBC PERIPHERAL SMEAR
TSH µIu/mL T3 pmol/L T4 ng/dL FERRITIN sTfR mg/L sTfR / log ferritin
1 35 F 10.1 Microcytic hypochromic anemia 4.5 2.6 0.7 15 4.3 3.66 2 21 F 10.9 Mild microcytic hypochromic
anemia 6.6 2.8 0.8 13 4.2 3.77
3 39 M 9.8 Moderate microcytic
hypochromic anemia 25.3 2.5 0.8 12 4.2 3.89 4 18 F 10.2 Microcytic hypochromic anemia 5 2.7 0.6 11 4 3.84 5 46 M 11.4 Moderate microcytic
hypochromic anemia 44.2 2.9 0.2 14.5 4.2 3.62 6 35 F 7.4 Moderate microcytic
hypochromic anemia 100 2.1 0.1 11 3.9 3.74 7 59 M 8.2 Moderate microcytic
hypochromic anemia 17.6 2.8 0.5 6.2 3.6 4.54 8 53 F 8.6 Moderate microcytic
hypochromic anemia 33.8 2.5 0.3 7.3 3.9 4.52 9 35 F 9.3 Mild microcytic hypochromic
anemia 100 2.6 0.3 10.3 3.2 3.16 10 34 M 10 Mild microcytic hypochromic
anemia 23.5 2.7 0.6 12.3 3.4 3.12 11 32 F 7.6 Moderate microcytic
hypochromic anemia 4.7 2.9 0.4 15 3.8 3.23 12 38 F 11.5 Mild microcytic hypochromic
anemia 65.2 2.6 0.5 12.3 3.6 3.30 13 42 F 8.9 Moderate microcytic
hypochromic anemia 77.1 2.3 0.3 10.3 3.2 3.16 14 43 M 9 Mild microcytic hypochromic
anemia 6.5 2.3 0.6 9.9 3.6 3.62 15 54 F 10.2 Mild microcytic hypochromic
anemia 10.2 2.1 0.7 14.3 3.9 3.38 16 56 F 9.3 Mild microcytic hypochromic
anemia 79.1 2.6 0.5 11.6 3.8 3.57 17 38 M 10 Mild microcytic hypochromic
anemia 6.8 2.6 0.4 8.7 3.2 3.41 18 38 F 8.2 Moderate microcytic
hypochromic anemia 77.2 2.6 0.6 15.2 3.9 3.30 19 34 F 10.5 Mild microcytic hypochromic
anemia 100 2.5 0.7 14 3.7 3.23
20 37 F 10 Mild microcytic hypochromic
anemia 35.6 2.8 0.8 13.6 3.9 3.44 21 23 F 11 Mild microcytic hypochromic
anemia 4 3.1 0.9 469.6 0.7 0.26 22 37 F 9.3 Mild microcytic hypochromic
anemia 6 2.8 0.4 8.3 3.6 3.92
23 43 F 7.3 Moderate microcytic
hypochromic anemia 66.5 2.5 0.3 12.3 3.8 3.49 24 28 M 11 Mild microcytic hypochromic
anemia 28.3 2.3 0.8 11.6 3.3 3.10 25 29 F 9 Mild microcytic hypochromic
anemia 121 2.6 0.3 12.8 3.5 3.16 26 45 F 10.3 Mild microcytic hypochromic
anemia 53 2.9 0.5 12.5 3.5 3.19 27 48 M 9.8 Mild microcytic hypochromic
anemia 33.5 2.7 0.4 11.3 3.6 3.42 28 49 M 7.7 Moderate microcytic
S. NO AGE SEX Hb in
CBC PERIPHERAL SMEAR
TSH µIu/mL T3 pmol/L T4 ng/dL FERRITIN sTfR mg/L sTfR / log ferritin
29 46 M 8.6 Moderate microcytic
hypochromic anemia 8.7 4.6 0.5 12.6 3.6 3.27 30 28 M 7.3 Moderate microcytic
hypochromic anemia 4.6 5.6 0.4 15.9 3.9 3.25 31 36 F 8.9 Moderate microcytic
hypochromic anemia 17.6 1.9 0.5 12.9 3.9 3.51 32 35 F 11.1 Mild microcytic hypochromic
anemia 15 2.9 0.3 10.8 3.2 3.10 33 23 F 8.8 Moderate microcytic
hypochromic anemia 18.2 2.9 0.7 11.3 4 3.80 34 43 F 11.1 Mild microcytic hypochromic
anemia 36 2.8 0.3 12.6 3.9 3.54 35 33 F 12.8 Mild microcytic hypochromic
anemia 16.9 1.9 0.5 13.7 4 3.52 36 36 F 9.6 Moderate microcytic
hypochromic anemia 10.2 2 0.6 11.9 4.3 4.00 37 37 F 7.7 Moderate microcytic
hypochromic anemia 4.9 2.1 2.9 12.3 3.8 3.49 38 35 F 7.2 Megaloblastic anemia 13.3 2.8 0.8 15.5 3.3 2.77 39 44 F 11.2 Megaloblastic anemia 14.3 2 0.3 10.2 3.6 3.57 40 40 F 11.2 Mild microcytic hypochromic
anemia 32 2.5 1.1 12.2 3.5 3.22 41 41 F 11.3 Mild microcytic hypochromic
anemia 121 2.6 0.5 11.1 3.4 3.25 42 18 F 10 Moderate microcytic
hypochromic anemia 6.8 2 0.2 12.1 3.4 3.14 43 20 F 12.1 Mild microcytic hypochromic
anemia 5.6 2.3 0.6 13.9 3.6 3.15 44 19 F 9.5 Moderate microcytic
hypochromic anemia 12.3 2.6 0.6 11.6 3.7 3.48 45 42 F 12.2 Mild microcytic hypochromic
anemia 5.8 2.8 0.5 13.1 3.3 2.95 46 38 M 11.1 Mild microcytic hypochromic
anemia 4.8 2.3 0.4 11.1 3.3 3.16 47 41 F 12.3 Mild microcytic hypochromic
anemia 4.1 2.1 0.5 12.1 3.4 3.14 48 58 F 11.1 Mild microcytic hypochromic
anemia 6.8 2 0.5 11.6 3.8 3.57
49 40 F 12.1 Mild microcytic hypochromic
anemia 11.2 2.2 0.3 12.3 3.5 3.21 50 37 M 12.8 Mild microcytic hypochromic
S. NO AGE SEX Hb in
CBC PERIPHERAL SMEAR
TSH µIu/mL T3 pmol/L T4 ng/dL FERRITIN sTfR mg/L sTfR / log ferritin
1 29 F 13.1 Normal study 4.2 5.9 1.5 49 2.1 1.24 2 19 F 12.8 Normal study 4 5.5 1.6 417 2 0.76 3 55 F 12.9 Normal study 4.3 4.5 1.4 137 2 0.94 4 35 F 13 Normal study 4.1 3.5 1.1 43.7 0.5 0.30 5 38 M 13 .1 Normal study 4.1 3.7 1.3 451.1 1.1 0.41 6 36 F 14.6 Normal study 4.1 4.6 1.1 241.13 1.5 0.63 7 48 M 13.6 Normal study 4.1 3.8 1.4 97.5 0.9 0.45 8 28 F 13.8 Normal study 3.9 3.2 1.1 74.2 1 0.53 9 32 F 13.9 Normal study 0.8 5 1.5 83.1 1 0.52 10 33 F 13.2 Normal study 3.9 5.2 0.9 33.2 1.2 0.79 11 52 M 13.4 Normal study 4 5.7 0.5 33.2 1.8 1.18 12 43 F 12.9 Normal study 2.4 3 1.6 109.5 1.5 0.74 13 39 F 13.9 Normal study 1.5 5.1 1.1 62.1 1.4 0.78 14 35 M 14 Normal study 2.2 5.2 1.1 78.1 1.2 0.63 15 46 F 13.7 Normal study 2.9 4.5 1.5 138 0.9 0.42 16 21 F 14.3 Normal study 1.7 3.9 0.9 147 0.9 0.42 17 32 M 15.3 Normal study 2.1 5.2 1.2 458.1 0.8 0.30 18 42 F 13.3 Normal study 1.5 2.8 0.9 392.6 1.1 0.42 19 22 F 14.8 Normal study 2.8 5.3 1.2 112.6 1.6 0.78 20 40 F 13.2 Normal study 2.5 4.2 1.1 584.3 0.3 0.11 21 46 M 15 Normal study 3.8 6.5 0.9 696 0.6 0.21 22 31 F 12.9 Normal study 4.1 6 1.2 715 1.4 0.49 23 39 F 13 Normal study 0.9 4.2 1.1 36.4 1 0.64 24 32 F 13.6 Normal study 1.3 3.9 1.2 25.3 1.2 0.86 25 28 F 13.8 Normal study 1.8 5.2 0.9 111.6 1 0.49 26 36 F 14 Normal study 2 4.3 1.5 128 1.1 0.52 27 38 M 16 Normal study 2.6 5.7 1.6 122.6 1.1 0.53 28 42 F 13.5 Normal study 3.9 4.6 1 27.4 1.4 0.97 29 21 F 13.9 Normal study 3.6 4.2 1.7 60.8 1.3 0.73 30 29 F 13.2 Normal study 1.6 3.6 1.5 188.9 1.2 0.53 31 29 F 13.2 Normal study 0.9 3.9 1.5 260.4 1.3 0.54 32 56 F 13.1 Normal study 0.9 2.7 0.5 51.1 1 0.59 33 26 F 13.9 Normal study 3.5 5.5 1.5 118.5 1.5 0.72 34 32 F 14 Normal study 4 3.2 1.2 135.5 1.3 0.61 35 46 F 13.3 Normal study 3.2 5.6 1.1 30.2 3.2 2.16 36 50 F 13.6 Normal study 4.1 6.5 0.9 406 3.2 1.23 37 33 F 14 Normal study 3.3 5.2 1 18.1 3.5 2.78 38 42 F 15 Normal study 2.9 3.9 0.9 204 1.5 0.65 39 46 F 13.9 Normal study 4.1 6.2 1.5 392 1.413 0.54 40 53 F 12.9 Normal study 3.6 4.5 1.3 534.5 1.5411 0.56 41 56 F 14.1 Normal study 2.6 5.8 1.6 18.9 3.9 3.06 42 33 F 13.6 Normal study 2.1 3.6 1.2 138.3 1.17 0.55 43 31 F 14.2 Normal study 3.2 5.6 1.3 254.5 1 0.42 44 22 F 13.7 Normal study 2.8 4.3 1.6 358.7 0.7 0.27 45 27 F 14.1 Normal study 2.9 5.2 0.7 406 1.1 0.42 46 52 F 13 Normal study 2.8 3.5 1.5 125 1 0.48 47 26 F 14 Normal study 4.3 4.5 1.7 145 1.2 0.56 48 35 M 15.2 Normal study 2.5 4.5 0.9 302 1.8 0.73 49 26 M 14.8 Normal study 5.6 5.5 1.1 240 1.3 0.55 50 40 M 12.2 Relative lymphocytosis 3.9 5.1 1.41 102 2.1 1.05
58
[image:76.595.88.527.200.628.2]RESULTS
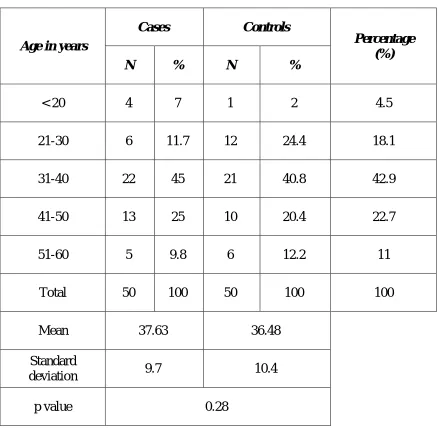
Table 1 : Distribution of study participants according to age.
Age in years
Cases Controls
Percentage (%)
N % N %
< 20 4 7 1 2 4.5
21-30 6 11.7 12 24.4 18.1
31-40 22 45 21 40.8 42.9
41-50 13 25 10 20.4 22.7
51-60 5 9.8 6 12.2 11
Total 50 100 50 100 100
Mean 37.63 36.48
Standard
deviation 9.7 10.4
p value 0.28
59
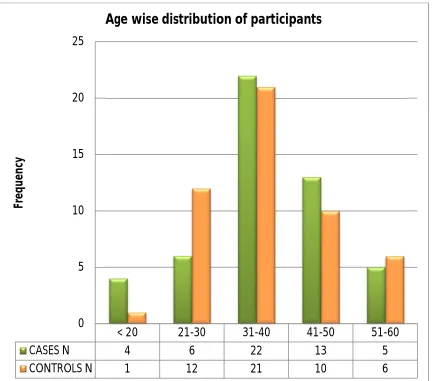
Figure 1 : Bar diagram showing the frequency of study participants according to age
< 20 21-30 31-40 41-50 51-60
CASES N 4 6 22 13 5
CONTROLS N 1 12 21 10 6
0 5 10 15 20 25
Fr
e
q
u
e
n
cy
60
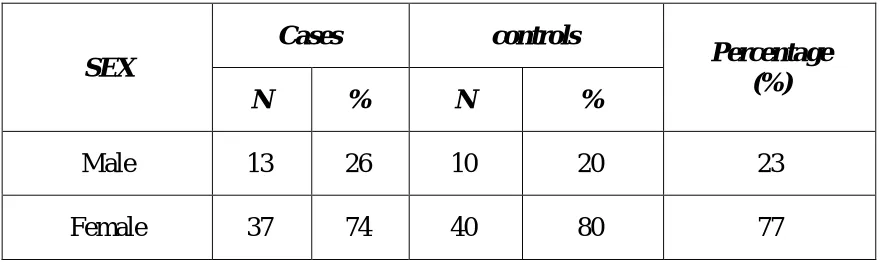
Table 2 : Distribution of study participants according to sex.
Most of the study participants were females.
Figure 2 : Bar diagram showing the frequency of study participants according to sex.
74% of the cases were females and 80 % of the controls were females. Remaining 26% cases and 20% controls were males.
26 20 74 80 0 10 20 30 40 50 60 70 80 90 % % CASES CONTROLS
Sex wise distribution of study participants
Male Female
SEX
Cases controls
Percentage (%)
N % N %
Male 13 26 10 20 23
[image:78.595.93.520.361.656.2]61
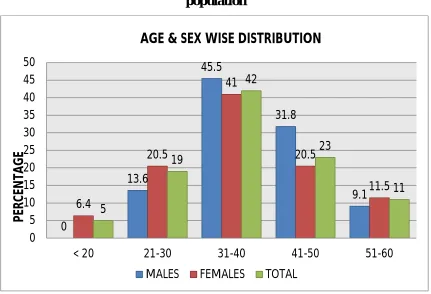
Table 3 : Age-sex wise distribution of cases and controls.
Figure 3 : Bar diagram showing the age and sex wise distribution of study population 0 13.6 45.5 31.8 9.1 6.4 20.5 41 20.5 11.5 5 19 42 23 11 0 5 10 15 20 25 30 35 40 45 50
< 20 21-30 31-40 41-50 51-60 MALES FEMALES TOTAL
AGE & SEX WISE DISTRIBUTION
P ER C EN TA G E Age
Male Female Percentage
(%)
N % N %
< 20 0 0 5 6.4 5.0
21-30 3 13.6 16 20.5 19.0
31-40 10 45.5 32 41 42.0
41-50 7 31.8 16 20.5 23.0
51-60 2 9.1 9 11.5 11.0
[image:79.595.93.524.412.706.2]62
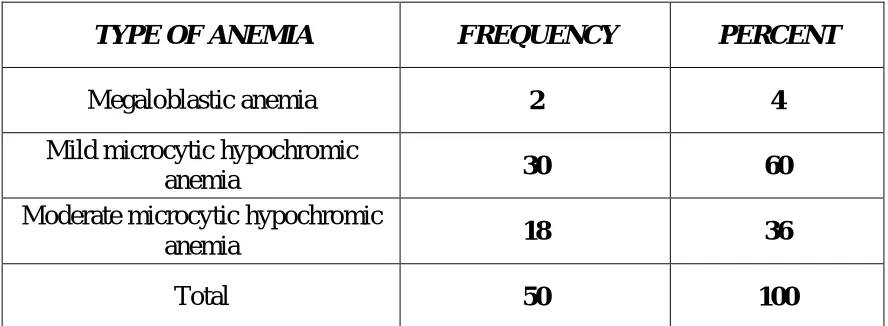
Table.4 Peripheral smear study results of cases
TYPE OF ANEMIA FREQUENCY PERCENT
Megaloblastic anemia 2 4
Mild microcytic hypochromic
anemia 30 60
Moderate microcytic hypochromic
anemia 18 36
Total 50 100
Normal peripheral smear study was observed among the control groups
Figure 4 : Bar diagram showing various types of anemia among study population.
Mild microcytic hypochromic anemia was the predominant type among the study population. 0 10 20 30 40 50 60 Megaloblastic anemia Mild microcytic hypochromic anemia Moderate microcytic hypochromic anemia 4 60 36
[image:80.595.94.519.427.666.2]63
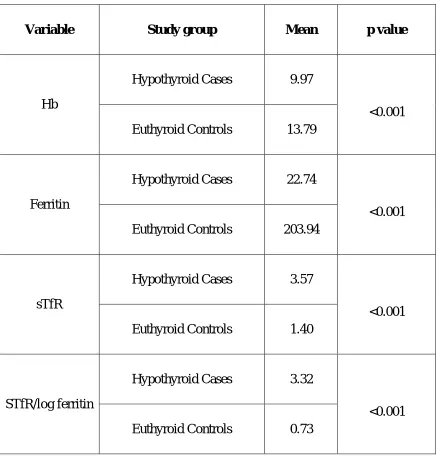
Table .6 Comparing variables used for diagnosing iron deficiency anemia between cases and controls.
Variable Study group Mean p value
Hb
Hypothyroid Cases 9.97
<0.001 Euthyroid Controls 13.79
Ferritin
Hypothyroid Cases 22.74
<0.001 Euthyroid Controls 203.94
sTfR
Hypothyroid Cases 3.57
<0.001 Euthyroid Controls 1.40
STfR/log ferritin
Hypothyroid Cases 3.32
64
Table .7 Shows the comparison between iron deficiency anemia and hypothyroidism
Iron deficiency anaemia
Hypothyroidism Present
N %
Present 43 86
Absent 7 14
Total 50 100
Among the 50 hypothyroid cases , 43 showed iron deficiency anemia. Seven cases tested negative.
Figure 5 : Bar diagram showing percentage of iron deficiency anemia among hypothyroid patients
86% of hypothyroid cases had iron deficiency anemia.
86 14 0 10 20 30 40 50 60 70 80 90 100 Present Absent