• . • • • *
• • • * •
* i . *
eurostat
eurostat
STATISTISCHES AMT DER EUROPÄISCHEN GEMEINSCHAFTEN STATISTICAL OFFICE OF THE EUROPEAN COMMUNITIES OFFICE STATISTIQUE DES COMMUNAUTÉS EUROPÉENNES
L-2920 Luxembourg — Tél. (352) 43 01-1 —Télex COMEUR LU 3423 Rue de la Loi 200, B-1049 Bruxelles — Tél. (32-2) 299 11 11
Eurostat hat die Aufgabe, den Informa-tionsbedarf der Kommission und aller am Aufbau des Binnenmarktes Beteiligten mit Hilfe des europäischen statistischen Systems zu decken.
Um der Öffentlichkeit die große Menge an verfügbaren Daten zugänglich zu machen und Benutzern die Orientierung zu erleichtern, werden zwei Arten von Publi-kationen angeboten: Statistische Doku-mente und Veröffentlichungen.
Statistische Dokumente sind für den Fachmann konzipiert und enthalten das ausführliche Datenmaterial: Bezugs-daten, bei denen die Konzepte allgemein bekannt, standardisiert und wissenschaft-lich fundiert sind. Diese Daten werden in einer sehr tiefen Gliederung dargeboten. Die Statistischen Dokumente wenden sich an Fachleute, die in der Lage sind, selbständig die benötigten Daten aus der Fülle des dargebotenen Materials auszu-wählen. Diese Daten sind in gedruckter Form und/oder auf Diskette, Magnet-band, CD-ROM verfügbar. Statistische Dokumente unterscheiden sich auch optisch von anderen Veröffentlichungen durch den mit einer stilisierten Graphik versehenen weißen Einband.
Veröffentlichungen wenden sich an eine ganz bestimmte Zielgruppe, wie zum Beispiel an den Bildungsbereich oder an Entscheidungst/äger In Politik und Ver-waltung. Sie enthalten ausgewählte und auf die Bedürfnisse einer Zielgruppe abgestellte und kommentierte Informa-tionen. Eurostat übernimmt hier also eine Art Beraterrolle.
Für einen breiteren Benutzerkreis gibt Eurostat Jahrbücher und periodische Veröffentlichungen heraus. Diese enthal-ten statistische Ergebnisse für eine erste Analyse sowie Hinweise auf weiteres Datenmaterial für vertiefende Unter-suchungen. Diese Veröffentlichungen werden in gedruckter Form und in Daten-banken angeboten, die in Menütechnik zugänglich sind.
Um Benutzern die Datensuche zu erleich-tern, hat Eurostat Themenkreise, d. h. eine Untergliederung nach Sachgebieten, eingeführt. Daneben sind sowohl die Statistischen Dokumente als auch die Veröffentlichungen in bestimmte Reihen, wie zum Beispiel „Jahrbücher", „Kon-junktur", „Methoden", untergliedert, um den Zugriff auf die statistischen Informa-tionen zu erleichtern.
Y. Franchet
It is Eurostats responsibility to use the European statistical system to meet the requirements of the Commission and all parlies involved in the development of the single market.
To ensure that the vast quantity of ac-cessible data Is made widely available, and to help each user make proper use of this information, Eurostat has set up two main categories of document: statistical documents and publications.
The statistical document is aimed at spe-cialists and provides the most complete sets of data: reference data where the methodology is well-established, stand-ardised, uniform and scientific. These data are presented in great detail. The statistical document is intended for ex-perts who are capable of using their own means to seek out what they require. The information is provided on paper and/or on diskette, magnetic tape, CD-ROM. The white cover sheet bears a stylised motif which distinguishes the statistical docu-ment from other publications.
The publications proper tend to be com-piled for a well-defined and targeted public, such as educational circles or political and administrative decision-makers. The information in these docu-ments is selected, sorted and annotated to suit the target public. In this instance, therefore, Eurostat works in an advisory capacity.
Where the readership is wider and less well-defined, Eurostat provides the infor-mation required for an initial analysis, such as yearbooks and periodicals which contain data permitting more in-depth studies. These publications are available on paper or in videotext databases. To help the user focus his research, Eurostat has created 'themes', I.e. subject classifications. The statistical documents and publications are listed by series: for example, yearbooks, short-term trends or methodology in order to facilitate access to the statistical data.
Y. Franchet Director-General
Pour établir, évaluer ou apprécier les dif-férentes politiques communautaires, la Commission européenne a besoin d'infor-mations.
Eurostat a pour mission, à travers le sys-tème statistique européen, de répondre aux besoins de la Commission et de l'en-semble des personnes impliquées dans le développement du marché unique. Pour mettre à la disposition de tous l'im-portante quantité de données accessibles et faire en sorte que chacun puisse s'orienter correctement dans cet ensem-ble, deux grandes catégories de docu-ments ont été créées: les docudocu-ments statistiques et les publications.
Le document statistique s'adresse aux spécialistes. Il fournit les données les plus complètes: données de référence où la méthodologie est bien connue, standar-disée, normalisée et scientifique. Ces données sont présentées à un niveau très détaillé. Le document statistique est des-tiné aux experts capables de rechercher, par leurs propres moyens, les données requises. Les Informations sont alors disponibles sur papier et/ou sur disquette, bande magnétique, CD-ROM. La couver-ture blanche ornée d'un graphisme stylisé démarque le document statistique des autres publications.
Les publications proprement dites peu-vent, elles, être réalisées pour un public bien déterminé, ciblé, par exemple l'enseignement ou les décideurs politi-ques ou administratifs. Des informations sélectionnées, triées et commentées en fonction de ce public lui sont apportées. Eurostat joue, dès lors, le rôle de conseil-ler.
Dans le cas d'un public plus large, moins défini, Eurostat procure des éléments nécessaires à une première analyse, les annuaires et les périodiques, dans les-quels figurent les renseignements adé-quats pour approfondir l'étude. Ces publications sont présentées sur papier ou dans des banques de données de type vidéotex.
Pour aider l'utilisateur à s'orienter dans ses recherches, Eurostat a créé les thèmes, c'est-à-dire une classification par sujet. Les documents statistiques et les publications sont répertoriés par série — par exemple, annuaire, conjonc-ture, méthodologie — afin de faciliter l'accès aux informations statistiques.
RESEARCH AND DEVELOPMENT:
ANNUAL STATISTICS 1998
Theme Research and development Seríes Yearbooks and yearly statistics
A great deal of additional information on the European Union is available on the Internet. It can be accessed through the Europa server (http://europa.eu.int).
Cataloguing data can be found at the end of this publication.
Luxembourg: Office for Official Publications of the European Communities, 1998 ISBN 92-828-4876-0
© European Communities, 1998 Printed in Luxembourg
RESEARCH AND DEVELOPMENT:
ANNUAL STATISTICS 1998
FOREWORD
The publication
Research and Development: Annual Statistics 1998
contains up-to-date statistics on R&D
and on patent applications in the European Union and the EEA. These statistics show the trends and
structure of research and development in the European Union.
As will be immediately apparent, for the 1998 edition, we have decided to produce three separate volumes,
one each for English, French and German. In this way, it is hoped that this more concise publication will be
easier for the user to find his way around.
Other changes have concentrated on improving the methodological content of the publication. It is hoped
that this will provide a greater explanation of the nuances of the data and thus a better understanding of the
data found in this publication. We hope that this edition serves our users well, both within the policy making
and scientific communities and the public at large, and that these changes will be welcomed. If you have any
comments to make on this publications, further suggestions for improvement or so on, please do not hesitate
to contact Unit A4 "Research and development, methods and data analyses" of Eurostat.
All the information in this publication is based on data supplied to Eurostat by the Member States, by DG
XII/AS/4 (Science, Research and Development - Competitivity, Economic Analysis and Indicators Unit) of the
European Commission, by the European Patent Office (EPO) and by the OECD. We should like to express
our thanks to our colleagues in the Member States (and in Iceland and Norway), the Commission Services,
EPO and the OECD for their excellent co-operation and their willingness to help meet the ever-growing
demand for information on R&D.
CONTENTS Page No.
EXECUTIVE SUMMARY 9
LIST OF ABBREVIATIONS 10
PART A: RESEARCH AND DEVELOPMENT IN EUROPE
11
Chapter 1 : GOVERNMENT BUDGET APPROPRIATIONS ON R&D - GBAORD 11
1.1. National totals 11
1.2. Socio-economic Objectives 13
Chapter 2: R&D EXPENDITURE 14
2.1. R&D expenditure at national level 14
2.2. R&D expenditure at regional level 18
Chapter 3: R&D PERSONNEL 23
3.1. R&D personnel at nationallevel 23
3.2. R&D personnel at regional level 27
Chapter 4: EUROPEAN PATENT APPLICATIONS IN THE EU 32
4.1. Patenting activities at national level 32
4.2. Regional patent activities 34
Chapter 5: SPECIFIC DEVELOPMENTS IN THE MEMBER STATES 37
Chapter 6: GLOBAL COMPARISONS 48
PART B: METHODOLOGICAL NOTES
50
Chapter 1 : DEFINITIONS AND EXPLANATORY NOTES 50
1.1. Definitions and explanatory notes relating to R&D 50
1.2. Definitions and explanatory notes relating to patent applications 53
1.3. General definitions and explanatory notes 56
Chapter 2: NOTES ON THE TABLES 57
2.1. Tables on government R&D appropriations 57
PART C: TABLES
62
GOVERNMENT R&D APPROPRIATIONS 63
Tables
1 - 4 Total 63
5 - 1 0 By chapters of NABS 68
11-12 By sub-chapters of NABS 80
13 By special fields of technology 92
R&D EXPENDITURE BY REGION 93
Tables
14 All sectors 93
15 Business enterprise sector 115
16 Government sector 137
17 Higher education sector 159
R&D PERSONNEL BY REGION 181
Tables
18 All sectors 181
19 Business enterprise sector 197
20 Government sector 213
21 Higher education sector 229
EUROPEAN PATENT APPLICATIONS BY REGION 245
Tables
22 European patent applications 245
REFERENCE DATA 279
Tables
LIST OF FIGURES
Page no.
Figure 1 : Trends in GBAORD of the EEA, 1986-96 11
Figure 2: GBAORD as a % of GDP, 1996 11
Figure 3a: Trends in GBAORD (Sweden, France, Finland, Germany, the Netherlands), 1986-96 12
Figure 3b: Trends in GBAORD (Iceland, Norway, UK, Denmark, Austria, Belgium), 1986-96 12
Figure 3c: Trends in GBAORD (Italy, Spain, Portugal, Ireland, Greece), 1986-96 12
Figure 4: GBAORD by socio-economic objective, 1996 13
Figure 5: GBAORD as a % of total central government expenditure (latest available year) 13
Figure 6: R&D expenditure expressed as a % of GDP, comparison with EEA average 14
Figure 7: R&D expenditure as a % of GDP, broken down by sector of economy (1995) 17
Figure 8: R&D expenditure as a % of GDP, comparison between sectors and countries (1995) 17
Figure 9: R&D expenditure (in million PPS at 1990 prices) by sectors of economy 18
Figure 10: R&D personnel expressed as a % of the LF, comparison with EEA average 23
Figure 11 : R&D personnel (head count) as a % of the LF, by sector of economy 25
Figure 12: R&D personnel as a % of the LF, comparisons between sectors and countries 26
Figure 13: R&D personnel (head count) by sector of economy 27
Figure 14: Evolution of EU patent applications (EPO) 32
Figure 15: Evolution of the shares of patent applications 33
Figure 16: Average annual growth rates of patent applications, 1989-96 33
LIST OF MAPS
Page no.
Map 1 : R&D expenditure 19
Map 2: R&D expenditure in the business enterprise sector 20
Map 3: R&D expenditure in the government sector 21
Map 4: R&D expenditure in the higher education sector 22
Map 5: R&D personnel 28
Map 6: R&D personnel in the business enterprise sector 29
Map 7: R&D personnel in the government sector 30
Map 8: R&D personnel in the higher education sector 31
LIST OF TABLES OF PART A
Page no.
Table 1 :
Table 2:
Table 3:
Table 4:
Table 5:
Table 6:
Table 7:
Table 8:
Table 9:
Table 10:
Table 11:
Table 12:
Table 13:
Table 14:
Ranking (number) of patent applications in 1996
Five most active patenting regions in 1996
Regional growth classifications (Patent applications per MP)
Regional disparities within Member States (Patent applications per MLF, 1996)
GBAORD in Belgium, by groups of objectives (in %)
GBAORD in Denmark, by groups of objectives (in %)
GBAORD in the Federal Republic of Germany, by groups of objectives (in %)
GBAORD in Spain, by groups of objectives (in %)
GBAORD in France, by groups of objectives (in %)
GBAORD in Ireland, by groups of objectives (in %)
GBAORD in the Netherlands, by groups of objectives (in %)
GBAORD in Austria, by groups of objectives (in %)
GBAORD in the UK, by groups of objectives (in %)
GBAORD in Norway, by groups of objectives (in %)
34
35
35
35
37
38
40
41
42
43
44
45
46
47
EXECUTIVE SUMMARY
Research and Development (R&D) is regarded as an important contribution to our well-being: it is a driving
factor behind economic growth, a source of increasing quality of products and a prime mover of
improvements in health care and environmental protection. For the development of the European Union, its
Member States and regions, R&D is therefore a key issue. This is why political decision-makers at all levels
are calling for stronger measures in support of R&D.
Putting such measures into practice requires, among other things, data which are as comprehensive,
comparable and as up to date as possible. This publication, by the Statistical Office of the European
Communities (Eurostat), attempts to meet the European-wide demand for such data, providing regional data
as far as possible for four key R&D indicators - government R&D appropriations, R&D expenditure, R&D
personnel and patents.
Government R&D appropriations are an important indicator of R&D trends. In 1996, budget appropriations in
the Member States of the European Economic Area totalled more than ECU 56,000 million, with a further
ECU 2,600 million earmarked by the European Commission. This amount is in real terms similar to 1995
although provisional figures suggest a slight decline in 1997.
As far as R&D expenditure is concerned, in 1996, approximately ECU 139,600 million was spent in the
European Union, an increase of 3.8% (and 1.8% in real terms) on 1995. This figure is equivalent to about
1.9% of the EU's gross domestic product, but well below the corresponding figures for the United States and
Japan. More than 60% was accounted for by the business enterprise sector, and the rest by the government
and higher education sectors in roughly equal proportions.
Apart from adequate funding, successful R&D activities require the deployment of qualified staff. In 1996, in
the European Union there were just over 2.1 million scientists, technicians and other R&D-related personnel,
most of them in the business enterprise sector. This figure is slightly more than in 1995 and estimates and
provisional figures suggest a small increase in 1997. R&D personnel make up approximately 1.25% of the
entire EU labour force.
For both R&D expenditure and personnel, Germany, France and the UK account for approximately two thirds.
In these countries, as in all other Member States for which data are available, there are some fairly striking
regional disparities.
LIST OF ABBREVIATIONS
A
ATS
Β
BEF
BERD
BES
Bio
CERN
CNRS
CSF
D
DEM
DG
DK
DKK
E
EC
ECU
EEA
EFTA
EL
EPC
EPO
ESA
ESP
EU/EU15
EUR11
Eurostat
F
FIM
FIN
FRF
FTE
GBAORD
GBP
GDP
GERD
GOV
GRD
GUF
HC
HES
I
IEP
ILO
IPC
IRL
IS
ISK
ITL
JPO
L
LF
LI
LUF
Austria
Austrian shilling
Belgium
Belgian franc
Business enterprise expenditure on
R&D
Business enterprise sector
Billion (=1,000 Million)
European centre for nuclear research
National centre for scientific research
Community support framework
Germany
German mark
Directorate General
Denmark
Danish kroner
Spain
European Commission
European Currency Unit
European Economic Area
European Free Trade Area
Greece
European Patent Convention
(=Munich Convention)
European Patent Office
European System of Integrated
Accounts
Spanish peseta
European Union
Euro zone
Statistical Office of the European
Communities
France
Finnish mark
Finland
French franc
Full Time Equivalent
Government budget appropriations on
R&D
Pound sterling
Gross Domestic Product
Gross Domestic Expenditure on R&D
Government sector
Greek drachma
General University Funds
Head Count
Higher education sector
Italy
Irish pound
International labour office
International Patent Classification
Ireland
Iceland
Icelandic krona
Italian lira
Japanese Patent Office
Luxembourg
Labour force
Liechtenstein
Luxembourgish franc
MLF
MP
N
NABS
NACE
NL
NLG
NOK
NUTS
OECD
OST
Ρ
PCT
PPS
PTE
R&D
S
SEK
SME
UK
USA
USPTO
No.
0
¡talies
Million labour force
Million population
Norway
Nomenclature for the Analysis and
Comparison of Scientific Programmes
and Budgets
Statistical Classification of Economic
Activities in the EC
Netherlands
Dutch guilder
Norwegian crown
Nomenclature of Territorial Units for
Statistics
Organisation for Economic Co
operation and Development
Office for Science and Technology
Portugal
Patent Cooperation Treaty
Purchasing Power Standard
Portuguese escudo
Research and Development
Sweden
Swedish krona
Small and medium sized enterprises
United Kingdom
United States of America
United States Patent and
Trademark Office
Number
Data not available
Nil
Less than fifty percent of the
indicated unit
PART A: RESEARCH AND DEVELOPMENT IN EUROPE
1.
GOVERNMENT BUDGET APPROPRIATIONS ON R&D - GBAORD
There are two ways of measuring government support for R&D. The most accurate way is to hold surveys in
order to identify the amount actually spent on R&D over the previous year and the share which was financed
by the government. However, data from this method do not become available until several years after the
R&D has been carried out. Hence a second method of measuring government support for R&D has been
devised, using data collected from the budgets. This budget based data are referred to as government
budget appropriations or outlays for R&D (GBAORD).
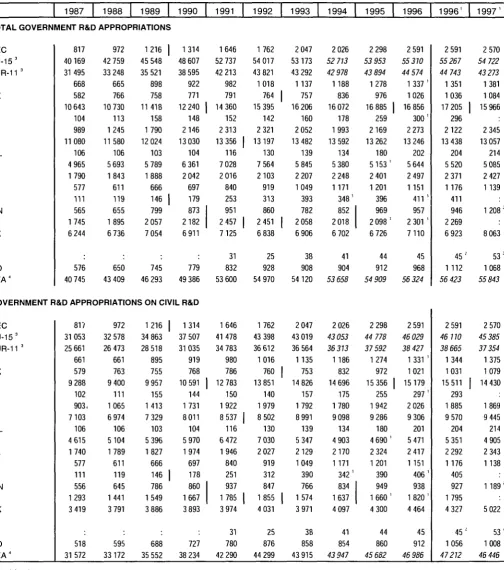
1.1.
NATIONAL TOTALS
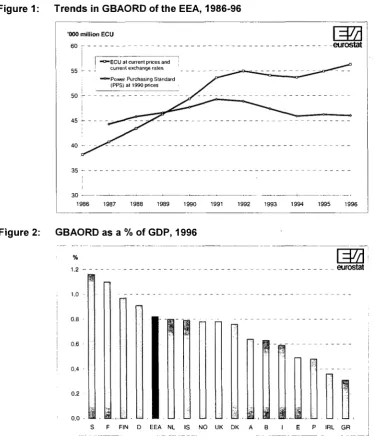
[image:13.595.52.428.312.753.2]During the last 10 years the amount of funds allocated by the EEA governments towards R&D activities have
increase substantially and in 1996, approximately 56,000 million ECU was allocated towards R&D activities.
This total represents some 47% higher than the 1986 level. However in real terms, GBAORD of the EEA
governments have increased at a low rate and reached a peak in 1991 (figure 1). Aggregate data of the EEA
hides the difference among the Member States and changes in the composition of the appropriations. There
are major disparities in the allocation of funds for R&D activities within the Member States. In 1996, Sweden
allocated 1.16% of GDP to R&D activities; in contrast, Greece allocated a mere 0.31% of its GDP (figure 2).
Figure 1: Trends in GBAORD of the EEA, 1986-96
•000 million ECU
60
30 1S 35
-1989 1990 1991 1992 1993 1994 1995 1996
Figure 2: GBAORD as a % of GDP, 1996
%
1.2 eurostat
0.2
L
Figure 3a: Trends in GBAORD (Sweden, France, Finland, Germany, the Netherlands), 1986-96
0,7 1 1 1 1 1 ' ' 1 1 1
1986 1987 1988 1989 1990 1991 1992 1993 1994 1995 1996
Figure 3b: Trends in GBAORD (Iceland, Norway, UK, Denmark, Austria, Belgium), 1986-96
%
1.2 eurostat
m
-is
-NO "UK -DK
-A -B
1986 1987 1988 19 1990 1991 1992 1993 1994 1995 1996
Figure 3c: Trends in GBAORD (Italy, Spain, Portugal, Ireland, Greece), 1986-96
1987 1988 1989 1990 1991 1992 1993 1994 1995 1996
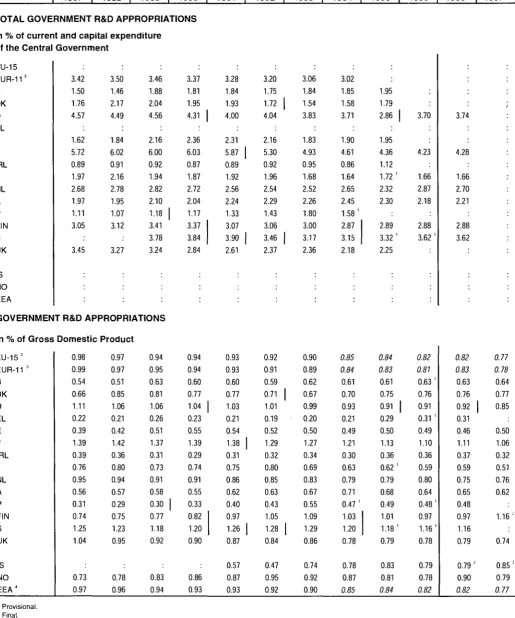
1.2.
SOCIO-ECONOMIC OBJECTIVES
Government appropriations data can be divided into a number of categories by socio-economic objectives.
Analysis of the disaggregate data reveals the priorities placed by individual governments in different
categories. Figure 4 shows the break down of R&D appropriations of the EEA governments taken together.
The largest share of R&D funds are allocated to the GUF and technological objective categories. Since the
early 90s the EEA governments have placed greater emphasis on the GUF category at the expense of the
defence category. R&D funds allocated to defence related research declined from 22% (1986) to 17%
(1996); in contrast R&D funds allocated to GUF increased from 24% (1986) to 30% (1996).
Differences between the Member States are also substantial. Most Member States allocated the largest
share of R&D funds to the GUF category. France and UK allocated the largest share to the defence category
(29.7% and 37.2% respectively). Industrial production is ranked high by the Irish and Finnish government
and in 1996 they allocated the largest share to this category (33.6% and 28.5% respectively).
Figure 5 shows the proportion of government expenditure allocated for R&D activities. Again large variations
can be observed between the Member States. France (4.2%), Germany (3.7%) and Sweden (3.6%)
allocated the largest percentage of government expenditure to R&D activities. However, since the early 90s
all Member States (except the Netherlands and Portugal) have been allocating a decreasing share of the
government expenditure to R&D activities.
Figure 4:
GBAORD by socio-economic objective, 1996
Other civil research 1% i
à
Non-orientated fl research
15% ■
Research fir Defence
17% ^
anced ^ s .
Technological objectives \ ^ 2 1 %
\ ^ ^ ^ ^ \ . Agriculture - — " " " " ^ \ 4%
l=M
eurostatB y Human and social ^ H mm objectives
^^KBr
Iram G U F 3 0 %
Figure 5:
GBAORD as a % of total central government expenditure (latest available year)
4 . 5 -SB
4.0 ·
3.5
-3.0 ■
2.5
-2.0 ■
1.5 ■
1.0
-0.5 ■
0.0 ·
eurostat
2.
R&D EXPENDITURE
Introductory remark
R&D activities require funding as well as qualified staff. The amount spent by the economy or by one of its
sectors for the performance of R&D is registered by the intramural R&D expenditure. Data on R&D
expenditure is available for all Member States of the European Union (except Luxembourg), Norway and
Iceland, at least for certain sectors.
The time series for 1987 to 1996 differs in terms of level of
completeness, although the position of regional data continues to improve.
2.1.
R&D EXPENDITURE AT NATIONAL LEVEL
R&D expenditure in the EEA is over ECU 130 billion
In 1996, total R&D expenditure in the EEA (excluding Luxembourg and Liechtenstein) amounted to an
estimated ECU 130,900 million, representing an increase of 3.8% on 1995, and in real terms an increase of
1.8%. As a percentage of GDP, this amounted to 1.9%, slightly less than in 1995. This continued the
gradual downward trend evident from 1990 when R&D expenditure as a percentage of GDP was just over
2%.
Germany, France and the UK account for 67% of R&D expenditure
Two thirds of all R&D expenditure is accounted for by Germany, France and the UK. In these countries,
expenditure in real terms has remained fairly steady since the late 1980s or early 1990s. However, as GDP
has risen, then R&D expenditure as a percentage of GDP has fallen. For example, in Germany from 2.75%
of GDP in 1990 to 2.28% in 1996, in France from 2.41% (in 1991) to 2.33%, and in the UK from 2.19% to
1.95%.
Expenditure continues to grow in those countries starting from a low base, such as Portugal and Greece, but
less prolifically than before and they, along with Spain, remain the only countries whose R&D expenditure is
less than 1% of GDP.
Figure 6 shows for each EEA country (excluding Luxembourg and Liechtenstein), levels of expenditure as a
percentage of GDP, over the past 10 years where data are available. Each graph is compared with the
estimated average of the EEA (1986 to 1996). Here, it can be seen at a glance the developing patterns of
R&D expenditure in each country.
Figure 6:
R&D expenditure expressed as a % of GDP, comparison with EEA average
□ Β — EEA
3%
2%
-1%
-eurostat
86 87 88
—
89 90
Ί
91 92 93 94 95 96
DK
EEA
sa
π π
— EEA
L ^
Β EL
— EEA eurostat
0% " l - l - l " ! " ! - · " ! - l· ! 86 87 88 89 90 91 92 93 94 95 96
i Β E ! — EEA
3%
\3Δ
1% i —
^ ' ^ ' l"'^i tr
87 88 89 90 91 92 93 94 95 96
Β F — EEA
3%
2%
-1%
■
86 87 88 89 90 91 92 93
—
94 ■
95
l=M
eurostat
·
96
IRL
' EEA
sa
1%
0%
1
_ __
— ~
^
"
86 87 88 89 90 91 92 93 94 95 96
— EEA
\^Δ
Η ~ β - SÌ
90 91 92 93 94 95 96
■ NL — EEA
>% f Bj
86 87 88 89 90 91 92 93 94 95 96
a A
— EEA
2%'
1%
86 87 88 89 90 91 92
\
93
l=M
eurostat
94 95 96
□ ρ
— EEA
sa
n i L LIX 1 L
87 88 89 90 91 92 93 94 95 96FIN
■ EEA
sa
η
" " :"
Γη
π Γ
UK
' EEA
sa
_l . LI .
"î
—
Ρ
- 1 — f = tI I I . i_J . IJM . M !
89 90 91 92 93 94 95 96
Θ IS
— E E A
L ^
87 88 89 90 91 92 93
Ν
• EEA
L·^
—I [—
86 87 88 89 90 91 92 93 94 95 96
Most growth in R&D expenditure continues to come from the Nordic countries, along with Belgium,
Netherlands and Ireland. Latest figures for Sweden, which already invests most in R&D expenditure as a %
of GDP, show a large increase. This trend is also evident in the remaining Nordic countries, with levels of
R&D expenditure in real terms (1990 prices) in Denmark, Finland, Iceland and Norway at their highest level.
Breakdown by sector of economy
The extent to which Sweden spends a far greater percentage of its GDP than other countries is also
illustrated in figure 7, which compares each country directly using the latest data available. Here, the
proportions of expenditure allocated to each sector of the economy business enterprise sector, government
sector and the higher education sector are identified.
More than 60% of R&D expenditure carried out in the business enterprise sector
In most countries, the BES accounts for at least 50% of total expenditure, except Spain, Greece, Portugal
and Iceland. Sweden, for example, has the highest proportion of R&D expenditure carried out in the BES,
with almost three quarters performed here. In those countries with the highest expenditure (France,
Germany and the UK), the BES accounts for around two thirds, although there is a slight downward trend.
By contrast, ¡n Greece and Iceland, 40% or more of R&D was spent by the Government sector, although the
average throughout the EEA was around 16%. For the higher education sector, variations between countries
are less diverse, with between 20% and 35% of R&D expenditure attributed to this sector.
Figure 7:
R&D expenditure as a % of GDP, broken down by sector of economy (1995) *
%
4 . 0
-3.5
L ^
eurostat2.0
·-1.0
■ Higher education sector
O Government sector
Θ Business enterprise sector
0.0
-III
til
fill
- — m - - - -■■1
S FIN F D NL UK DK Ν Β IS A IRL I E P EL
Figure 8:
R&D expenditure as a % of GDP, comparison between sectors and countries (1995)
Business Biterprise Sector
π Government Sector
■ Hgher Education Sector
I
sa
eurostat
•EUI5 (1.98%)
Β (1.59%)
DK (1.96%)
D (2.3%)
EL (0.48%)
E (0.84%)
F (2.35%)
Z3
m
IRL (1.4%) M
I (1.01%) g
NL (2.08%)
A (1.49%)
Ρ (0.59%) |
FIN (2.35%)
S (3.58%)
UK(2.02%) g
IS (1.54%)
Ν (1.71%)
π
π.
b
0.5 1.0 1.5 2.0 2.5 0.5 0.5 LO
" Luxantougnotinducted
Figure 9: R&D expenditure (in million PPS at 1990 prices) by sectors of economy
E E A: 95 (104386) E E E A 9 1 (103755) Β
Β 95(2598) I ~ — Γ
Β 91 (2561) ι
ΠΚ 95(16531 Ι Ι OK 91(1358) Ι" ' . . ' ' — ... ~.'... ... ... ~ ... .." --ΐ-: . ,: . ;..;/
D 95 (29625) [
D 91 (31876)
EL 95 -(132) E
EL :91 (328) E
E 95(3852) E l I '
E 91 (3803) t. ■ . . . . . ■ 1 '
F 95(22539) E
F 91(22174) Q
IRL 95(690) E IRL 91 (381) j r
I 95(9154) ι . —'
1:91(10737) I
NL : 95 (5105) E NL 91 (1572) E
A 93 (1883) E A : 89 (1569) E
Ρ 95(562) Ρ : 90 (466)
I
ì'.
FIN 95(1710) ι FIN :91 (1440)
i :
ι ■ ■. ^ . ■■■ ·. ..---■"·"''.'-'·.- ■ · ■' ■ · · ' ' ' ' 1 S 9 5 ( 4 9 7 4 ) E
S 9 1 ( 3 8 5 0 ) ϋ
UK 95(180181 I - . . . . ■ ■ ,
UK:91 (17323) » . . . « · ■ '
15:95(70) I ι
IS 91 (52) |
N 9 5 I 1 5 2 1 ) E
Ν: 91 (1265) E
m
eurostat
( ) R&D ex|jGndiliireiiiMio PPS at 1990 prices, nil sectors including lhe Ρ rivale NonΡ rofit S ector
' E L : BES (.lalais 1993
?0% 40%
D Business Enterprise Sector
fio% ao%
Π Government Sector ■ Higher Education Sector
2.2.
R&D EXPENDITURE AT REGIONAL LEVEL
Map1
~
R&D expenditure
AÇORES
Expenditure by region as % of GDP (NUTS level 2**)
<0.75
No data available
| >= 2.00
jS¡ 1.50-2.00
] 0.75-1.50
Statistical data: Eurostat, A4.
Cartography and geographic information management: Eurostat A4, based on GISCO - 8/98.
Data for 1995 except: 1993: EL, A
NUTS level 0: NL, IS, NO NUTS level 1: B, S, UK NUTS level 3 (aggregated): DK
Map
2
R&D expenditure in the Business Enterprise Sector
zr
Expenditure by region as % of GDP (NUTS level 2**)
<0.35
No data available
I >= 1.30
| 0.75 -1.30
] 0.35 - 0.75
Statistical data: Eurostat, A4.
Cartography and geographic information management: Eurostat A4, based on GISCO - 8/98.
Data for 1995 except: 1993: EL, A
NUTS level 0: NL, IS, NO NUTS level 1:B,S, UK NUTS level 3 (aggregated): DK
ΈΔ
Map 3
Expenditure by region as % of GDP (NUTS level 2**)
>=0.40 <0.10 0.20 - 0.40 j No data available
] 0.10-0.20
Statistical data: Eurostat, A4.
Cartography and geographic information management: Eurostat A4, based on GISCO - 8/98.
' Data for 1995 except: 1993: A
NUTS level 0: NL, IS, NO NUTS level 1:B, S, UK NUTS level 3: DK
Map 4
R&D expenditure in the Higher Education Sector
u ^ * ^
Expenditure by region as % of GDP (NUTS level 2**)
] <0.15
No data available
I >=
0.50
| 0.30 - 0.50
] 0.15-0.30
Statistical data: Eurostat, A4.
Cartography and geographic information management: Eurostat A4, based on GISCO - 8/98.
Data for 1995 except: 1993: A
' NUTS level 0: NL, IS, NO NUTS level 1: B, S, UK NUTS level 3: DK
Έί£
3. R&D PERSONNEL
Introductory remark
R&D personnel includes all persons employed directly in R&D as well as those supplying direct services,
such as managers, administrative staff and office staff. Data on R&D personnel are available at national
level in terms of numbers of individuals (head count, HC) and full-time equivalent (FTE) for all Member States
of the European Union (excluding Luxembourg), Norway and Iceland. The time series for 1987 to 1996
differs in terms of level of completeness, although the position of regional data continues to improve.
3.1.
R&D PERSONNEL AT NATIONAL LEVEL
Over 2.1 million R&D personnel in the EEA
In 1996, the number of R&D personnel in the EEA (excluding Luxembourg and Liechtenstein) was an
estimated 2,110,000 in terms of head count, which translated as 1,586,000 full time equivalents. Expressed
as a percentage of the labour force, approximately 1.25% were employed in R&D.
Employment in the large countries continues to fall
Two thirds of R&D personnel in the EU plus Norway are located in either Germany, France or the UK.
However, in both Germany and the UK, numbers of R&D personnel have been declining over the past years.
Latest figures for both these countries show further falls of R&D personnel in the region of 3%. In France, the
FTE R&D personnel is at its highest level despite the actual HC being considerably lower than the late
1980's. The ratio of FTE to HC rose from 75% in 1991 to 86% in 1995. Most other countries have a ratio of
FTE to HC of between 60% and 80%, with the exception of Greece where the FTE is under 50% of the head
count.
The numbers of R&D personnel (both in terms of head count and FTE) in many countries, namely the smaller
countries or those with a relatively low base, continue to increase according to the latest available data. All
Nordic countries (Denmark, Sweden, Finland and Norway) are at their highest levels, as is the case with
Greece, Spain, Ireland which all show year-on-year increases.
More direct comparisons between countries can be made by expressing the R&D personnel (head count) as
a percentage of the labour force. Figure 10 below illustrates the situation in each country over the past 10
years, alongside the estimated average of the EEA, where possible.
Figure 10: R&D personnel expressed as a % of the LF, comparison with EEA average
□ Β
— EEA
ΉΔ
86 87 89 90 91 92 93 94 95
Ξ DK
— EEA
YWA
86 87 88 89 90 91 92 93 94 95
Β EL
— EEA
sa
eurostal
2%
- I 1 l·
■
i l
87 88 89 90 91 92 93 94 95
E
EEA
π
sa
1
87 88 89 90 91 92 93 94 95
87 88 89 90 91 92 93 94 95
eurostat
Π
f:
LI . ii
—
87 88 89 90 91 92 93 94 95
m NL — EEA
2%
1%
I=M
eurostat
86 87 88 89 90 91 92 93 94 95
■ A
— EEA
2%
1%
86 87
Lá4J
eurostat1
|
88 89 90 91 92 93 94 95
Ρ
' EEA
L ^
.ism—ι ¡—tæsa—; ¡—i_J—ι 1—mm | μ
— EEA
L ^
89 90 91 92 93 94 95
α υκ
— EEA 2%
1%
•■'ii ν
Ι=Μ
eurostat
86 87 88 89 90 91 92 93 94 95
m is
— EEA 2%
1%
~
l=M
eurostat~
86 87 88 89 90 91 92 93 94 95
Ν
■ EEA
sa
86 87 88 89 90 91 92 93 94 95
Nordic countries with highest proportion of R&D personnel in labour force
As with expenditure, the highest proportion of R&D personnel as a percentage of the labour force can be
found in Sweden, with almost 2.2% in 1995, followed by Finland with almost 2.1%. The other Nordic
countries are also well above the EEA average, and generally show an upward trend. The extent to which
the Nordic countries have a higher proportion of their labour force employed in R&D is apparent in figure 11.
Here, the data are broken down by the sector of economy in which the R&D personnel are employed, with
figure 12 illustrating each sector separately.
Figure 11 : R&D personnel (head count) as a % of the LF, by sector of economy
^
M
_ eurostat
Figure 12: R&D personnel as a % of the LF, comparisons between sectors and countries
g Business Enterprise Sector D Government Sector Higher Education Sector I
Wà
eurostat
•EUI5 (1.98%)
Β d 23%) 33R
Ώ
DK (ΐ.δΐ%) mMmKÊËttmsMMm
D
π .5%) i z z z z z z z z z j
EL (0.75%) Η
J
E (ο.94%)
nmn
F (1.46%) i
IRL (1.17%;
I (0.81%) I
NL (1.44%) " " " J "
A (1.16%)
Ρ (0.53%)
FIN (1.97%)
S (2.18%)
UK (1.28%)
.''■ ■ ;
_ L _ _ _ J
Z J
IS (1.97%) I
Ν (1.87%)
ZJ
0.8 0 0.4
• Luxembourg not inducted
() all s ectors. inducing Ρ rivate Non Ρ rofìt S ector
1.2 0 0.4 Oí 0.4 0.8 1.2
Although at the EU level, the BES remains the largest employer of R&D personnel, this is strongly influenced
by those countries which dominate R&D personnel employment, i.e. Germany, UK and France. However, as
is apparent from figure 12, in many other countries the higher education sector employs as much, and
certainly in countries where the business sector may be less developed such as Portugal, Greece and Spain,
then the HES is the largest employer of R&D personnel.
Figure 13 below shows how the proportions of R&D personnel employed by each sector of economy have
changed (in terms of head count), comparing latest available data with that of the beginning of the decade
(where possible).
In terms of FTE, for most countries the business enterprise sector is the largest employer of R&D personnel,
with the exceptions of Greece, Spain, Portugal. In terms of actual numbers (head count), however, it is often
the higher education sector where the absolute numbers are highest, with latest data indicating 40% or more
of R&D personnel are employed in this sector in all countries apart from Denmark, Germany, France, Finland
and the UK.
Figure 13: R&D personnel (head count) by sector of economy
EEA95I2144000) E
EEA:91 (2134300) E
Β 95(51253) I
Β 91 (54970) HijS'Mi,.IITÍJ
DK 95(50725) I I
DK 91(41326) I I
D 95(585676) [ 2
D. 91 (663342) S
EL 95(305451 ι
EL 91 (22534) I
E 95(147046) I 1 "
L 911115271) I I
F 95(365431) I 5 S 3
Γ 9) (395847) I —
IRE :95 (16784) E
IRL 91 (11194) Q
95(183812) t ■ ■ ■ ■
I 91(179900) I ■ · : · . . . ,
Ni 9Mios?r/.n ι . · . . . ■ ■ ■ „ . ■ ■
NI 91(1 00G25) I , , , τ ~
Α 93 143133) Ε
Α 89 (40000) Ε
Ρ 95(25024) U h W
Ρ 90 (18963) Ι Ι
FIN 95(4/866) Ε Ξ
f IN 91 (46181) F ^ ? ■„' '■■',„'■■'■'■'■ , , . _ J _
L^3
eurostat
S .95(97954) E S 91 (70399) C
UK 95(362518) Ρ
UK 91 (343147) £
IS ·95(2889) Γ ^ *
i '
~
ι ζ ζ ζ ζIS 91(2180) I I
az
Ν 95(40821) £
Ν. 91 (27 4 36) E
[ J H Ä Ü expéndame IM Μ Κ I PPS .it 1990 prices,.iJI .«ciors inclinine) I h e P n v a t e N u n Profit Sectui
E l BES ctltais 1993
□ Business Enterprise Sector π Government Sector ■ Higher Education Sector
3.2.
R&D PERSONNEL AT REGIONAL LEVEL
Map 5
R&D Personnel
AÇORES
Total R&D personnel (HC) by region as % of labour force (NUTS level 2**)
>= 1.60
<0.60
Data for 1995 except:
1993: EL, A, UK
¡ 1.00-1.60
] 0.60 - 1.00
No data available
NUTS level 0: NL, A, IS, NO
NUTS level 1 : B, S, UK
Statistical data: Eurostat, A4.
Map 6
R&D personnel (HC) by region as % of labour force (NUTS level 2**)
>= 0.90 <0.20
* Data for 1995 except: 1993: EL, A
| 0.50 - 0.90 ] 0.20 - 0.50
No data available NUTS level 0: NL, A, IS, NO
NUTS level 1: B, UK
m
Statistical data: Eurostat, A4.
Map 7
R&D Personnel in the Government Sector
—?—«Ï
MADEIRA
* · 0 55 no
Km
0 125
Km
2SO
μ
CANARIAS
\ * r
ö
ß
O 175 350
R&D personnel (HC) by region as % of labour force (NUTS level 2**)
No data available
| > = 0 . 3 0 <0.10
[~~| 0.20 - 0.30
] 0.10-0.20
Statistical data: Eurostat, A4.
Cartography and geographic information management: Eurostat A4, based on GISCO 8/98.
* Data for 1995 except: 1993: A
** NUTS level 0: NL, A, IS, NO NUTS level 1:B,S, UK
Map 8
R&D personnel (HC) by region as % of labour force (NUTS level 2**)
>= 0.60
"J 0.40 - 0.60
] 0.20 - 0.40
<0.20
No data available
* Data for 1995 except: 1993: A, UK
** NUTS level 0: NL, A, IS, NO NUTS level 1: B, UK
ΈΔ
Statistical data: Eurostat, A4.
4.
EUROPEAN PATENT APPLICATIONS IN THE EU
Introductory remark
Patents are a means of protecting inventions which have been developed by enterprises, institutions or
organisations, in order to benefit from an invention or innovation. Over the years many R&D output indicators
have been developed, each of which have different characteristics. However, the most commonly used R&D
output indicators are based on patents. In this report, the data relating to (European) patent applications
refers to those filed with or designated to the European Patent Office (EPO). The data are available for all
Member States of the EU.
4.1.
PATENTING ACTIVITIES AT NATIONAL LEVEL
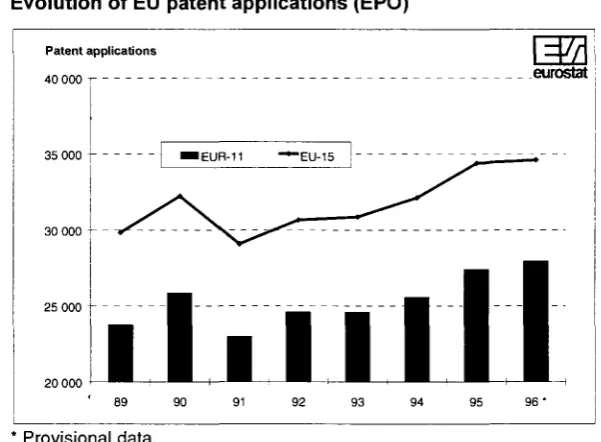
EU-15 patent applications in 1996 are 16% above the 1989 level
The number of patent applications filed by the EU-15 with the EPO and Euro-PCT (applications in their
international phase) have been increasing at a steady rate with the exception of 1991.
1Since 1989, the
[image:34.595.120.421.326.547.2]EU-15 patent applications have grown at an average annual rate of 2.1% and in 1996, approximately 34,600
patent applications were filed by the EU-15. Figure 14 shows that in spite of a substantial decrease in 1991,
the number of patent applications in 1996 are some 16% above the 1989 level. The long term trend of the
EUR-11 is similar to the EU-15.
Figure 14: Evolution of EU patent applications (EPO)
Patent applications
40 000 ι
35 000
-m
eurostat
* Provisional data.
Germany, the most active Member State in European patent applications
Figure 15 shows the evolution of the shares of the Member States patent applications between 1989 and
1996. There are major disparities in the shares of patent applications between the Member States.
Germany clearly stands out from the rest with its extraordinary share of 41.4% (14,332 patent applications),
which is more than double the share of France (16.3%). Germany, France and UK are the three dominant
countries in EU patenting. In 1996 they accounted for around 70% of the EU total. All the countries have
increased their shares of patent applications over the last eight years period with the exception of Germany,
France and UK.
Figure 15: Evolution of the shares of patent applications
* Provisional data.
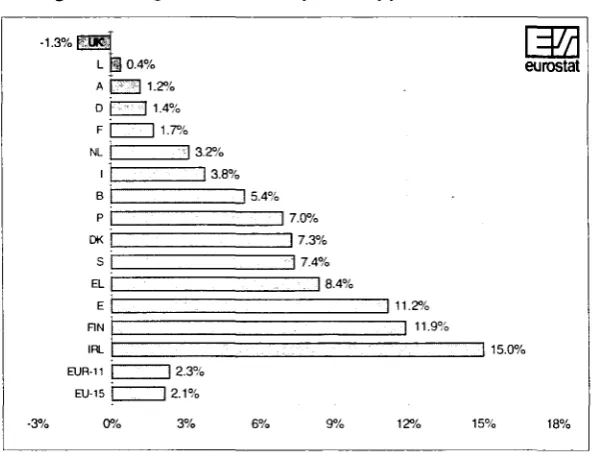
Ireland achieved the highest average annual growth rate of patent applications (15%) between 1989
and 1996
Average annual growth rates of patent applications (figure 16) of most EU countries are well above that of
EU15 rate. Ireland (15%) is the fastest growing country, followed by Finland (12%) and Spain (11%). In
contrast, the growth rates of the big three countries (Germany, France, and UK) are below the EU average.
Low patenting countries such as Spain, Ireland and Finland have performed exceptionally well during the
198996 period, while high patenting countries have been losing ground. In 1989 Spain, Ireland and Finland
accounted for 0.75%, 0.17% and 1.30% of the EU patent applications, but they achieved high average annual
growth rates over the 198996 period. In contrast Germany, France and UK accounted for 43%, 17% and
15% of EU patent applications, but their growth rates were a mere 1.4%, 1.7% and 1.3% respectively.
Figure 16: Average annual growth rates of patent applications, 198996
-1.3% M
3%
L g 0.4'
A fel
F[T~
NL h
i t
Β j ~ p £ DK E
s L~ EL |
E f 1.2%
[image:35.595.104.401.445.673.2]1.4% | 1.7%
»I 3.2%
I 3.8%
\ 5.4%
I 7.0% 1 7.3%
■ 7.4% | 1 8.4%
■ 11.2%
FIN M 11.9%
!
IRL m
EUR11 β EU15 g
I 2.3%
EJO 2.1%
m
eurostat
o%
15.0%
3% 9% 12% 15%
207 European patent applications per million labour force were filed by the EU in 1996
from pole position, when patent applications are ranked in terms of labour force, followed by Germany
(367 MLF), Finland (348 MLF) and The Netherlands (275 MLF). France declines to sixth position from
second, however its recorded figure (222 MLF) is above the EU15 average. In contrast UK declines from
third position to tenth and its recorded figure (145 MLF) is well below the EU15 average.
Table 1:
Ranking (number) of patent applications in 1996
*
14M
eurostat S D FIN NL DK F Β A L UK I IRL E EL Ρ
EU15 EUR11
Rank
1 2 3 4 5 6 7 8 9 10 11 12 13 14 15
Number of patent applications per MLF
(418) (367) (348) (275) (235) (222) (209) (203) (202) (145) (122) (90) (30)
O)
(3)
(207) (219)
Rank
6 1 8 5 10
2 7 9 14
3 4 12 11 13 15
Number of patent applications
(1,844) (14,332) (851) (2,040) (661) (5,624) (874) (774) (34) (4,144) (2,775) (134) (471) (39) (12)
(34,608) (27,921)
Provisional data.
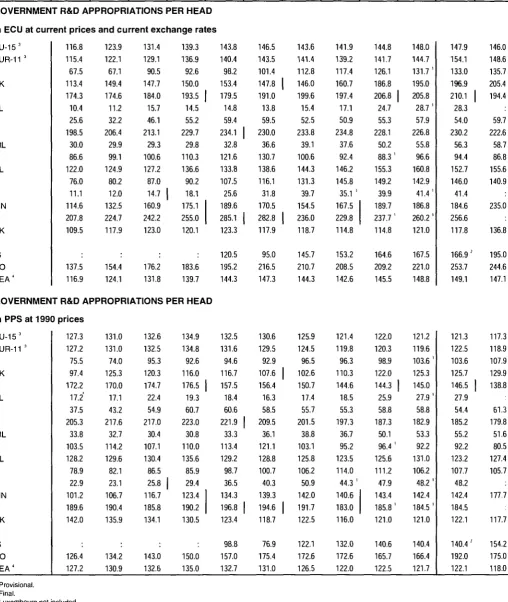
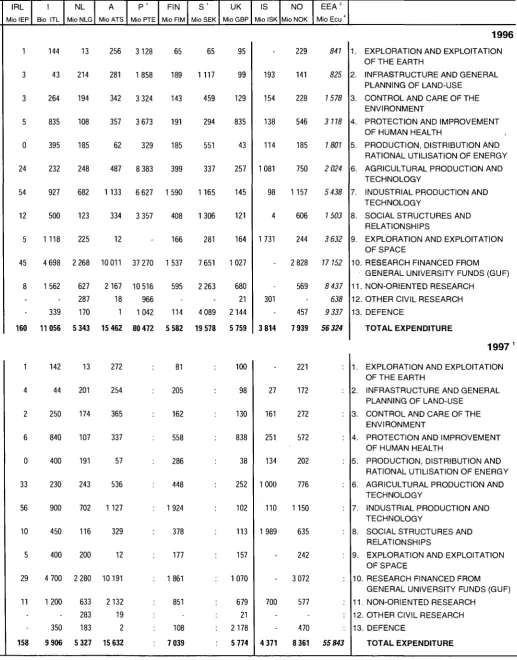
Performing Operations & Transporting (22%) is still the dominant sector
The International Patent Classification (IPC) is used to classify patent applications by field of technology. In
1996 the largest numbers of patent applications filed by the EU15 appear in the
Performing Operations &
Transporting
(22%),
Chemistry & Metallurgy
(17%) and
Human Necessities
(16%) sectors.
Patenting
activities of the EU15 in the
Electricity
(15%),
Physics
(13%) and
Mechanical Engineering; Lighting; Heating;
Weapons; & Blasting
(10%) sectors also appear quite strong; in contrast patenting in the
Fixed Constructions
(5% ) and
Textiles & Paper
(2%) sectors appears very weak. Shares of each IPCsectors have remained
more or less stable since 1989.
4.2.
REGIONAL PATENT ACTIVITIES
île de France filed for 2,314 patent applications in 1996
There are significant disparities in the patenting activities between EU regions (NUTS level 2), even within a
country. In terms of absolute patenting numbers, the five most active regions accounted for more than 22%
of the total EU15 patent applications, but in comparison to 1989, their shares declined by 5% (table 2).
Table 2: Five most active patenting regions in 1996 *
=2
eurostat
Region
Ile de France
Oberbayern
Stuttgart
Darmstadt
Düsseldorf
Country
France
Germany
Germany
Germany
Germany
Rank
1996
1
2
3
4
5
No. of patent
applications
1996
2314
1578
1419
1289
1154
Rank
1989
1
2
5
4
3
No. of patent
applications
1989
2197
2133
1087
1186
1358
Provisional data.
Table 3: Regional growth classifications (Patent applications per MP)
-Έ.
eurostat
Average annual growth, 1989-96
Fast growing regions (>15%)
Medium to fast growing regions (10-15%)
Medium growing regions (5-10%)
Low growing regions (<5%)
Total number of regions
Number of regions in the
corresponding categories
Β
4
2
5
0
11
D
8
0
5
25
38
E
8
3
3
3
17
F
0
0
6
15
21
I
5
4
4
7
20
NL
1
3
2
6
12
A
0
0
2
7
9
S
4
2
1
1
8
Rheinhessen-Pfalz filed for 798 patent applications per MLF in 1996
For a more comparable regional portrait, patent applications are expressed in terms of per MLF (table 4).
Large disparities can be observed within EU regions, even within a country. Rheinhessen-Pfalz is the most
active region with 798 patent applications per MLF. Navarra (103) is the most active Spanish region, but in
comparison to Rheinhessen-Pfalz it is approximately seven times less active. The largest regional disparity
within a country is observed for Italy, where the number of patent applications of most active region is some
eighty times greater than the least active region. Patent applications between regions are more evenly
distributed amongst the Dutch regions, where the most active region is approximately four and half times
greater than that of the least active region.
Table 4: Regional disparities within Member States (Patent applications per MLF, 1996*)
—
Jr
eurostalΒ
D
E
F
I
NL
A
S
Most active region
Brabant Wallon
Rheinhessen-Pfalz
Navarra
Ile de France
Lombardia
Noord-Brabant
Vorarlberg
Stockholm
Number
446
798
103
438
237
561
434
733
Least active region
Hainaut
Mecklenburg-Vorpommern
Rioja
Corse
Calabria
Flevoland
Burgenland
Mellersta Norrland
Number
52
22
5
15
6
127
Map 9
European patent applications
European patent applications per 1 million labour force per region (NUTS level 2)
* Data for 1995
<100
No regional data available (UK)
I >= 400
[ | 200 - 400
] 100-200
Statistical data: Eurostat, A4.