This is a repository copy of
Reduction of water content in calcium aluminate cement
with/out phosphate modification for alternative cementation technique
.
White Rose Research Online URL for this paper:
http://eprints.whiterose.ac.uk/131324/
Version: Published Version
Article:
Garcia-Lodeiro, I., irisawa, K., Jin, F. et al. (2 more authors) (2018) Reduction of water
content in calcium aluminate cement with/out phosphate modification for alternative
cementation technique. Cement and Concrete Research, 109. pp. 243-253. ISSN
0008-8846
https://doi.org/10.1016/j.cemconres.2018.04.019
© 2018 The Authors. Published by Elsevier Ltd. This is an open access article under the
CC BY license (http://creativecommons.org/licenses/BY/4.0/).
[email protected]
https://eprints.whiterose.ac.uk/
Reuse
This article is distributed under the terms of the Creative Commons Attribution (CC BY) licence. This licence
allows you to distribute, remix, tweak, and build upon the work, even commercially, as long as you credit the
authors for the original work. More information and the full terms of the licence here:
https://creativecommons.org/licenses/
Takedown
If you consider content in White Rose Research Online to be in breach of UK law, please notify us by
Contents lists available atScienceDirect
Cement and Concrete Research
journal homepage:www.elsevier.com/locate/cemconres
Reduction of water content in calcium aluminate cement with/out
phosphate modi
fi
cation for alternative cementation technique
Inés Garcia-Lodeiro
a,⁎, Keita Irisawa
b, Feiyang Jin
a, Yoshihiro Meguro
b, Hajime Kinoshita
a,⁎ aDepartment of Materials Science and Engineering, University of Sheffield, Sheffield, UKbSector of Decommissioning and Radioactive Waste Management, Japan Atomic Energy Agency, Tokai, Japan
A R T I C L E I N F O
Keywords:
Calcium aluminate cement (CAC) Phosphate cement
Water reduction Hydroxyapatite
Fukushima Daiichi nuclear power plant
A B S T R A C T
Cementation of the secondary aqueous wastes from TEPCO Fukushima Daiichi Nuclear Power Plant is chal-lenging due to the significant strontium content and radioactivity, leading to a potential risk of hydrogen gas generation via radiolysis of water content. The present study investigates the reduction of water content in calcium aluminate cement (CAC) with/out phosphate modification by a heat-treatment during the solidification. The reduction of water in the CAC was found restricted by the rapid formation of crystalline hydration phases, whereas the phosphate-modified system allowed the gradual reduction of water, achieving the reduction of 60% water content at 95 °C. Curing at 60–95 °C also eliminated the significant cracks found at 35 °C in the phosphate system. The possible difference in the amorphous products, NaCaPO4∙nH2O type at 35 °C and Ca(HPO4)∙xH2O
type at 60–95 °C, may have contributed to the improvement in the microstructure together with the change in the pore size distribution.
1. Introduction
1.1. Background
The processing of contaminated water from Tokyo Electric Power Company (TEPCO) Fukushima Daiichi Nuclear Power Plant results in a large amount of secondary aqueous wastes with a high strontium con-tent and a significant radioactivity [1]. As a consequence of this radioactivity, their long-term storage faces the potential risk of not only leakage but also explosion andfire due to the hydrogen gas originated from the radiolysis of water. To assure the safe storage of these wastes, they must be converted into a form that has a reduced risk of leakage as well as a minimisedfire risk due to the hydrogen gas generation [2–3]. Conventionally, such wastes can be encapsulated in cement matrices based on the Portland cement (PC). However, if these secondary aqu-eous wastes are encapsulated using a conventional cementing process based on PC, the risk of hydrogen gas generation would remain, due to the radiolysis of the water intrinsically present in the cement matrix both in the pore solution and the hydrated products.
1.2. Focus of study
In order to minimise thefire risk from the hydrogen gas generation and the risk of leakage, the proposed work aims to develop an
alternative cementation technique with reduced water content for the safe storage of these secondary products. The cementation technique proposed in the present study is based on calcium aluminate cement (CAC) modified with phosphates (CAP) [4–8]. Differing from the tra-ditional PC, which relies solely on the hydration to solidify [4–6], CAP systems set and hardened via an acid-base reaction between the CAC used as a base and the phosphate solution used as an acid [4]. The reaction precipitates salts which act as a binding phase between par-tially and unreacted particles, resulting in a solid product [4]. Because the solidification does not rely solely on a hydration process as ex-plained above, it may be possible in CAP to reduce the water content during solidification through a direct water removal by mild heating, once the water initially presented has served its purpose in providing sufficientfluidity to be cast.
The present study investigates the application of a heat-treatment during the solidification process of a CAC with/out phosphate mod-ification to produce a cementitious material with reduced water con-tent. The effects of temperature in the heat-treatment were studied with the special focus on: the water content in the products; the reaction products formed in the systems; and the integrity of the micro-structures.
https://doi.org/10.1016/j.cemconres.2018.04.019
Received 1 December 2017; Received in revised form 20 April 2018; Accepted 23 April 2018
⁎Corresponding authors.
E-mail addresses:i.garcia-lodeiro@sheffield.ac.uk(I. Garcia-Lodeiro),h.kinoshita@sheffield.ac.uk(H. Kinoshita).
Available online 08 May 2018
1.3. Calcium aluminate cement (CAC)
CACs have been reported to show potential advantages when used to encapsulate certain toxic and radioactive wastes [9–14]. The hy-dration of CAC cements at ambient temperatures initially produces hexagonal metastable phases, such as CAH10and C2AH8, which will be
converted with the time and temperature into the thermodynamically stable phases: C3AH6and AH3[15–16]. Due to the higher density (thus,
smaller volume) of the stable phases and the release of water, the conversion involves an increase in the porosity and loss of the me-chanical strength that can cause a failure in the CAC structures [15–16]. Since CAC system will be heat-treated after preparation in the present study, the conversion can be avoided via direct formation of stable phases [15].
1.4. Modification of CAC by phosphates
The addition of phosphates to CACs has been shown to be an ef-fective way to avoid the conventional hydration of the systems [4,17–20]. The acid-base reaction between the CAC and phosphates allows the formation of mixed crystalline and amorphous products, different from those found in the conventional CAC systems. The amorphous material produced in these systems is still under in-vestigation [4,6,17,20]. While some authors identified the formation of a C-A-P-H gel [6,20], others propose different types of hydrated amorphous phosphates and an alumina gel [4,17]. The resultant pro-ducts can experience cracking [6], likely because of the significant exothermic reaction between the acidic phosphate solution and the basic CAC, experiencing an initial expansion and a successive volume contraction. Micro cracks are not ideal for the application of radioactive waste encapsulation, as the increase in the surface area is known to increase the leaching rate of radionuclides [10].
2. Experimental
2.1. Materials
CAC (Secar 51, Kerneos) was used as the primary precursor, with the oxide composition analysed via X-Ray Fluorescence (Table 1). XRD pattern in Fig. 1 shows monocalcium aluminate (CA) as the major component, with secondary phases such as gehlenite (G) and perovskite (P). A trace of gibbsite (g) is also observed, which suggests that this cement has been slightly hydrated.
Reagent grade of a linear metaphosphate (NaPO3)n 97%, Acros
Organics, referred to as polyphosphate) and an orthophosphate (NaH2PO4.2H2O 99%, Acros Organics, referred to as monophosphate)
were used as sources of phosphates. The latter was added to avoid the rapid setting caused by the reaction of polyphosphate and CAC [8].
2.2. Methodology
Two types of cement pastes were prepared; CAC cement, composed of 100% Secar 51 without modification; and CAP cement, which con-tains additional 40 wt% of sodium polyphosphate and 5 wt% of sodium monophosphate (Table 2). All cement pastes were prepared with a water to cement ratio (w/c) of 0.35. For CAP cement, prior to the preparation of the paste, the phosphates were dissolved in distilled water using a roller mixer for 24 h at room temperature. The phosphate solution was then added to the CAC clinker and hand mixed for 30 s,
followed by 120 s of high shear mixing with a Silverson L4RT mixer at 2500 rpm. All samples exhibited a rapid development of rigidity, especially CAP samples.
Samples were cast in plastic centrifuge tubes or Teflon tubes in di-rect contact with the air without lid, to allow the evaporation of the water from the top surface exposed to the air. Two samples per system were cured at 35 °C, 60 °C, 95 °C or 180 °C for 28 days. During the curing period, the sample weight was monitored to estimate the re-maining water in each system. After 28 days, pastes were demoulded and cut into 5 mm thickness using a slow saw and immersed in acetone for 3 days, then air dried and characterised.
Elemental composition of starting materials was determined by X-rayfluorescence (XRF), using radiation at an acceleration voltage of 100 kV and 800 mA current (Philips PW 1404/00/01). For the phase analysis, X-ray diffractograms (XRD) were obtained using a Siemens D5000 diffractometer with a copper source, scanning in the 2θrange 5–60° with a step size of 0.02° at a rate of 1°/min. Thermogravimetric (TG) analysis was also performed with a Perkin Elmer Pyris 1, in an alumina crucible, heating from room temperature to 1000 °C at 10 °C/ min, underflowing nitrogen. FTIR specimens were prepared by mixing 1 mg of the powered sample with 200 mg of KBr and pressed into a thin disk. The prepared disks were tested in a Perkin Elmer FTIR Model 1600.
[image:3.595.315.546.56.214.2]For the analysis of microstructure, mercury intrusion porosimetry (MIP) measurements were performed using Micrometrics Poresizer 9320 for the samples that had been dried by immersion in acetone followed by drying in a desiccator. Microstructural analysis was also performed using a JEOL JSM6400 scanning electron microscope (with an integrated Link ISIS EDX analyser) in backscattered electron (BSE) mode. Samples were prepared by mounting in epoxy resin, polishing the observation surface to 1/4μmfineness using diamond paste. Energy Dispersive X-ray spectroscopy (EDX) was used to examine the elemental Table 1
Oxide composition of Secar 51 (wt%).
Oxides CaO Al2O3 SiO2 Fe2O3 TiO2 MgO SO3 K2O+ Na2O
[image:3.595.306.557.286.396.2]wt% 38.39 50.77 4.83 1.82 2.04 0.40 0.24 0.63
Fig. 1.XRD pattern for Secar 51; CA: Monocalcium Aluminate CaAl2O4(PDF
70-0134); G: Gehlenite Ca2(Al(AlSiO7) (PDF 35-0755); P: perovskite CaTiO3
(PDF 75-2100); g: Gibbsite Al(OH)3(PDF 12-0460).
Table 2
Cement formulations (in grams) and curing conditions.
System Secar 51 (g)
Na (PO3)n
(g)
NaH2PO4.2H2O (g) Distilled
water (g)
Curing temperature
CAC35 100 – – 35 35 °C
CAP35 100 40 5 35
CAC60 100 – – 35 60 °C
CAP60 100 40 5 35
CAC95 100 – – 35 95 °C
CAP95 100 40 5 35
CAC180 100 – – 35 180 °C
[image:3.595.35.289.712.745.2]distribution in the cement samples.
3. Results and discussion
3.1. Reduction of water at different curing temperatures
3.1.1. Reduction of water content
The weight of samples decreased during the curing period at all temperatures both in the CAC and CAP systems. Assuming these weight losses represent the evaporation of water, the amount of water content remaining in each system was estimated as shown inFig. 2(a) and (b), in % relative to the corresponding original water contents. As expected, the amount of water content remaining in both systems decreased with the increasing in the curing temperature, but the behaviour of these
systems were significantly different. The reduction of water content in the CAC cements mostly took place during thefirst 24 h, and little re-duction in the water content was observed after this period. On the other hand, in the CAP cements, more gradual loss of water content continued for 28 days, although it appeared to have slowed down to-wards later stage of the curing period. In general, the water content can be reduced in a larger extent in the CAP cements than in CAC, and this becomes more significant at higher temperature as summarised in
Fig. 2(c). It should be noted that the CAP system cured at 180 °C have lost practically all its water content within 1 day of curing. These water reductions in the CAC and CAP systems and their effects on the mate-rials are further analysed and discussed in the following sections.
3.1.2. Behaviour of water in CAC under curing conditions
As previously discussed, the reduction of water seems to become slow and steady after 24 h in the CAC. Based on the one dimensional diffusion, the quantity of water (Q), escaped from the samples during the slow removal period, can be evaluated by integrating the water passing through the top surface of the samples during the curing period (t) as shown in Eq.(1)[21].
∫
= ⎛
⎝ ⎞⎠ = ⎛⎝ ⎞⎠
Q C D
πt dt C
Dt π
2
t
s s
0
1/2 1/2
(1)
where Csis the concentration of water at the sample surface, which can
be assumed to be constant, especially at the earlier stage of the slow removal period. Diffusion constant (D) is also assumed to be constant. Eq.(1)can be further rearranged into Eq.(2).
⎜ ⎟
= ⎛ ⎝
⎞ ⎠
Q C D
π t
2 s 1/2 1/2
1/2
(2)
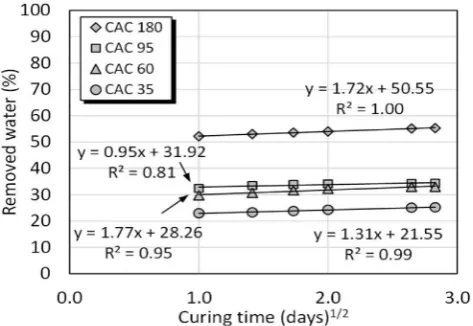
Based on the data shown inFig. 2, the quantity of water (Q) re-moved from the sample is plotted against the square root of time (t1/2)
inFig. 3for 1–8 days of curing (at the earlier stage of the slow removal period). According to Eq.(2), the gradient of the data plotted inFig. 3
should provide the information linked to the diffusion coefficient. The gradient increases when the curing temperature changed from 35 °C to 60 °C, reflecting the higher diffusivity of water at an increased tem-perature. However, the gradient decreases when the curing temperature changed from 60 °C to 95 °C, which implies that the diffusivity of water is lower in the CAC95 than that in CAC60. In addition, the lower ac-curacy infitting (R2= 0.81) suggests that diffusivity of water in the
CAC95 in this period is not constant. Thus, the overall process may be influenced also by the other factors such as the concentration of water at the surface and the microstructural development in the material, and these influence become significant at 95 °C. The diffusivity of water becomes higher again at 180 °C probably because of the involvement of
(a)
(b)
[image:4.595.52.277.56.546.2] [image:4.595.314.551.555.718.2](c)
Fig. 2.Remaining water content during the curing period in (a) CAC cements (b) CAP cements, and (c) summary of remaining water in CAC and CAP systems after 28 days.
water vapour at this temperature.
3.1.3. Behaviour of water in CAP under curing conditions
The quantity of water removed from the CAP samples during the 1–8 days of curing is also plotted against the square root of time in
Fig. 4based on the data shown inFig. 2. The gradients of the data are much larger at 35, 60 and 95 °C compared with the corresponding CAC samples, indicating enhanced removal of water in the CAP systems. The high accuracy infitting (R2values) in these data also suggests that the diffusion is the dominant process of the water removal in the system. The CAC180 indicates a very different behaviour because only negli-gible amount of water was remaining in the system at this stage. It is noticeable that the gradient of the data gradually increases from 35 to 95 °C. Based on Eq.(2), the gradient of the plots inFig. 4can be defined as Eq.(3).
⎜ ⎟
≡ ⎛ ⎝
⎞ ⎠
gradient C D
π
( ) 2 s 1/2 1/2
(3)
Correlation between the diffusion coefficient (D) and the tempera-ture (T) can be empirically expressed by Eq. (4), using the diffusion coefficient at 1/T = 0 (D0) and the activation energy (E) [21].
=
{ }
−D D exp E
RT
0
(4)
From Eqs.(3) and (4),
= =
{ }
−gradient C D
π
C D
π exp
E RT
( )2 4 s 4 s
2 2 0 (5) ⎜ ⎟ ∴ = ⎛ ⎝ ⎞ ⎠−
gradient C D
π E RT
ln( )2 ln 4 s
2 0
(6)
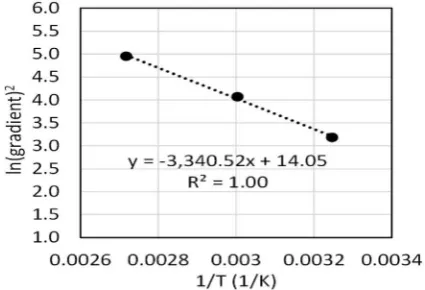
The natural logarithm of (gradient)2 (from Fig. 4) are plotted
against 1/T inFig. 5. Diffusivity of water depends on the microstructure of the materials which can change with temperature. As a result, the diffusivity of water appears larger at higher temperatures. Comparing the plot with Eq.(6), followings are obtained.
⎜ ⎟ ⎛ ⎝ ⎞ ⎠= C D π
ln 4 s2 0 14.05
(7)
−E = −
R 3340.52 (8)
Therefore, the apparent activation energy for the water diffusion in CAP system is estimated as E = 27.77 kJ/mol under the condition in-vestigated. It should be noticed that the activation energy presented here may not be the true activation energy but a representative.
3.2. Effects of water reduction on product phases
3.2.1. Product phases in CAC system
The X-ray diffractograms for CAC cements after 28 days of curing period are shown inFig. 6. The CAC cements indicated a conventional hydration, but to produce only stable phases: hydrogarnet (H: C3AH6)
and gibbsite (g: AH3). As samples have been cured at temperatures of ≥35 °C, metastable phases (CAH10and C2AH8) were not detected [22].
Therefore, water is retained in the system mainly as a part of C3AH6and
gibbsite AH3. The peaks corresponding to the unreacted clinker phases
(C: CA, G: gehlenite and P: perovskite) are also observed in the dif-fractograms. The peaks for CA appear more intense in the samples cured at 95 °C and 180 °C, suggesting that the water in these systems was able to evaporate faster at these temperatures, and therefore, less water was available to react with CA.
The XRD analysis can be supported by TG and differential thermo-gravimetric (DTG) data shown in Fig. 7. CAC cements show several weight loss events emphasised in DTG curves;i) a weak peak at 90 °C (mainly in sample cured at 35 °C) associated with the loss of free water and a possible dehydration of an alumina gel (AH3gel) [22,23];ii) a
[image:5.595.325.538.57.202.2]strong peak at 309 °C with a shoulder at 285 °C, for the decomposition of hydrogarnet and the dihydroxylation of gibbsite respectively [23]; andiii) a weak signal located around 468 °C that could correspond to the decomposition of a poorly crystallisedγ-AlOOH. The formation of this phase is usually associated with the dehydration of the alumina gel Fig. 4.Amount of removed water from CAP samples during 1–8 days of curing,
[image:5.595.44.284.57.207.2]plotted against square root of curing time.
Fig. 5.Natural logarithm of (gradient)2obtained from the data of water
re-moval in CAP samples at 35, 60 and 95 °C, plotted against 1/T.
Fig. 6.X-ray diffractograms for CAC cements cured at different temperatures for 28 days in an open system. CA: Monocalcium aluminate CaAl2O4(PDF
70-0134), P: perovskite CaTiO3(PDF 75-2100), G: gehlenite Ca2Al(AlSiO7) (PDF
35-0755), H: hydrogarnet Ca3Al2(OH)12(C3AH6) (PDF 02-1124); g: gibbsite Al
[image:5.595.317.545.244.416.2]at high temperature [23].
The TG and DTG data indicate that the stable hydrate phases C3AH6
and AH3do not dehydroxylate and release water below 180 °C. This
explains the weight reduction behaviour of CAC system during the curing period. In the initial stage of curing, the hydration of the cement and the evaporation of the free water take place simultaneously, and this stage seems to complete within 24 h (Fig. 2a). Once stable C3AH6
and AH3are formed, only small amount of free water (0.6–1.5%) can
diffuse out of the hardened system at the curing temperature examined, as the majority of the remaining water is already forming a part of C3AH6or AH3.
It should be noted that the weight loss in the TG data represent the amount of water existed in the system mainly as the hydrate phases, whereas the content of remaining water previously shown in Fig. 2
includes the water presented both as the free water and the hydrate phases. When CAC60 and CAC95 are compared, the total amount of remaining water is similar in these systems (Fig. 2), but CAC60 is slightly more hydrated as observed from larger weigh loss between 200 °C and 350 °C (Fig. 7), and thus, CAC95 must have free water slightly more trapped in the system. This may be related to the lower diffusivity of water in CAC95 discussed previously. Similarly, when CAC35 and CAC60 are compared, the level of hydration is similar in both systems according to Fig. 7, but CAC35 retain free water
significantly more, and thus the total content of water is larger (Fig. 2).
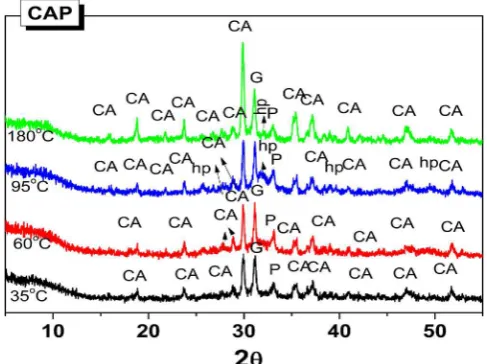
3.2.2. Product phases in CAP system
CAP samples had very different XRD results from the CAC systems as shown inFig. 8. Neither hydrogarnet nor gibbsite were detected, and only the decrease in the intensity of clinker phases (in particular CA) was observed. XRD data also shows a hump located at 25–35° 2θ as-sociated with the precipitation of amorphous products [8]. Such a be-haviour of CAP cements has been reported previously only for the systems cured in the closed system, at lower temperatures [4–6]. The obtained results revealed the similar behaviour of CAP cements in an open system at elevated temperatures. However, less clinker phases appear to be reacting at higher temperatures, most likely due to the loss of the water in the open system.
The major difference from the previous studies on CAP in the lit-erature is the formation of hydroxyapatite (Ca5(PO4)3(OH)) at 95 °C
and 180 °C that appears to be poorly crystallised. The presence of this phase is more prominent in the sample cured at 95 °C. A higher tem-perature appears to favour the formation of hydroxyapatite but the presence of water seems equally important. Only a negligible amount of water was remaining in the CAP180 (Fig. 2), and the formation of hydroxyapatite appears to be limited.
TG and DTG curves for CAP cements are shown inFig. 9. While the CAC system (Fig. 7) experienced principal weight losses over the range of 200–360 °C, the CAP systems exhibited the majority of weight loss in the range of 50–200 °C, with an additional weigh losses at 230–350 °C. DTG curves indicates that the principal weight loss event at 50–200 °C decreases with the increase of the curing temperature and practically disappears in the sample cured at 180 °C. This could correspond to the loss of free water, as well as the dehydration of the amorphous phases previously detected in the similar systems [6,20]. It has been known free water is the dominant source for H2gas generation via hydrolysis
of water in cements [24], and thus, the risk of H2gas generation should
become significantly less in CAP systems cured at higher temperatures. The amorphous phases formed in the CAP samples can be an AH3gel, a
C-A-H gel or a C-A-P-H gel according to the previous studies [6,20]. They could also be a calcium phosphate hydrate salts such as Cax(HPO4)y(PO4)z∙nH2O or NaxCay(HPO4)z(PO4)r∙nH2O [25]. For
ex-ample CaHPO4∙2H2O is known to dehydrate in two steps at 150 °C and
210 °C [26,27], which shows a reasonable match with the data for CAP95. A similar amorphous salt cold be present in the system. The small weight of loss in the region of 230–350 °C may be due to the
(a)
[image:6.595.310.554.58.240.2](b)
Fig. 7.(a) TG and (b) DTG curves for CAC cements cured at 35, 60, 95 and 180 °C for 28 days.
Fig. 8.XRD diffractograms for CAP cements cured at different temperatures for 28 days in an open system., CA: Monocalcium aluminate CaAl2O4(PDF
70-0134); P: perovskite CaTiO3(PDF 75-2100); G: gehlenite Ca2Al(AlSiO7) (PDF
[image:6.595.52.281.66.465.2]dehydroxylation of gibbsite [23] presented in a small amount or in a poorly crystallised form since this phase was not positively detected in the XRD.
The sample cured at 180 °C showed an additional weight loss event
at 390 °C which, according to the literature, could correspond to the decomposition of a sodium calcium phosphate salt (NaCaPO4∙xH2O)
[28]. This phase was considered to be one of the precursors for hy-droxyapatite [28]. Although observed in the XRD (Fig. 8), no weight loss events were identified directly associated with the hydroxyapatite decomposition in the DTG curves as it decomposes at above 1000 °C as: Ca10(PO4)6(OH)2→3Ca3(PO4)2+ CaO + H2O [29–31].
3.3. Amorphous calcium phosphate phase
[image:7.595.46.279.54.417.2] [image:7.595.312.551.60.248.2]3.3.1. FTIR analysis of raw materials
Fig. 10shows the FTIR spectra for the raw materials, Secar 51, so-dium monophosphate (MP) and soso-dium polyphosphate (PP). The most obvious signals on Secar 51 are the absorption bands in the region of 850–650 cm−1. The bands at 840, 808 and 784 cm−1are attributed to
the stretching vibrations (ν) of AleO in AlO4groups (manly clinker CA
[20]), while the bands at 720, 680, 640 and 568 cm−1are associated
with those in AlO6groups [32–34] (usually hydration products AH3and
C3AH6). Typical asymmetrical stretching vibration (νas) bands of OeH
in AH3are also observed at 3700–3000 cm−1, with bending vibration (a)
(b)
Fig. 9.(a) TG and (b) DTG curves for CAP cements cured at 35, 60, 95 and 180 °C for 28 days.
[image:7.595.73.520.511.716.2](a)
(b)
Fig. 10.FTIR spectra of Raw materials, Secar 51, sodium monophosphate (MP) and sodium polyphosphate (PP): (a) from 4000 to 2000 cm−1and (b) from 2000 to
600 cm−1.
(δ) of OH groups in AH3at 1020 cm−1, in addition to the trace ofνas
OeH associated with C3AH6at 3660 cm−1[33,34], corroborating that
the cement was slightly hydrated. The spectrum also shows a weak band located at 1490 cm−1attributed to the ν
as CeO in CO32−,
in-dicating that the cement is slightly carbonated.
Sodium monophosphate, which is an orthophosphate, shows ab-sorption bands forνasOeH (3600–3200 cm−1),νP-O-H (2700 cm−1),ν
P]O (1240 cm−1), NaeO (1120 cm−1), ν PeO in H2PO4−
(1100–1030 cm−1
), andδ P-O-H (990–850 cm−1
). Sodium polypho-sphate shows absorption bands for ν P]O (1260 cm−1), ν PeO
(1080 cm−1),νP-O-P stretching mode (980 and 864 cm−1), and a
re-gion of double absorption band for δ P-O-P mode (760–720 cm−1
) [17,35–38].
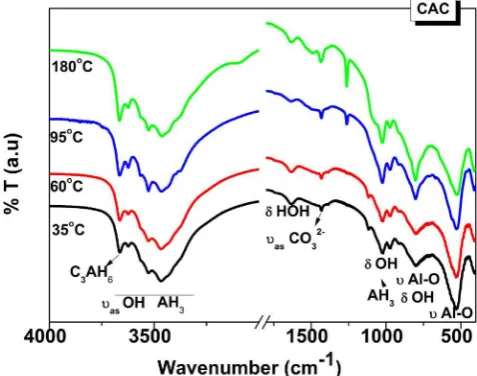
3.3.2. FTIR analysis of CAC samples
Hydrated CAC samples (Fig. 11) had very similar spectra among them regardless of the curing temperature, but indicated a significant change from the anhydrous Secar 51 (Fig. 10); all spectra show a broad and intense absorption band in the region of 3700–3000 cm−1
as the result of the overlapping bands of νas OeH in AH3 (3620, 3530,
3450 cm−1) and C
3AH6(3670 cm−1) with broad abortion bands (νas
OeH) of water [33,34]. The band of a medium intensity at
~1630 cm−1
is associated withδH-O-H in H2O. The bands located at
1020, 975, 920 and 800 cm−1correspond toδO
eH in AH3, with theν
AleO bands of unreacted Secar 51 overlapping at 800 cm−1. The strong
band located at ~545 cm−1
is associated with the νAleO in
hydro-garnet [34], which shows a significant increase compared with un-hydrated Secar 51 (Fig. 10). A weak signal at ~1430 cm−1corresponds
toνasCeO in CO32–groups [33,34], indicating a small degree of
car-bonation.
3.3.3. FTIR analysis of CAP samples
FTIR spectra of CAP samples (Fig. 12) confirm that the products formed are different from those found in CAC samples (Fig. 11), but share some features with the CAC system: a broad absorption band located in 3700–3000 cm−1 peaking at 3440 cm−1corresponding to
theνasOeH in water, and the band forδH-O-H in H2O observable at
~1640 cm−1.
CAP35 shows its main absorption band located at ~1103 cm−1,
with a shoulder at 1027 cm−1
. The appearance of these signals reveals the formation of orthophosphate groups (PO4) [17], but different from
those in the raw materials, which can be confirmed by the dis-appearance of the band located at 1260 cm−1
(Fig. 10).
Orthophosphates usually have strong and broad absorptions in 1150–1000 cm−1[35–38]. The band at 1110 cm−1was previously
re-ported for the formation of a sodium calcium orthophosphate hydrate salt NaCaPO4∙xH2O (SCOP salt) [17], and this type of product appears
to be presented in CAP35 sample.
In the samples cured at 60 °C and 95 °C, the main absorption band is slightly shifted towards lower wavenumber (~1056 cm−1), suggesting
that the type of phosphate formed is likely different from that in CAP35. This band can be assigned to theνasPeO bonds and could be related to
a poorly crystallised hydroxyapatite detected by XRD in Fig. 3 (b) [35–38]. A well crystallised hydroxyapatite usually shows three ab-sorption bands at around 1070, 1040 and 960 cm−1 [4–5,39]. This
band at 1056 cm−1
may also be associated with an amorphous dibasic calcium phosphate Ca(HPO4)∙xH2O, which has been previously identi-fied in a similar system, showing its main band at 1060 cm−1[40]. This
[image:8.595.312.549.58.521.2]phase has been shown to be another precursor phases of hydroxialpatite Fig. 12.FTIR spectra of CAP cements cured at different temperatures (35, 60,
95 and 180 °C).
(a)
(b)
(c)
[image:8.595.42.284.59.250.2][38]. An amorphous Ca(HPO4)∙xH2O could potentially coexit with the
poorly crystallysed hydroxialpatite.
For CAP180, the main band is located around 1102 cm−1 and
1018 cm−1
. This is similar to the CAP35 and could be due to the for-mation of NaCaPO4∙xH2O as also discussed in TG data (Fig. 9).
How-ever, differing from CAP35, a weak peak at 1260 cm−1associated with
P]O bonds in raw materials is observed, confirming the presence of the
unreacted raw materials. Two groups of bands at 900–800 cm−1
and 700–600 cm−1are also detected, most-likely associated with the Al
eO
groups in AlO4 and in AlO6 respectively, also attributed to the
un-reacted clinker phase. As consequence of the fast evaporation of the water at above 100 °C, the amount of unreacted Secar 51 appears to be greater in this sample.
These results suggest that different types of amorphous phosphate salts can form as a result of the reaction between the phosphate species and the Ca2+ions in the CAP system, depending on the curing
condi-tion. A certain level of temperature and water content appear to favour the formation of amorphous Ca(HPO4)∙xH2O type product. In the other
conditions, when the temperature is low (35 °C), or when the most of the water content is lost (180 °C), the system prefers amorphous NaCaPO4∙xH2O type product. Both the amorphous Ca(HPO4)∙xH2O and
NaCaPO4∙xH2O type products are likely to co-exist with a poorly
crys-tallised hydroxylapatite, as Sugama et al. observed the evolution of these two phases to hydroxylapatite under thermal treatments [4,5,17]. It should be also noted that the absorption at 700–500 cm−1 is
sig-nificant in those cured at 35, 60 90 °C, showing the presence of AlO6
group. Together with the TG data (Fig. 9), it suggests that the alumi-nium has an AH3-like environment in these reaction products. This is in
accordance to the studies by Sugama et al. [4,5,17]. It is, however, difficult to clarify whether this is a separate AH3phase or a part of the
amorphous phosphate phases identified above. A close proximity of aluminium with phosphorus, and a potential incorporation of alumi-nium in the phosphate phase have been reported for a similar system [20].
3.4. Effects of water reduction on microstructures
3.4.1. Porosity of CAC and CAP
The total porosity and the average pore size diameter of CAC and CAP systems are shown inFig. 13(a). The tested samples indicated a similar level of porosity, but a significantly higher porosity in the samples cured at 180 °C for both systems, due to the significant loss of water content at this temperature. In the CAC cements the porosity tends to decrease with the increasing of the curing temperature up to 95 °C, whereas the CAP cements indicated an opposite trend. The average pore diameter in the CAP cements is much smaller than that in CAC cements.
The pore size distribution for CAC and CAP cements are shown in
Fig. 13(b) and (c) respectively, where the smaller pore size in the CAP cements is easily observable. The CAC cement cured at 35, 60 and 90 °C indicated the largest distribution of pores around 1 nm, whereas the largest distribution of pores was at 10–20 nm for 180 °C. The CAP ce-ments also indicated a similar shift of the pore size distribution for 180 °C, but in a smaller scale. The CAP system also indicated a sig-nificant pore distribution additionally in the range of 10–100 nm when cured at 180 °C. It is also noticeable in the CAP system that the pore size
(a)
(b)
(c)
[image:9.595.71.526.56.425.2](d)
distribution slightly shifts towards smaller size for 60 and 90 °C com-pared with 35 °C.
3.4.2. Microstructures of CAC and CAP
Backscattered electron (BSE) images for CAC cements are shown in
Fig. 14. All CAC samples had similar microstructures, with unreacted (or partially reacted) CAC clinker shown as angular particles in a lighter grey surrounded by porous matrix. This is reasonable because the dif-ferent curing temperatures (35, 60 and 95 °C) resulted in a similar level of water reduction, with 65–70% of the original water content (Fig. 2(b)). Even at 180 °C, 40% of water remained in the system, suggesting a significant amount of hydration products were formed in the system.
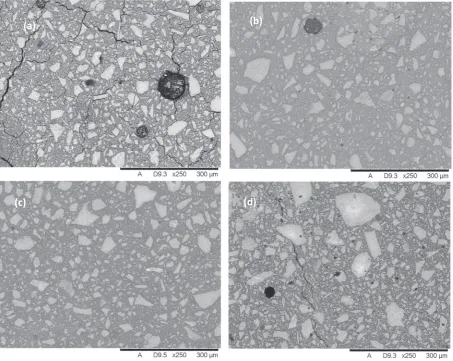
As shown inFig. 15, the microstructure of the CAP cements is very different from that of the CAC cements. The unreacted (or partially reacted) CAC clinker particles are surrounded by a dense matrix (dark grey area) with little microporosity, which agrees with their smaller pore size observed in the MIP results. Another feature of the CAP system is the presence of large spherical pores with a diameter ranging from 100μm to 1 mm. Some of the examples are observable inFig. 15. Sig-nificantly large pores (> 2 mm) are not detectable by MIP. The pre-sence of these pores can be associated with the evaporation of free water but also with the air trapped into the systems due to the higher viscosity of the CAP pastes.
CAP35 had a significant amount of cracks. Cracks has been observed previously in similar phosphate-modified systems and can be associated with the shrinkage, as the temperature of the system become lower after the initial exothermic acid-base reaction between the basic CAC
cement and the acidic phosphate solution [4,6–7]. These cracks may also be due to the dehydration of an amorphous calcium phosphate components which partially lose their bounded water over time [27].
In contrast, the CAP cements cured at 60 and 95 °C showed a smooth matrix with little microcracks. The reduction of cracks can be explained as an effect of the moderately elevated curing temperature. A similar phenomenon has been reported for phosphate cements cured with a hydrothermal treatment [27]: the use of elevated temperature modified the pore size distribution, and favored the formation of more stable products with less water, allowing to prevent or minimise the bulk shrinkage during the treatment. As discussed in the previous section, the pore size distribution was slightly shifted towards smaller size for 60 and 95 °C, and this seems to have had a positive influence to avoid the cracks. It is also possible that amorphous Ca(HPO4)∙xH2O was
contributing to reduce the amount of crack. This phase was suggested by FTIR data only for the CAP cured at 60 and 95 °C, whereas amor-phous NaCaPO4∙xH2O was suggested for 35 and 180 °C. According to
the literature, moderate growth of a poorly crystalline hydoxylapatite (detected by XRD) could also provide a linking function, connecting the amorphous phase [4].
CAP cured at 180 °C shows the large spherical pore and significant cracks. These cracks, in this case, are mostly associated with the rapid evaporation of water. This sample have lost most of water content at the very early stage of curing.
Fig. 16shows a BSE micrograph of the CAP95 sample in more detail, together with the EDX elemental maps of calcium, aluminium phos-phorous and sodium. The elemental maps show that the amorphous phase has a significant amount of P and Na, with less amount of Ca and
(a)
(b)
[image:10.595.72.526.58.419.2](c)
(d)
Al. This may suggest that the amorphous phase also contain a type of amorphous sodium phosphate which is different from those used as starting materials. It is also probable that the amorphous calcium phosphate phase formed in this system, i.e. Ca(HPO4)∙xH2O,
in-corporates Na ions in its structure by ionic exchange mechanism to replace Ca2+with 2Na+, however some of the sodium could also be
adsorbed onto this phase in the same way that has been observed in C-S-H gels [41].
4. Conclusions
✓It was possible to reduce water contents from the system both for CAC and CAP samples by curing the cement systems in moderately elevated temperatures. For the CAC, the level of water reduction was restricted by the rapid formation of hydrogarnet and gibbsite, since water was incorporated as a part of their crystal structures with minimal amount of free water. The water content was reduced to 65% of the original content at 95 °C in 28 days. For the CAP, the formation of amorphous products allowed the gradual reduction of water content through a diffusion process during the curing period, and the water content was reduced to 40% of the original content at 95 °C in 28 days.
✓Curing CAP samples at 60 °C and 95 °C helped to reduce the typical cracking observed in CAP cements cured at 35 °C, developing a good cementitious matrix with a smaller pore size. However, curing CAP samples at 180 °C was found unsuitable, as it involves a fast eva-poration of water, causing unfavorable cracks and porosity in the microstructure, and therefore making the CAP matrix difficult to be applied for the waste management.
✓The main binding phases formed in the CAC system were hydro-garnet and gibbsite at all curing temperatures whereas those in the CAP system appeared to be a combination of different amorphous products; NaCaPO4∙nH2O type product for 35 °C, and Ca(HPO4) ∙xH2O type product with incorporation of Na ions for 60–95 °C. The
latter may have contributed to reduce the cracking of the binding matrices. These phases may coexist with poorly crystallised hydro-xyapatite, especially at 60–95 °C. Aluminium in the CAP was found to have an environment similar to AH3, which may be a separate
amorphous AH3phase or a part of the amorphous phosphate phases.
Acknowledgements
This work was funded by the Engineering and Physical Sciences Research Council, UK (EP/N017684/1) and the Japan Science and Technology Agency, Japan (research grant No. 273604). The experi-mental work was performed in part at the MIDAS Facility, at the University of Sheffield, which was established with support from the Department of Energy and Climate Change.
References
[1] http://www.tepco.co.jp/en/decommision/planaction/alps/index-e.html, Accessed date: 24 October 2017.
[2] G. Saji, Review on water radiolysis in the Fukushima Daiichi Accident- Potential cause of hydrogen generation and explosion, Proceedings of the 22nd International Conference on Nuclear Engineering ICONE22 July 7-11, 2014 (Prague, Czech Republic ICONE22-30991).
[3] S. Le Caër, Water radiolysis: influence of oxide surfaces on H2production under
ionizing radiation, Water 3 (2011) 235–253.
[4] T. Sugama, M. Allan, J.M. Hill, Calcium phosphate cements prepared by acid–base reaction, J. Am. Ceram. Soc. 75 (8) (1992) 2076–2087.
[5] T. Sugama, N.R. Carciello, Strength development in phosphate-bonded calcium aluminate cements, J. Am. Ceram. Soc. 74 (5) (1991) 1023–1030.
[6] P. Swift, H. Kinoshita, N.C. Collier, C.A. Utton, Phosphate modified calcium alu-minate cement for radioactive waste encapsulation, Adv. Appl. Ceram. 112 (2013) 1–8.
[7] W. Ma, P.W. Brown, Hydration of sodium phosphate modified high alumina ce-ment, J. Mater. Res. 9 (5) (1994) 1291–1297.
[8] M.A. Chavda, H. Kinoshita, J.L. Provis, Phosphate modification of calcium alumi-nate cement to enhance stability for immobilization of metallic wastes, Adv. Appl. Ceram. 113 (8) (2014) 453–459.
[image:11.595.45.548.57.362.2][9] F.P. Glasser, Chemistry of cement-solidified waste forms, in: R.D. Spence (Ed.), Chemistry and Microstructure of Solidified Waste Forms, Lewis Publisher, USA,
1993, pp. 1–39.
[10] M.I. Ojovan, W.E. Lee, An Introduction to Nuclear Waste Immobilisation, Elsevier, Oxford, 2005.
[11] A.M. Neville, P.J. Wainwright (Eds.), High Alumina Cement Concrete, Wiley, New York, 1975.
[12] Q. Zhou, N.B. Milestone, M. Hayes, An alternative to Portland cement for waste encapsulation—the calcium sulfoaluminate cement system, J. Hazard. Mater. 136 (1) (2006) 120–129.
[13] I. Navarro-Blasco, A. Duran, R. Sirera, J.M. Fernandez, J.I. Alvarez, Solidification/ stabilization of toxic metals in calcium aluminate cement matrices, J. Hazard. Mater. 260 (2013) 89–103.
[14] J.L. García Calvo, M.C. Alonso, A. Hidalgo, L. Fernández Luco, V. Flor-Laguna, Development of low-pH cementitious materials based on CAC for HLW repositories: long-term hydration and resistance against groundwater aggression, Cem. Concr. Res. 51 (2013) 67–77.
[15] K.L. Scrivener, A. Campas, Calcium aluminate cements, in: P.C. Hewlett (Ed.), Lea’s Chemistry of Cement and Concrete, 4th Edn, Butterworth-Heinemann, Oxford, 2006, pp. 711–782.
[16] K.L. Scrivener, J.-L. Cabiron, R. Letourneux, High-performance concretes from calcium aluminate cements, Cem. Concr. Res. 29 (1999) 1215–1223.
[17] T. Sugama, N.R. Carciello, Sodium phosphate-derived calcium phosphate cements, Cem. Concr. Res. 25 (1995) 91–101.
[18] W. Ma, P.W. Brown, Mechanical behavior and microstructural development mod-ified high alumina cement, Cem. Concr. Res. 22 (1992) 1192–1200.
[19] H. Kinoshita, P.D. Swift, C.A. Utton, B. Carro-Mateo, G. Marchand, N.C. Collier, N. Milestone, Corrosion of aluminium metal in OPC- and CAC-based cement ma-trices, Cem. Concr. Res. 50 (2013) 11–18.
[20] M.A. Chavda, S.A. Bernal, D.C. Apperley, H. Kinoshita, J.L. Provis, Identification of the hydrate gel phases present in phosphate-modified calcium aluminate binders, Cem. Concr. Res. 70 (2015) 21–28.
[21] D.V. Ragone, Thermodynamics of Materials, Volume II John Wiley & Sons, Inc., New York, 1995.
[22] M. Perez, T. Vazquez, Treviño, Study of stabilized phases in high alumina cement mortars. Part 1: hydration at elevated temperatures followed by carbonation, Cem. Concr. Res. 13 (1983) 759–770.
[23] S.M. Bushnell-Watson, J.H. Sharp, The application of thermal analysis to the hy-dration and conversion reactions of calcium aluminate cements, Mater. Constr. 42 (1992) 13–32.
[24] M. Takahashi, T. Fujita, Effect of the water in cement paste for hydrogen gas generated by gamma-ray irradiation, CRIEPI Report, 2013, p. L11020http://criepi. denken.or.jp/jp/kenkikaku/report/detail/L11030.html.
[25] S.J.M. Duarte Chavez, Sintesis y caracterizacion de fosfatos de calcio por el método sol-gel, Thesis work Universidad Nacional de Asunción (2012) (San Lorenzo
Paraguay).
[26] Y. Kojima, K. Sakama, T. Toyama, T. Yasue, Y. Arai, Dehydration of water molecule in amorphous calcium phosphate, Phosphorous Res. Bull. 4 (1994) 47–52. [27] M. Alshaaer, H. Cuypers, H. Rahier, J. Wastiels, Production of monetite-based
in-organic phosphate cement (M-IPC) using hydrothermal post curing (HTPC), Cem. Concr. Res. 41 (2011) 30–37.
[28] M.T. Palou, L. Bagel, V. Zivica, M. Kulliffayova, T. Ifka, Hydration of high alumina cement-silica fume composite with addition of Portland cement or sodium poly-phosphate under hydrothermal treatment, J. Therm. Anal. Calorim. 113 (2013) 385–394.
[29] J.M. Villora, P. Callejas, M.F. Barba, Métodos de síntesis y comportamiento térmico del Hidroxiapatito, Bol. SECV 41 (5) (2002) 443–450.
[30] Tao Wang, Annett Dorner-Reisel, Eberhard Muller, Thermogravimetric and ther-mokinetic investigation of the dehydroxylation of a hydroxyapatite powder, J. Eur. Ceram. Soc. 24 (2004) 693–698.
[31] T. Sugama, N.R. Carciello, Carbonation of calcium phosphate cements after long-exposure to Na2CO3- laden water at 250°C, Cem. Concr. Res. 23 (1993) 1409–1417.
[32] P. Tarte, Infrared spectra of inorganic aluminates and characteristic vibrational frequencies of AlO4tetrahedra and AlO6octahedra, Spectrochim. Acta 23 (1967)
2127–2143.
[33] L. Fernandez-Carrasco, F. Puertas, M.T. Blanco-Varela, T. Vazquez, Carbonation of calcium aluminate cement pastes, Mater. Constr. 51 (2001) 127–136.
[34] A. Hidalgo, J.L. Garcia, M.C. Alonso, L. Fernandez, C. Andrade, Microstructure development in mixes of calcium aluminate cements with silica fume orfly ash, J. Therm. Anal. Calorim. 96 (2) (2009) 335–345.
[35] D.E.C. Coybridge, E.J. Lowe, The infra-red spectra of some inorganic phosphorus compounds, J. Chem. Soc. (1954) 493–502.
[36] F.A. Miller, C.H. Wilkins, Infrared spectra and characteristic frequencies of in-organic ions, Anal. Chem. 24 (1952) 1253–1294.
[37] Y.M. Moustafa, K. El-Egili, Infrared spectra of sodium phosphate glasses, J. Non-Cryst. Solids 240 (1998) 144–153.
[38] Hongting Liu, Yadong Lu, Ya Qu, Hao Lu, Yunlong Yue, Effect of the content of Al2O3on structure and properties of calcium-phosphate glasses: two experimental
case studies, J. Non-Cryst. Solids 450 (2016) 95–102.
[39] L. Berzina-Cimdina, N. Borodajenko, Research of calcium phosphates using Fourier transform infrared spectroscopy infrared spectroscopy, Mater. Sci. Eng. Technol. 6 (2012) 123–148.
[40] T. Sugama, L.E. Brothers, L. Weber, Calcium aluminate cements infly ash/calcium aluminate blend phosphate cement systems: their role in inhibiting carbonation and acid corrosion at low hydrothermal temperature of 90°C, J. Mater. Sci. 37 (2002) 3163–3173.