A Tutorial on Modeling Interaction using Economics
Leif Azzopardi1 and Guido Zuccon2
1
Dept. of Computer and Information Sciences, University of Strathclyde, Glasgow, Scotland
2 School of Electrical Engineering and Computer Science, Queensland University of
Technology (QUT), Brisbane, Australia [email protected]
Abstract. This chapter provides a tutorial on how economics can be used to model the interaction between users and systems. Economic the-ory provides an intuitive and natural way to model Human-Computer In-teraction which enables the prediction and explanation of user behaviour. A central tenet of the approach is the utility maximisation paradigm where it is assumed that users seek to maximise their profit/benefit sub-ject to budget and other constraints when interacting with a system. By using such models it is possible to reason about user behaviour and make predictions about how changes to the interface or the users inter-actions will affect performance and behaviour. In this chapter, we de-scribe and develop several economic models relating to how users search for information. While the examples are specific to Information Seeking and Retrieval, the techniques employed can be applied more generally to other human-computer interaction scenarios. Therefore, the goal of this chapter is to provide an introduction and overview of how to build economic models of human-computer interaction that generate testable hypotheses regarding user behaviour which can be used to guide design and inform experimentation.
1
Introduction
interaction is framed as an economic problem, we can examine what actions lead to accruing the most benefit for a given cost or incur the least cost for a given level of benefit, from which it is then possible to determine what is the optimal course of action that a rational usershouldtake given the task, interface, context and constraints.
Let’s consider a simple example: your friend has just completed a marathon, and you are curious to know how long it took them to complete the race3. You have arrived at the web page showing all the times and names of runners, ordered by time. You consider two options: (i) scrolling through the list, or (ii) using the “find” command4. The first option would mean scrolling through on average about half the list of names, while the second would require selecting the find command, typing in their name, and then checking through the matches. Unless the list is very small, then the second option is probably going to be less costly (i.e. less comparisons) and more accurate5. In this example, it may seem obvious that using the “find” option would be preferable in most cases - and indeed it is reasonably trivial to develop a simple model of the costs and benefits to show at what point it is better to use the “find” option over the “scroll” option, and vice versa. However, even to arrive at such an intuition, we have made a number of modelling assumptions:
1. that the user wants to find their friend’s performance (and that the said friend took part in the marathon),
2. that the user knows and can perform both actions,
3. the currency of the costs/benefit is in time i.e. time spent/saved, and, 4. that the user wants to minimize the amount of time spent completing the
task.
Such assumptions provide the basis for a formal model to be developed. The last assumption is common to most economic models. This is because they are a type of “optimization” model [31, 32, 38, 37], which assumes that people attempt to maximise their profit given their budget (costs) or minimize their budget expenditure given some level of profit. The other assumptions serve as constraints which are a result of the environment, the limitations of the person, and/or the simplifications made by the modeller. By engaging such an assumption, the model can be used to consider the trade-offs between different strategies, reason about how users will adapt their behaviour as the costs and benefit change, and make predictions about their behaviour. Consequently, economic models go beyond approaches which just focus solely on cost (e.g. GOMS-KLM[14], Fitt’s Law[19], Hick’s Law[22], etc.), as economic models also consider the benefit and profit that one derives from the interaction. This is an important difference, because not all tasks are cost/time driven where the goal is to reduce the time
3
This example is based on a study conducted in [42], where people were challenged to undertake such a task.
4
Note that we have assumed that you are familiar with using the “find” command (e.g.CTRL-f, CMD-f, etc). Of course, not all users are familiar with, or even aware that this option is available.
5
taken or minimize friction. For example, when should an author stop editing a paper, when should an artist stop photoshopping an image, when should a researcher stop searching for related works? In the above example, the different options have varying degrees of accuracy when employed to find the correct runner’s name and subsequent time. This is because as the number of items in the list increases the chance of missing or skipping over an item also increases, thus decreasing the accuracy. So in this case, there is a trade-off between the speed (minimising time taken to complete the task) and the accuracy (finding the correct time). Also when using the “find” option, there is another trade-off between the number of letters entered (typing cost) versus the number of matching names (scanning costs, and thus accuracy). In such tasks, it is clear that understanding the trade-off between the benefits and the costs of different interaction strategies can help predict user behaviour. Economic models can help to draw insights into these trade-offs and understand when one strategy (sequence of actions) is better to perform than another or what strategy to adopt under different circumstances.
In economic models, it is commonly assumed that users are economic agents that are rational in the sense that they attempt to maximize their benefits, and can learn to evolve and adapt their strategies towards the optimal course of interaction. Thus the theory is normative, and gives advice on how a rational usershouldact given their knowledge and experience of the system. Going back to the example above, if a user is not aware of the “find” option, then they will be limited in their choices, and so they would select the “scroll” option (or, choose not to complete the task, i.e. the “do nothing” option). However, when they learn about the existence of the “find” option, perhaps through exploratory interactions or from other users, then they can decide between the different strategies. While assuming that users are rational may seem like a rather strong assumption, in the context of search a number of works [6, 39, 44, 45] have shown that users adapt to systems and tend to maximize benefit for a given cost (e.g. subscribe to the utility maximisation paradigm [46]) or minimize cost for a given level of benefit (e.g. subscribe to the principle of least effort [52])6. So a user, knowing of the “find” option would select it when the list of items is sufficiently long such that employing the find command is likely to reduce the total cost incurred. Once we have a model, we can then test such hypotheses about user behaviour, e.g. given the cost of using the find command, the cost of scanning items, etc. then we may hypothesise that when the length of the list is over say two pages, it is more efficient to use the “find” option - and then design an experiment to test if this assertion holds in practice (or not) in order to (in)validate the model.
During the course of this chapter, we will first provide an overview of eco-nomic modelling in the context of HCI where we will formalise the example above by developing two models that lead to quantitative predictions regarding which option a user should employ (i.e. “find” or “scroll”), and, how they should use
6 Note that essentially these optimisations objectives are two sides of the same coin and arrive at
the “find” command, when chosen. Following on from this finding example, we will then consider three further search scenarios related to information seeking and retrieval, where we will develop models of: (i) querying, (ii) assessing and (iii) searching. The first model will be provide insights into query length and how to encourage longer or shorter queries. The next model will provide insights into when to stop assessing items in a ranked list of results and how to design different result pages for different result types. The third model on searching will examine the trade-off between issuing queries and how many documents to examine per query during the course of search session. This will lead to a number of insights into where the system can be improved and how users will respond to such changes. While these models are focused on search and search behaviour, similar models could be developed to help describe how people browse products, play games, use messaging, find apps, enter text, and so on. In the next section, we will describe a framework for building economic models of interaction that can be used to build your own models, that inform your designs and guide your experimental research.
2
Economic Models
An economic model is an abstraction of reality, that is a simplified description of the phenomena in question, designed to yield hypotheses about behaviour that can be tested [36]. There are two types of economic models:theoretical and
empirical.
Theoretical models aim to develop testable hypotheses about how people will behave and assume that people are economic agents that maximise specific objectives subject to constraints (e.g., amount of time available for the task, knowledge of potential actions, etc.). Such models provide qualitative an-swers to questions such as, how does the cost of querying affect the user’s behaviour, if the benefit of query suggestions increases, how will user’s adapt? Empirical models aim to evaluate the qualitative predictions of theoretical models and realise the predictions they make into numerical outcomes. For example, consider a news app that provides access to news articles for a small payment, and a theoretical model that says that if the cost of accessing news articles increases, then users will reduce their consumption of such articles. Then an empirical model would seek to quantify by how much consumption will drop given a price increase.
the cost of the article. The less expensive the news articles, the more that they are demanded according to such model. Models however can be much more complex consisting of non-linear, interconnected differential equations that for example predict the flow and transmission of fake news through a social network [25].
Building Economic ModelsVarian has described how to approach the prob-lem of building a useful economic model [47] (which is similar to other model building approaches [12, 15, 32]). The main steps involved when building eco-nomics models are:
1. Describe the problem context,
2. Specify the functional relationships between the interactions and the cost and benefit of those interactions,
3. Solve the model,
4. Use the model to generate hypotheses about behaviours,
5. Compare the predictions with observations in the literature and/or experi-mental data, and,
6. Refine and revise the theory accordingly, and iterate the procedure.
Step 1 - Describe the Problem Context: First off, outline what is known about the problem context, the environment and the interface(s) in which the interaction is occurring. It may also help to illustrate the interface(s), even if hy-pothetical, that the user population will be using. For example, we may want to consider how facets when added to a shopping interface would affect behaviour, and so draw a faceted search interface from which we can consider different ways in which the user can then interact with it [27]. According to Varian all economic models take a similar form, where we are interested in the behaviour of some economic agents [47]. These agents make choices to advance towards their ob-jective(s). And these choices need to satisfy various constraints based upon the individual, the interface and the environment/context. This leads to asking the following questions:
– who are the people making the choices? – what are their constraints?
– how do they interact with the interface? and
– what factors/constraints in the environment are likely to affect the interac-tion?
time taken to find their name. Since time is at a premium, we have a constraint such that we want to complete the search within a certain period of time (after which we may give up), or, if we believe we could not complete the task within the time constraint, then we may decide not to search at all. In this later case, where we decide not to search, we may take some other action like asking our friend. Though, of course, we would like to keep the initiative in the conversation from which we will derive benefit. In terms of interaction with the page, if we (i) scroll, then we plan to look down the list, one by one, and see if we recognise our friend’s name in the list, while if we (ii) use command find, we plan to type in a few letters of their name, and step through each matching name. In both cases, we also acknowledge that there is some chance of skipping over their name and so there is some probability associated with finding their name - such that as the list of names that has to be checked increases, the chance of missing also increases. We also can imagine that in case (ii) if we enter more letters the list of names to check decreases proportionally with each additional letter. We can now formalise the problem with a series of assumptions (like those listed in Section 1), and then start to model the process mathematically.
Step 2 - Specify the Cost and Benefit functions: For a particular strat-egy/choice, we need to identify and enumerate the most salient interactions which are likely to affect the behaviour when using the given interface. At this point, it is important to model the interaction at an appropriate level - too low and it becomes unwieldy (i.e. modelling every keystroke), too high and it be-comes uninformative (i.e. simply considering the aggregated cost/benefit of the scroll option vs. the cost/benefit of find option). Varian [47] suggests to keep this as simple as possible:
“The whole point of a model is to give a simplified representation of reality...your model should be reduced to just those pieces that are required to make it work”.
So initially focus on trying to model the simplest course of action, at the high level possible, to get a feel for the problem, and then refine. If we start too high level, we can then consider what variables influence the cost of the scroll option (i.e. the length of the list), and start to parameterise the cost function, etc. We can also reduce the complexity of the interaction space, so, for example, in the facet shopping interface, we might start with one facet, and then progress to two facets. Essentially, make the problem simple and tractable to understand what is going on. The simple model that is developed will probably be a special case or an example. The next important step is to generalize the model, e.g., how do we model f facets?
In our scenario, for option (i) we need to perform two main actions: scroll (scr) and check (chk), where we will assume that the cost of a scroll is per item (cscr), and the cost of checking the name is also per item (cchk). In the worse
then, the cost of option (i) would be:
C(i)(N) =
N·(cscr+cchk)
2 (1)
We also know that the benefit is proportional to our likelihood of success and that is conditioned on how many items we need to check through, so we can let the probability of successfully finding our friend’s name bepscr(N). Thus we
can formulate an expected benefit function, i.e. the benefit that we would expect to receive on average:
B(i)(N) =pscr(N)·b (2)
wherebis the benefit, e.g., the time saved from having to hear your friend going on and on about how you are not interested in them, and how you couldn’t even find it on the computer, etc. Now we can create a profit function to denote how much time we expect to save/lose if we take this option. A profit function is the difference between the benefit function and the cost function:
π(i)=B(i)(N)−C(i)(N) =pscr(N)·b−
N(cscr+cchk)
2 (3)
On the other hand, for option (ii), we need to perform a different sequence of actions: command find (cmd), type (typ), skip (skp) and check (chk), where we will assume that the cost to evoke command find isccmd, to type in a letter
isctypand to skip to the next match iscskp. For simplicity, we will assume the cost of a skip and the cost of a scroll be the same cskp=cscr. The course of
interaction is press command find, type inm letters, and then skip through the results, checking each one. Since typing inm letters will reduce the number of checks, we assume that there is a functionf(N,m), which results in a list ofM to check through (and as m increases, M decreases). Again we are concerned with the average case, if there areMmatches, then we’d only need to examine approximately half, i.e. M/2. Putting this all together, we can formulate the following cost function, which takes in both the size of the list and the number of letters we are willing to enter:
C(ii)(N,m) =ccmd+m·ctyp+
M(cscr+cchk)
2 (4)
We can also formulate the benefit function, which also takes inNandm as follows:
B(ii)(N,m) =pscr f(N,m)
·b=pscr(M)·b (5)
where, sinceMwill be typically much smaller thanN, the expected benefit will typically be higher. Again we can formulate a profit functionπ(ii)by taking the difference between the benefit and cost function.
be achieved through various means: analytically, computationally or graphically. For example, we could determine which option would be more profitable, π(i) or π(ii), by taking the difference and seeing under what circumstances option (i) is better than (ii), and vice versa. We could achieve this analytically, i.e. if π(i)> π(ii), then select option (i), else (ii). Alternatively, we could instantiate the model, with a range of values, and plot the profit functions of each to see when π(i)> π(ii), and under what conditions. Or in the case of option (ii), we could consider the tradeoff between typing more letters and the total time to find the name - and find the optimal number of letters to type. Note, above we have not specified the form of the functionsf(N,m) orpscr(.); so in order
to solve or plot, we would need to make some further assumptions, or look to empirical data for estimating functional forms.
So if we are interested in deciding which option to take, then we can try and solve the inequalityπ(i)> π(ii), which we can reduce to:
ccmd+m·ctyp>(N−M)·(cscr+cchk) (6)
where we have assumed thatp(N) is approximately equal top(M) for the sake of simplicity i.e. we are assuming that the two methods perform the same (even though this is probably not the case in reality). To plot the model graphically, we further assumed that, f(N,m) =(mN+1)2, to reflect the intuition that more letters entered will reduce the number of names to check. Later we could also empirically estimate the form based on a computational simulation, i.e. given a list of names, we could count how many names are returned, on average, whenN andm are varied in order to gather actual data to fit a function. Next we have to provide some estimates of the different costs. Here, we have setctypto be 1
second per letter, ccmd to be 15 seconds,cscr and cskp to be 0.1 seconds per
scroll/skip and cchk to be 0.5 seconds per name check. Of course, these values
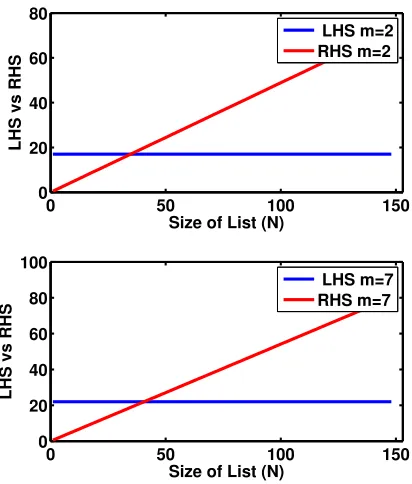
are only loosely based on the time taken to perform such actions. To create a more precise instantiation of the model, we would need to empirically ground these values. Part of the model building process involves iteratively refining the parameters and their estimates based on observed data. But, initially, we can get a “feel” for the model by using some reasonable approximations. Figure 1 shows a plot of the inequality whenm=2(top) andm=7(bottom).
Now, focusing on option (ii), we can calculate the optimal way to interact when using the find command, i.e. how many letters should we type? To do this, we can consider maximising the profit with respect to the number of letters we need to type (as this reduces the number of possible matches to skip through). To achieve this, we instantiate the profit function for option (ii), where we assume, for simplicity, thatpscr(M) =1, such that:
π(ii)=b−
ccmd+m·ctyp+
N
2·(m+1)2(cscr+cchk)
(7)
then we can differentiate the profit function with respect tomto arrive at:
dπ(ii)
dm =−ctyp+N·(cscr+cchk)·(m+1)
0 50 100 150 0
20 40 60 80
Size of List (N)
LHS vs RHS
LHS m=2 RHS m=2
0 50 100 150
0 20 40 60 80 100
Size of List (N)
LHS vs RHS
[image:9.612.197.403.129.371.2]LHS m=7 RHS m=7
Fig. 1.Top: Plot of the inequality when only 2 letters are entered, Bottom: Plot of the inequality when 7 letters are entered, where if LHS>RHS then scroll, else use the find command. The plots suggest that once the size of the list is greater than 30-40 items, using the find command is less costly. But asmincreases, a longer list is required to justify the additional typing cost.
Setting dπ(ii)
dm =0, we obtain the following expression form
?, which is the optimal
number of letters to enter for a list size ofN:
m?=
N·(cscr+cchk)
ctyp
13
−1 (9)
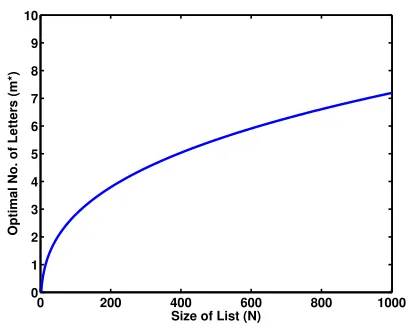
Figure 2 shows a plot of the optimal number of letters (m?) asNincreases. As expected, more letters are required asNincreases, but at a diminishing rate.
Step 4 - Use the model and hypothesise about interaction: Given the models created above, we can now consider: how different variables will influ-ence interaction and behaviour, find out what the model tells us about optimal behaviour, and see what hypotheses can be generated from the model.
0 200 400 600 800 1000 0
1 2 3 4 5 6 7 8 9 10
Size of List (N)
[image:10.612.202.405.121.283.2]Optimal No. of Letters (m*)
Fig. 2.Top: Plot ofm?versus the size of the result list (N).
reduction in M, which is of course proportional to m. From the plots, we can see that moving from m=2 to m=7 does not have a dramatic impact on when we’d decide to scroll or find. However, a longer list is needed to warrant the entry of more letters. Furthermore, from the graphs, we can see that, in these examples, once the list contains more than 40-50 names, it is better to use the find command. Exactly, where this point is, depends on how we estimate the various costs and instantiate the functions used. However, it is possible to create hypotheses about how people would change their behaviour in response to different circumstances. For example, we could imagine a similar scenario where the cost of comparison is very high, because we are trying to match a long unique number that represents each runner instead (and so hypothesise that using the find command is preferable when lists are even shorter).
From Eq. 9 and Figure 2, we can see that as the list size increases the optimal number of letters to enter (given our model) increases, such that 4 letters are optimal when the list is around 250 in size, while around 7 letters are required when the list grows to 1000. Given these estimates, we can then hypothesise that for large lists (around 1000 in size), users will tend to enter, on average, 7 letters, while for shorter lists (around 200-300), users will tend to enter, on average, 4 letters.
Step 5 - Compare with observed behaviour: The next step is to determine whether the hypothesis made using the model are consistent with with empiri-cal observations from the literature, and/or to validate the model by designing empirical experiments that explicitly test the hypotheses.
From the experimental data, we may discover that, for instance, users performed in a variety of ways we did not consider or that we ignored. For example, maybe a significant proportion of users adopted a mixed approach, scrolling a bit first, then using the find command. Or when they used the find command, they mis-spelt the name or couldn’t remember the exact spelling, and so there is some probability associated with entering in the correct partial string to match the name. As a consequence, we find that the model, or the estimates, need to be refined, and so the final step (6) is to iterate: refining and revising the model and it’s parameters accordingly. Once we have conduced an empirical investigation, we can better estimate the costs and benefits. Alternatively, they allow us to develop new models to cater for different interactions and conditions. With this respect, Box notes that:
“All models are wrong but some are useful”. [12]
He points out that it would be remarkable if a simple model could exactly represent a real world phenomena. Consequently, he argues that we should build parsimonious models because model elaboration is often not practical, but adds increased complexity, without necessarily improving the precision of the model (i.e. how well the model predicts/explains the phenomena). This is not to say that we should be only building very simple models; instead, Box [12] argues we should start simple, and then only add the necessary refinements based on our observations and data, to generate the next tentative model, which is then again iterated and refined, where the process is continued depending on how useful further revisions are judged to be. That is, there is a trade-off between the abstraction of the model and the predictions that it makes - the less abstracted, the greater the complexity, with perhaps increased model precision. Therefore, the refinements to the model can be evaluated by how much more predictive or explanatory power the model provides about the phenomena.
Following this approach helps to structure how we develop models, and cru-cially how we explain them to others and use the models in practice. The ap-proach we have described here is similar to the methodology adopted when applying the Rational Analysis method [2, 15], which is a more general approach that is underpinned by similar assumptions. However, here we are concerned with building economic models as opposed to other types of formal models e.g. [38, 32, 37, 31]. During the remaining of the chapter, we shall describe three different, but related economic models of human-computer interaction, where a user in-teracts with a search engine. Our focus is on showing how theoretical economics models can be constructed (i.e. steps 1-4) and discuss how they provide insights into observed behaviours and designs.
3
An Economic Model of Querying
directly controls how long their query is, and query length is strongly related to performance [24], as short queries tends to be vague, while a long queries tends to be more specific. Of course, other factors also influence the performance of a query, i.e. the choice of terms, the type of search task, etc. For simplicity, however, we will only focus on length, as the primary factor affecting performance and behaviour. Using the model we wish to answer the following questions.
– what is the trade-off between cost and benefit over length? – what is the optimal length of a query?
– how does the length of a query change when the costs/benefits change?
Problem Context: Before answering these questions, let’s first consider what we know about the length of queries, and how query length relates to perfor-mance. Typically, user queries tend to be short: in a typical web search scenario they have been measured to be around two to three terms in length [3]. On the other hand, it has been shown on numerous occasions that longer queries tend to yield better performance [4, 11, 17], but as queries get longer the performance increases at a diminishing rate [4]. This has led designers and researchers to develop interfaces that try to elicit longer queries from the user[1, 23, 29, 30]. For example, in [1], they used a halo effect around the query box, such that as the user types a longer query the halo changes from a red glow to a blue glow. How-ever, these attempts have largely been ineffectual and have not be replicated outside the lab [23]. So can the model provide insights into why this is the case, why user queries tend to be short, and how we could improve the system to encourage longer queries?
Model: To create an economic model of querying, we need to model the benefit associated with querying and model the cost associated with querying. Let’s assume that the user enters a query of length W (the number of words in the query). The benefit that a user receives is given by the benefit function b(W) and the cost (or effort in querying) defined by the cost function c(W). Here we make a simplifying assumption: that cost and benefit are only a function of query length.
Now let’s consider a benefit function which denotes the situation where the user experiences diminishing returns such that as the query length increases they receive less and less benefit (as shown by Azzopardi [4] and Belkin et al. [11]). This can be modeled with the function:
b(W) =k·loga(W+1) (10)
wherekrepresents a scaling factor (for example to account for the quality of the search technology), andainfluences how quickly the user experiences diminishing returns. That is asa increases, additional terms contribute less and less to the total benefit, and so the user will experience diminishing returns sooner.
Next, let’s assume that the cost of entering a query is a linear function based on the number of words such that:
where cw represents how much effort must be spent to enter each word. This is, of course, a simple cost model and it is easy to imagine more complex cost functions. However the point is to provide a simple, but insightful, abstraction. Optimal Querying Behaviour: Given the cost and benefit functions, we can compute the profit (net benefit) π that the user receives for a query of length W:
π=b(W)−c(W) =k·loga(W+1)−W·cw (12)
To find the query length that maximizes the user’s net benefit, we can dif-ferentiate with respect toW and solve the equation:
∂π
∂W =
k loga ·
1
W+1−cw=0 (13)
This results in:
W?= k cw·loga
−1 (14)
Hypotheses: Figure 3 illustrates the benefit (top) and profit (bottom) as query length increases. For the left plotsk=10, and for the right plotsk=15. Within each plot we show various levels ofa. These plots show that askincreases (i.e. overall the performance of the system increases), the model suggests that query length, on average, would increase. Ifaincreases (i.e. additional terms contribute less and less to the overall benefit), then queries decrease in length. Furthermore the model suggests that as the cost of entering a word,cw, decreases then users
will tend to pose longer queries.
Discussion: This economic model of querying suggests that to motivate longer queries either the cost of querying needs to decrease or the performance of the system needs to increase (either by increasing k or decreasing a). The model provides several testable hypotheses, which provide key insights that inform the design of querying mechanisms and help explain various attempts to encourage longer queries. For example, the query halo does not reduce cost, nor increase benefit, and so is not likely to change user behaviour [23]. On the other hand, the inline query auto-completion functionality now provided by most search engines, reduces the cost of entering queries (e.g., less typing to enter each query term), and also increases the quality of queries (e.g., fewer mis-spellings, less out of vocabulary words, etc. ). Thus according to the model, since the key drivers are affected, queries are likely to be longer when using query auto-completion than without.
0 5 10 0
10 20 30 40
Words
Benefit(w)
0 5 10
−10 0 10 20
Words
Profit(w)
0 5 10
0 20 40 60
Words
Benefit(w)
0 5 10
−20 0 20 40
Words
[image:14.612.152.454.126.369.2]Profit(w)
Fig. 3.The top plots show the benefit while the bottom plots show the profit as the length of the query increases. Plots on the right show when the queries yield greater benefit (left k=10; right k=15). Each plot shows three levels of a which denotes how quickly diminishing returns sets in.
For instance, if our search engine employed an implicit Boolean “AND” between terms, then as the number of query terms increases the number of results re-turned decreases - and so fewer and fewer relevant items are rere-turned (if any). In this case, we would need to employ a different benefit function to reflect and capture this relationship. It is only when we empirically explore, either through an analysis of query logs [23], user judgements and ratings [48], or computa-tional simulations [4, 5] that we can test and refine the model, updating the assumptions and cost/benefit functions/parameters.
4
A Model of Assessing
have been conducted examining the question of when users decide to stop. The general finding is that users stop when they have found “enough” [18, 40, 50]. Other research has suggested that people employ stopping rules, such as, stop afternnon-relevant results [16] or stop when the results do not provide any new information [13]. While these rules are reasonably intuitive, perhaps we can be more formal by modelling the process and considering the following questions:
– what is the trade-off between benefit over assessment depth? – what is the optimal stopping point?
– how does the depth change in response to changes in costs and benefits?
Problem Context: Let’s consider the interaction with the search engine. After a user poses a query, most search engines return a list of results, typically ranked in decreasing likelihood of being relevant to the user’s query [41]. This implies that as the user goes down through the ranked list the benefit that they receive (or the expected benefit) decreases – and so at some point the cost out-weighs the benefit of assessing a subsequent item. Of course, there are lots of factors that affect when people stop. For example, if a user types in a “dud” query, which retrieves no relevant items, they are likely to stop after only exam-ining a few items, if any. If the user enters “good” query, which retrieves many relevant items, then when they stop is probably more task or time dependent. If a user wants to find many relevant items, they presumably they would go deeper. But of course they don’t want to waste their time assessing non-relevant items and so will stop at some point, or if they find enough then they will stop. On the other hand, if they only want one relevant item, then they will stop once they find one item. So the model we develop will need to be sensitive to these different conditions.
Model: To create an economic model of assessing, we need to formulate cost and benefit functions associated with the process. Let’s start off by modelling the costs. A user first poses a query to the search engine and thus incurs a query cost cq. Then for the purposes of the model, we will assume the user assesses
items, one by one, where the cost to assess each item isca. If the user assesses
Aitems, then the cost function would be:
c(A) =cq+A.ca (15)
b(A) =k.Aβ (16)
where k is a scaling factor, andβ represents how quickly the benefit from the information diminishes. Ifβis equal to one, then for each subsequent item exam-ined, the user receives the same amount of benefit. However ifβ is less than one, then for each subsequent item examined, the user receives less additional benefit. This function is fairly flexible: ifk=0for a given query, then it can represent a “dud” query, whileβ =0models when only one item is of benefit (e.g.A0=1).
So the benefit function can cater for a number of different scenarios.
Optimal Assessing Behaviour: Now given these two functions, we can compute the profit (i.e., net benefit) πthat the user receives when they assess to a depth ofA:
π=b(W)−c(W) =k.Aβ−cq−A.ca (17)
To find the assessment depth that maximizes the user’s net benefit, we can differentiate with respect toAand solve the equation:
∂π
∂A =k.β.A β−1
−ca=0 (18)
This results in:
A?= ca k.β
β−11
(19)
Hypotheses: From Equation 19, we can see that the optimal depth is de-pendent on the cost of assessment (ca), and the performance surmised bykand
β. Using comparative statics [46], we can see how a user should respond when one variable changes, and everything else is held constant. If the cost of assess-ing increases, and β is less than one (i.e. diminishing returns), then the model suggests that the user would examine less documents. For example, consider a news app that charges per article, while another does not. In this case, the model predicts that users would read less documents in the first app, when compared to the second.
Figure 4 shows how the profit of assessing changes as the cost of assessing is increased. If the performance increases, i.e.β tends to one, then the user would examine more documents. Similarly, as the performance increases via k, then this also suggests that the user would examine more documents.
0 2 4 6 8 10 0
50 100 150
A − Number of Documents Examined
Benefit
0 2 4 6 8 10
−40 −20 0 20 40
A − Number of Documents Examined
Profit
[image:17.612.199.402.130.391.2]b=0.3 b=0.5
Fig. 4. Top: Plot of the benefit of assessing, Bottom: Plot of the profit of assessing where the result list is of low quality (b=0.3) and higher quality (b=0.5). The model predicts users will assess more documents as the result list quality increases.
(compared to examining text snippets), and so the model predicts that a user will assess lots of images (but few text snippets). Interestingly, under this model, the cost of a query does not impact on user behaviour. This is because it is a fixed cost, and the analysis is only concerned with the change in cost versus the change in benefit (i.e. stop when the marginal cost equals the marginal benefit). However, in reality the cost of the query is likely to influence how a user behaves. Also, users are likely to issue multiple queries, either new queries or better reformulations which lead to different benefits. While this simple model of assessing provides some insights into the process, it is limited, and may not generalise to these other cases7. Next, we extend this model and consider when multiple queries can be issued, and how the trade-off between querying and assessing affects behaviour.
7
5
A Model of Searching
This section describes the process of searching over a session, where numerous queries can be issued, and the user examines a number of items per query. The model will focus on the different search strategies that users can undertake and how the costs and benefits affect the optimal search strategy; specifically, we will explore the following questions:
– what is the trade-off between querying and assessing? – what is the optimal search strategy?
– how does the search strategy change in response to changes in costs and benefits?
Essentially, given a particular context, we would like to know if a user should issue more queries and assess fewer items per query, or whether they should issue fewer queries and assess many items per query?
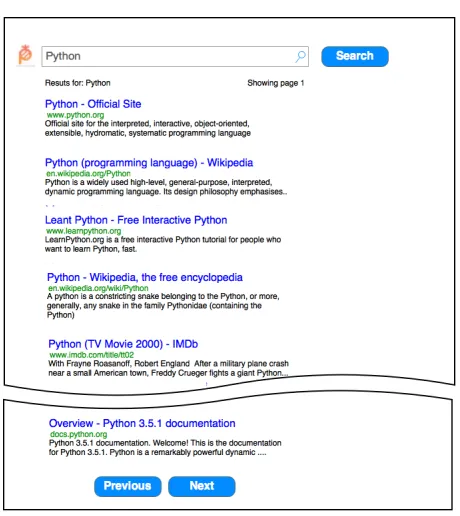
Problem Context: Let’s first consider the standard search interface (much like a web search interface) consisting of a query box (or query area) and search button. When a user issues a query to the search engine, the search result page is shown and displays: (i) the number of search results, (ii) the current page num-ber, (iii) a list ofnresult snippets (usuallyn=10result snippets per page) and (iv) a next and previous button, see Figure 5. Each search result has a title (of-ten shown as a blue link), a snippet from the item, along with the URL/domain. This style of interface is usually referred to as the “ten blue links” [28].
Given this interface, the user can perform a number of actions: (i) (re)query, (ii) examine the search results page, (iii) inspect individual result snippets, (iv) assess items, e.g., click on the result and view the web page, image, news arti-cle, etc., and (v) visit subsequent results pages. Each of these actions have an associated cost and so are likely to affect search behaviour.
Model: Described more formally, during the course of a search session, a user will pose a number of queries (Q), examine a number of search result pages per query (V), inspect a number of snippets per query (S) and assess a number of items per query (A). Each interaction has an associated cost where cq is the
cost of a query, cv is the cost of viewing a page, cs is the cost of inspecting
a snippet, and ca is the cost of assessing an item. With this depiction of the
search interface we can construct a cost function that includes these variables and costs, such that the total cost of interaction is:
c(Q,V,S,A) =cq.Q+cv.V.Q+cs.S.Q+ca.A.Q (20)
Fig. 5.Standard Search Interface – showing results for the query “python”.
with respect to these actions changes, on average. Nonetheless, the cost function is quite complex, so we will need to simplify the cost function. To do so, we will need to make a number of further assumptions.
First, we shall ignore the pagination and assume that all the results are all on one page, i.e. V= 1. Thus a user does not need to go to subsequent pages (i.e. infinite scroll)8. The assumption is quite reasonable as in most cases users only visit the first page of results anyway [7, 28].
Second, we shall assume that the number of items assessed is proportional to the number of snippets viewed, i.e. that users need to first inspect the result snippet, before clicking on and examining an item, thus S≥A. Furthermore, we can associate a probability to a user clicking on a result snippet, pa, and
examining the item. The expected number of assessments viewed per query would then be A=S.pa. Substituting these values into the cost model, we obtained:
c(Q,V,S,A) =cq.Q+cv.Q+cs.
A pa
.Q+ca.A.Q (21)
8 However, it would be possible to encode the number of page views per query more precisely by
using a step function based on the number of snippets viewed, representing the fixed cost incurred to load and view each page of results. The step function would be such that the number of pages viewedVwould be equal to the number of snippets viewed divided by the number of snippets shown per page (n), rounded up to the nearest integer, i.e.dS
We can now reduce the cost function to be dependent only on A andQ, such that:
c(Q,A) = (cq+cv).Q+
cs pa
+ca
.A.Q (22)
Let’s turn our attention to building the benefit function and characterising how much benefit the user receives from their interactions. Given the two main interactions querying and assessing, we assume, as in the previous model, that as a user examines items, they obtain some benefit, but as they progress through the list of items, the benefit they experience is at a diminishing returns. As previously mentioned, when searching for news about the latest crisis, as subsequent news articles are read, they become less beneficial because they begin to repeat the same information contained in previous articles. In this case, to find out about other aspects of the topic, another related but different query needs to be issued. Essentially, each query issued contributes to the overall benefit, but again at a diminishing returns, because as more and more aspects of the topic are explored, less new information about the topic remains to be found. To characterise this, we shall model the benefit function using the Cobbs-Douglas function [46]:
b(Q,A) =k.Qα.Aβ (23)
where αrepresents returns from querying, while β represents the returns from assessing, andkis a scaling factor9. Let’s consider two scenarios whenα= 0 and whenα= 1. In the first case, regardless of how many queries are issuedQ0=1,
so issuing more than one query, wold be a waste as it would not result in more benefit. In the latter case,Q1=Q, there is no diminishing returns for subsequent
queries. This might model the case where the user poses independent queries, i.e. the user searches for different topics within the same session, poses queries that retrieve different items for the same topic, or when there is an seemingly endless supply of beneficial/relevant items e.g., procrastinating watching online videos. Given the form in Eq. 23 the benefit function is sufficiently flexible to cater for a wider range of scenarios. In [5], Azzopardi showed this benefit function to fit well with empirical search performance of querying and assessing.
Optimal Search Behaviour: Using the model of searching it is now possible to determine what the optimal search behaviour, in terms ofQandA, would be given the parameters of the model. To do this we assume that the objective of the user is to minimise the cost for a given level of benefit (or alternatively, maximise their benefit for a given cost). This occurs when the marginal benefit equals the marginal cost. We can solve this optimisation problem with the following objective function (using a Lagrangian Multiplierλ):
∆= (cq+cv.v).Q+
cs pa
+ca
.A.Q−λk.Qα.Aβ−b
where the goal is to minimise the cost subject to the constraint that the amount of benefit is b. By taking the partial derivatives, we obtain:
∂∆ ∂A =
cs
pa
+ca
.Q−λ.k.β.Qα.Aβ−1 (24)
9
and:
∂∆
∂Q =cq+cv.v+ cs
pa
+ca
.A−λ.k.α.Qα−1.Aβ (25)
Setting these both to zero, and then solving, we obtain the following expres-sions for the optimal number of assessments per queryA?:
A?= β.(cq+cv.v) (α−β). cs
pa +ca
(26)
and the optimal number of queries Q?:
Q?= α
r g
k.A?β (27)
Hypotheses: Using this analytical solution we can now generate a number of testable hypotheses about search behaviour by considering how interaction will change when specific parameters of the model increase or decrease. From the model it is possible to derive a number of hypotheses regarding how performance and cost affect behaviour. Rather than enumerate each one below we provide a few examples (see Azzopardi [6] for details on each).
Similar to the previous model, we can formulate a hypothesis regarding the quality of the result list, where as β increases, the number of assessments per query will increase, while the number of queries will decrease (as shown in Fig-ure 7, top left plot). Intuitively, this makes sense because as β increases the rank list of results contains more relevant items: it is better to exploit the cur-rent query before switching to a new query.
Regarding costs, we can formulated a query cost hypothesis, such that as the cost of a query cq increases, the number of items assessed per query will
increase, while the number of queries issued will decrease (as shown in Figure 7, top, right plot). It should be clear from the Eq. 26 that this is the case because as cq becomes larger, A? also becomes larger. In turn, the number of queries
issued will decrease, because asA?becomes larger,Q? tends to zero. Of course, to start the search session, there needs to be at least one query, e.g., Q must be equal to one or greater. A similar hypothesis can be formulated regarding assessment costs, where as the cost of an assessment increases, the number of items assessed per query will decrease, while the number of queries issued will increase. Since the assessment costcaappears in the denominator in Eq. 26 then
any increase will reduce the number of assessments.
Another hypothesis that the model produces is regarding the probability of assessing items. Here, as the probability of assessing increases, the number of items assessed increases, while the number of queries issued decreases (as shown in Figure 7, bottom, right plot). If a user examines every item in the ranked list, thenpawould equal one meaning that for each snippet that they examine, they
also examine the item. As a result, because more items are being examined, less queries are issued overall.
0 10 20 0
2 4 6 8
Documents Examined
Queries Issued
0 10 20
250 300 350 400 450 500
Documents Examined
Cost
0 10 20
0 2 4 6 8
Documents Examined
Queries Issued
0 10 20
250 300 350 400 450 500
Documents Examined
[image:22.612.152.452.131.445.2]Cost
Fig. 6.Top: Plots of the number of queries vs. the number of items examined per query for a given level of benefit. Any point yields the same amount of benefit. The asterisk indicates the optimal querying/assessing strategy, i.e. (A?,Q?). Bottom: Plots of the Cost vs. the number of items examined per query. The asterisk indicates when the cost is minimised, i.e. atA?.
0.1 0.2 0.3 0.4 0
5 10 15
Beta
Actions
10 20 30 40 50
0 5 10 15
Query Cost
Actions
10 20 30 40 50
0 5 10 15
Assessment Cost
Actions
0.2 0.4 0.6 0.8
0 5 10 15
Probability of Assessing
Actions
[image:23.612.154.449.124.364.2]Assessments Queries
Fig. 7. Top Left: Plot of A? and Q? as β changes. Top Right: Plot of A? and Q?
as query cost changes. Bottom Left: Plot of A? and Q? as assessment cost changes. Bottom Right: Plot ofA?andQ? as the probability of assessment changes.
a between groups experiment was devised where the search interface was modi-fied to create different query cost conditions. They used a structured, standard and suggestion based search interface. Their results provided evidence to sup-port the query cost hypothesis, such that when the query cost was high subjects issued fewer queries and examined more items per query, and vice versa. In a follow-up analysis on the same data, the other hypotheses above were explored, and it was shown that they also tend to hold in general [6]. In a study by Ong et al. [33], they conducted a between groups study evaluating the differences in search behaviour when subjects used either a mobile device or a desktop device to perform search tasks. On mobile devices, the costs for querying and assessing are much higher due to smaller keyboard (leading to slower query entry) and bandwidth/latency limitations (leading to slower page downloads). This resulted in subjects assigned to the mobile condition issuing fewer queries, but examining more snippets/items per query [33]. Again, this is broadly consistent with the model developed here.
examines a fixed number of snippets/items per query, yet most users examine a variable number of snippets/items per query. Essentially, the model assumes that on average this is how many snippets/items are viewed per query. For a finer grained model, we would have to model each result list individually, so that the total benefit would be, for example, the sum of the benefit obtained from each result list over all queries issued. Then it would be possible to determine, given a number of queries, how far the user should go into each result list (see Azzopardi and Zuccon [8] for this extension). Another aspect that could be improved is the cost function. We have assumed that the cost of different actions are constant, yet they are often variable, and will change during the course of interaction (e.g., a query refinement may be less costly than expressing a new query or selecting from among several query suggestions). Also a more sophisticated and accurate cost model could be developed which may affect the model’s predictions.
6
Discussion and Conclusions
In this chapter, we have described the process of building economic models and provided several examples in the context of information seeking and retrieval. In previous work [9, 10] we have also enumerated a number of other models that analyse other aspects of search interface components, e.g., when should facets be used, when is it better to issue a new query or is it better to take a query suggestion, how many results should we put on a result page query, and so on. While such models are relatively simple, they provide useful abstractions which focus the attention on the main levers that are likely to affect the behaviour of users. Furthermore, we are able to derive testable hypotheses about user behaviour. This is particularly useful because it provides a guide for experimen-tation which is grounded by theory. If the hypotheses are shown to hold, then the model provides a compact representation of the phenomena which designers and researchers can use when developing interface innovations or improving the underlying systems. For example, in the last scenario, if it is difficult to formulate an effective query, say in the context of image search, then we would expect that users would examine many more result items, and so we could adapt the system to show more results per page. Indeed, search engines provide ten blue links for web pages but hundreds of results for images. While useful and informative, there are, however, a number of challenges in taking the theory and putting it into practice.
preferences. For example, Oulasvirta et al. [34] create a benefit function that is a linear combination of several criteria (usefulness, usability, value, etc.) in order to evaluate which features/actions an interface should afford users. In this case, rather than having one possible optimal solution, instead, depending on what aspect(s) are considered most important, different solutions arise. On the other hand, what is the benefit that a user receives from their interactions with the system? Is it information, enjoyment, satisfaction, time, money? In our models we have made the assumption that the cost and benefit are in the same units, however, if we were to assume time as the cost, then the benefit would be how much time is saved (as done by Fuhr [20]). While this makes sense in the case of finding a name in a list, it does not make sense in all scenarios. For example, in the news search scenario, we could imagine that the amount of benefit is proportional to the new information found, and the benefit is relative to how helpful the information is in achieving their higher level work or leisure task. So, if we were to assume benefit as say, information gain (as done by Zhang and Zhai [51]), or user satisfaction (as done by Verma and Yilmaz [48]), then how do we express cost in the same unit? In this case a function is needed to map the benefits and costs into the same units (as done by Azzopardi and Zuccon [8]). Alternatively, the ratio between the benefit and the cost could be used instead as done in Information Foraging Theory (IFT) [38], or when performing a cost-effectiveness analysis. Once the units of measurement have been chosen, and instruments have been created to take such measurements, then the subsequent problem is how to accurately estimate the cost of the different interactions, and the benefit that is obtained from those interactions. This is very much an open problem.
A noted limitation of such models is the underlying assumption that people seek to maximise their benefit (e.g., the utility maximisation paradigm). This as-sumption has been subject to much scrutiny, and shown to break down in various circumstances leading to the development of behavioural economics. Kahneman and Tversky have shown that people are subject to various cognitive biases and that people often adopt heuristics which results in sub-optimal behaviours [26]. In their work on Prospect Theory, they argue that people have a more subjective interpretation of costs and benefits, and that people perceive and understand risk differently (i.e. some are more risk-adverse than others). Whereas Simon argues that people are unlikely to be maximisers that relentlessly seek to maximise their benefit subject to a given cost [43], but rathersatisificers who seek to ob-tain a satisfactory amount of benefit for the minimum cost. While the utility maximisation assumption is questionable, there is opportunity to extend these economics models presented here, and create more behavioural economic models that encode these more realistic assumptions about behaviour. As pointed out earlier though it is best to start simple and refine the models accordingly.
environment. However, such factors are likely to influence behaviour. For exam-ple Oulasvirta et al. examined how choice overload (i.e. the paradox of choice) affects search behaviour and performance, finding that people were less satisfied when provided with more results [35]. While White showed that searchers would often seek confirmation of theira priori beliefs (i.e. confirmation bias), and were again less satisfied with the results that contradicted them [49]. However within the Adaptive Interaction Framework [37] it is argued that the strategies that people employ are shaped by the adaptive, ecological and bounded nature of hu-man behaviour. And as such, these biases and limitations should be taken into account when developing models of interaction. That is, by using the economic modelling approach presented above it is possible to develop models that max-imize utility subject to such constraints. Essentially, the economic models here could be extended to incorporate such constraints (and thus assume Bounded Rationality [21, 43], for example). Furthermore, they could be incorporated into approaches such as Rational Analysis [2] or the Adaptive Interaction Frame-work [37], whereby a model includes user and environmental factors as well. Imposing such constraints, not only makes the models more realistic, but they are likely to provide better explanations of behaviour and thus better inform how we design interfaces and systems.
On a pragmatic point, the design and construction of experiments that specif-ically test the models can also be challenging. In the models we have described above, we used a technique called comparative statics, to consider what would happen to behaviour, when one variable is changed e.g., as cost goes up, less queries are issued. This required the assumption that all other variables were held constant. In practice, however, the manipulation of one variable, will in-variably, influences other variables. For example, in the experiments performed examining the query cost hypothesis, one of the conditions contained query sug-gestions – the idea being that clicking on sugsug-gestions would be cheaper than typing in suggestions [7]. However, this inadvertently led to an increase in the amount of time on the search result page for this condition, which was attributed to the time spent reading through the suggestions [7]. However, this cost was not considered in the initial economic model proposed by Azzopardi [5]. This led to the revise model [6], described above, which explicitly models the cost of inter-acting with the search result page as well as the cost of interinter-acting with snippets. These changes subsequently led to predictions that were consistent with the ob-served data. This example highlights the iterative nature of modelling and how refinements are often needed to create higher fidelity models.
aspects – thus guiding the experiments that we perform and the designs that we propose. Once a model has been developed and validated, then it provides a compact representation of the body of knowledge, so that others can use and extend the model developed. While we have noted above a number of challenges in working with such models, the advantages are appealing and ultimately such models provide theoretical rigour to our largely experimental discipline.
References
1. Agapie, E., Golovchinsky, G., and Qvardordt, P. Encouraging behavior: A foray into persuasive computing. InProceedings on the Symposium on Human-Computer Information Retrieval (2012).
2. Anderson, J. R. Is human cognition adaptive? Behavioral and Brain Sciences 14, 3 (1991), 471–485.
3. Arampatzis, A., and Kamps, J. A study of query length. InSIGIR ’08: Pro-ceedings of the 31st annual international ACM SIGIR conference on Research and development in information retrieval (2008), pp. 811–812.
4. Azzopardi, L. Query side evaluation: an empirical analysis of effectiveness and effort. InProceedings of the 32nd international ACM SIGIR conference on Research and development in information retrieval (2009), ACM, pp. 556–563.
5. Azzopardi, L. The economics in interactive information retrieval. InProc. of the 34th ACM SIGIR conference (2011), pp. 15–24.
6. Azzopardi, L. Modelling interaction with economic models of search. InProc. of the 37th ACM SIGIR conference (2014), SIGIR ’14, pp. 3–12.
7. Azzopardi, L., Kelly, D., and Brennan, K. How query cost affects search behavior. InProc. of the 36th ACM SIGIR conference (2013), pp. 23–32. 8. Azzopardi, L., and Zuccon, G. An analysis of theories of search and search
behavior. In Proceedings of the 2015 International Conference on The Theory of Information Retrieval (2015), ACM, pp. 81–90.
9. Azzopardi, L., and Zuccon, G. An analysis of the cost and benefit of search interactions. In Proceedings of the 2016 ACM International Conference on the Theory of Information Retrieval (2016), ICTIR ’16, pp. 59–68.
10. Azzopardi, L., and Zuccon, G. Two Scrolls or One Click: A Cost Model for Browsing Search Results. 2016, pp. 696–702.
11. Belkin, N. J., Kelly, D., Kim, G., Kim, J.-Y., Lee, H.-J., Muresan, G., Tang, M.-C., Yuan, X.-J., and Cool, C.Query length in interactive information retrieval. InProceedings of the 26th ACM conference on research and development in information retrieval (SIGIR)(2003), pp. 205–212.
12. Box, G. E.Robustness in the strategy of scientific model building.Robustness in statistics 1 (1979), 201–236.
13. Browne, G. J., Pitts, M. G., and Wetherbe, J. C. Cognitive stopping rules for terminating information search in online tasks. MIS Quarterly 31, 1 (2007), 89–104.
14. Card, S. K., Moran, T. P., and Newell, A. The keystroke-level model for user performance time with interactive systems. Communications of the ACM 23, 7 (1980), 396–410.
15. Chater, N., and Oaksford, M. Ten years of the rational analysis of cognition.
16. Cooper, W. S. On selecting a measure of retrieval effectiveness part ii. imple-mentation of the philosophy.J. of the American Society for Info. Sci. 24, 6 (1973), 413–424.
17. Cummins, R., Lalmas, M., and O’Riordan, C.The limits of retrieval effective-ness. In European Conference on Information Retrieval (2011), Springer Berlin Heidelberg, pp. 277–282.
18. Dostert, M., and Kelly, D. Users’ stopping behaviors and estimates of recall. InProc. 32nd ACM SIGIR(2009), pp. 820–821.
19. Fitts, P. M. The information capacity of the human motor system in controlling the amplitude of movement. Journal of experimental psychology 47, 6 (1954), 381. 20. Fuhr, N. A probability ranking principle for interactive information retrieval.
Information Retrieval 11, 3 (2008), 251–265.
21. Gigerenzer, G., and Selten, R. Bounded Rationality: The Adaptive Toolbox. MIT Press, 1999.
22. Hick, W. E.On the rate of gain of information.Quarterly Journal of Experimental Psychology 4, 1 (1952), 11–26.
23. Hiemstra, D., Hauff, C., and Azzopardi, L.Exploring the query halo effect in site search. InTo appear in the Proceedings of the 40th International ACM SIGIR Conference on Research and Development in Information Retrieval (2017), SIGIR ’17.
24. Ingwersen, P., and J¨arvelin, K.The Turn: Integration of Information Seeking and Retrieval in Context. Springer-Verlag New York, Inc., 2005.
25. Jin, F., Dougherty, E., Saraf, P., Cao, Y., and Ramakrishnan, N. Epi-demiological modeling of news and rumors on twitter. In Proceedings of the 7th Workshop on Social Network Mining and Analysis (2013), ACM, p. 8.
26. Kahneman, D., and Tversky, A.Prospect theory: An analysis of decision under risk. Econometrica: Journal of the econometric society (1979), 263–291.
27. Kashyap, A., Hristidis, V., and Petropoulos, M. Facetor: cost-driven ex-ploration of faceted query results. In Proceedings of the 19th ACM conference on Information and knowledge management (CIKM) (2010), ACM, pp. 719–728. 28. Kelly, D., and Azzopardi, L. How many results per page?: A study of serp
size, search behavior and user experience. InProceedings of the 38th International ACM SIGIR Conference (2015), pp. 183–192.
29. Kelly, D., Dollu, V. D., and Fu, X. The loquacious user: a document-independent source of terms for query expansion. InProceedings of the 28th annual international ACM SIGIR conference on Research and development in information retrieval (2005), ACM, pp. 457–464.
30. Kelly, D., and Fu, X. Elicitation of term relevance feedback: an investigation of term source and context. InProceedings of the 29th ACM conference on research and development in information retrieval (SIGIR) (2006), pp. 453–460.
31. Lewis, R. L., Howes, A., and Singh, S. Computational rationality: Linking mechanism and behavior through bounded utility maximization. Topics in cogni-tive science 6, 2 (2014), 279–311.
32. Murty, K. G. Optimization models for decision making: Volume. University of Michigan, Ann Arbor (2003).
33. Ong, K., J¨arvelin, K., Sanderson, M., and Scholer, F. Using information scent to understand mobile and desktop web search behavior. InProc. 40th ACM
SIGIR (2017).
35. Oulasvirta, A., Hukkinen, J. P., and Schwartz, B. When more is less: The paradox of choice in search engine use. In Proceedings of the 32Nd International ACM SIGIR Conference on Research and Development in Information Retrieval
(2009), pp. 516–523.
36. Ouliaris, S. Economic models: Simulations of reality. http://www.imf.org/ external/pubs/ft/fandd/basics/models.htm, 2012. Accessed: 2017-04-30. 37. Payne, S. J., and Howes, A. Adaptive interaction: A utility maximization
ap-proach to understanding human interaction with technology. Synthesis Lectures on Human-Centered Informatics 6, 1 (2013), 1–111.
38. Pirolli, P., and Card, S.Information foraging.Psychological Review 106(1999), 643–675.
39. Pirolli, P., Schank, P., Hearst, M., and Diehl, C. Scatter/gather browsing communicates the topic structure of a very large text collection. InProceedings of the ACM SIGCHI conference (1996), pp. 213–220.
40. Prabha, C., Connaway, L., Olszewski, L., and Jenkins, L. What is enough? Satisficing information needs. J. of Documentation 63, 1 (2007), 74–89.
41. Robertson, S. E. The probability ranking principle in ir.Journal of documenta-tion 33, 4 (1977), 294–304.
42. Russell, D. Mindtools: What does it mean to be literate in the age of google?J. Comput. Sci. Coll. 30, 3 (Jan. 2015), 5–6.
43. Simon, H. A. A behavioral model of rational choice. The quarterly journal of economics 69, 1 (1955), 99–118.
44. Smith, C. L., and Kantor, P. B. User adaptation: good results from poor systems. InProceedings of the 31st ACM conference on research and development in information retrieval (SIGIR)(2008), pp. 147–154.
45. Turpin, A. H., and Hersh, W. Why batch and user evaluations do not give the same results. In Proceedings of the 24th Annual International ACM SIGIR Conference on Research and Development in IR(2001), SIGIR ’01, pp. 225–231. 46. Varian, H. R. Intermediate microeconomics: A modern approach. W.W. Norton,
New York:, 1987.
47. Varian, H. R.How to build an economic model in your spare time.The American Economist 61, 1 (2016), 81–90.
48. Verma, M., and Yilmaz, E.Search Costs vs. User Satisfaction on Mobile. 2017, pp. 698–704.
49. White, R. Beliefs and biases in web search. In Proceedings of the 36th Inter-national ACM SIGIR Conference on Research and Development in Information Retrieval (2013), pp. 3–12.
50. Zach, L. When is “enough” enough? modeling the information-seeking and stop-ping behavior of senior arts administrators: Research articles. J. of the American Society for Info. Sci. and Tech. 56, 1 (2005), 23–35.
51. Zhang, Y., and Zhai, C.Information retrieval as card playing: A formal model for optimizing interactive retrieval interface. InProceedings of the 38th International ACM SIGIR Conference on Research and Development in Information Retrieval
(New York, NY, USA, 2015), SIGIR ’15, ACM, pp. 685–694.