doi: 10.3389/fmars.2017.00186
Edited by: Sanjeev Kumar, Physical Research Laboratory, India
Reviewed by: Nazli Olgun, Istanbul Technical University, Turkey Yantao Liang, Qingdao Institute of Bioenergy and Bioprocess Technology (CAS), China
*Correspondence: Hongbin Liu liuhb@ust.hk
Specialty section: This article was submitted to Marine Biogeochemistry, a section of the journal Frontiers in Marine Science
Received:28 February 2017 Accepted:30 May 2017 Published:15 June 2017
Citation: Chen M, Liu H and Chen B (2017) Seasonal Variability of Mesozooplankton Feeding Rates on Phytoplankton in Subtropical Coastal and Estuarine Waters. Front. Mar. Sci. 4:186. doi: 10.3389/fmars.2017.00186
Seasonal Variability of
Mesozooplankton Feeding Rates on
Phytoplankton in Subtropical Coastal
and Estuarine Waters
Mianrun Chen1, Hongbin Liu2* and Bingzhang Chen3
1South China Sea Institute of Planning and Environmental Research, Guangzhou, China,2Division of Life Science, The Hong Kong University of Science and Technology, Kowloon, Hong Kong,3Research Center for Global Change Research, Japan Agency for Marine-Earth Science and Technology, Yokohama, Japan
In order to understand how mesozooplankton assemblages influenced phytoplankton in coastal and estuarine waters, we carried out a monthly investigation on mesozooplankton composition at two contrasting stations of Hong Kong coastal and estuarine waters and simultaneously conducted bottle incubation feeding experiments. The assemblage of mesozooplankton was omnivorous at both stations with varying carnivory degree (the degree of feeding preference of protozoa and animal food to phytoplankton) and the variations of carnivory degree were significantly associated with microzooplankton biomass (ciliates for the coastal station, both ciliates and dinoflagellates for the estuarine stations) and physical environmental parameters (primarily salinity). High carnivory was primarily due to high composition of noctilucales, Corycaeus spp., Oithona
spp. and Acartia spp. Results of feeding experiments showed that grazing impacts on phytoplankton ranged from −5.9 to 17.7%, while the mean impacts were just
<4% at both stations. The impacts were size-dependent, by which mesozooplankton consumed around 9% of large-sized phytoplankton while indirectly caused an increase of 4% of small-sized phytoplankton. Mesozooplankton clearance rate on phytoplankton, calculated from the log response of chlorophyll a concentrations by the introduction of bulk grazers after 1-day incubation, was significantly reduced by increasing carnivory degree of the mesozooplankton assemblage. The mechanism for the reduction of mesozooplankton clearance rate with increasing carnivory degree was primarily due to less efficient of filtering feeding and stronger trophic cascades due to suppression of microzooplankton. The feeding rates of mesozooplankton on microzooplankton were not obtained in this study, but the trophic cascades indirectly induced by mesozooplankton carnivorous feeding can be observed by the negative clearance rate on small-sized phytoplankton. Overall, the main significance of this study is the empirical relationship between carnivory degree and clearance rate, which allow researchers to potentially predict the herbivory of mesozooplankton in the nature without conducting feeding experiments.
INTRODUCTION
Marine mesozooplankton are key trophic components in transferring materials and energy from primary producers to higher trophic levels and linking microbial food web to marine classic food chain. Mesozooplankton are a diverse assemblage, including herbivores, omnivores and carnivores, with broad feeding spectra and flexible feeding strategies, they are also important grazers for microbial components (e.g., diatoms, flagellates, dinoflagellates, and ciliates; Kleppel, 1993; Gifford et al., 2007). Some copepod species are able to prey on algal cells attached to detritus or attack fecal pellets (Turner, 2004). Fine-filtering feeders such as larvaceans and barnacle larvae might be able to capture pico-sized particles (Scheinberg et al., 2005; Vargas et al., 2006), while marine cladocerans and veliger larvae are able to capture the smallest nanoflagellates (Katechakis and Stibor, 2004; Vargas et al., 2006).
Mesozooplankton composition is affected by hydrological conditions as well as food compositions, especially in coastal and estuarine areas where water column is unstable and plankton succession is frequent (Roman et al., 2000; Marques et al., 2007; Chen et al., 2011). It has been reported by many field studies that when omnivorous species dominate in assemblage, mesozooplankton or copepods (a major group of mesozooplankton) often prefer feeding on microzooplankton to phytoplankton due to larger sizes and higher nutritional quality of microzooplankton (e.g.,Stoecker and Capuzzo, 1990; Gifford, 1991; Fessenden and Cowles, 1994; Atkinson et al., 1996; Nejstgaard et al., 2001; Zeldis et al., 2002; Calbet and Saiz, 2005; Liu et al., 2005b; Gifford et al., 2007). Predation on microzooplankton is also an important feeding strategy of omnivorous species that are able to switch their feeding behaviors to conquer food limitation or to survive during nuisance phytoplankton blooms in coastal waters (Kiørboe et al., 1996; Nejstgaard et al., 1997; Gifford et al., 2007). On the other hand, microzooplankton are generally the main source of phytoplankton loss at most marine systems (Calbet and Landry, 2004). The predation of mesozooplankton on these intermediate grazers will inevitably cause a release of phytoplankton loss and induce a trophic cascade effect on phytoplankton net growth (Stibor et al., 2004; Sommer and Sommer, 2006). Such trophic cascades in turn reduce the trophic effect of mesozooplankton in controlling phytoplankton biomass.
Mesozooplankton feeding rate is the strength of trophic effect of mesozooplankton on their prey. Clearance rate is a measure of filtration rate of filtering feeders in cropping algal cells, calculated from bottle incubation experiments (Frost, 1972). It has been widely used to indicate the feeding rate per density of grazers, since when the equations of Frost (1972) were published. Clearance rate is often a functional response to prey concentrations so that grazers will increase their search for those preferred food items when such items are short in supply, while decrease their feeding activities for those disliked ones. Therefore, clearance rate can be a rough reference to indicate the feeding selectivity of grazers among prey at a given incubation duration (e.g.,Atkinson et al., 1996; Liu et al., 2010). However, because of the presence of an intermediate trophic level (microzooplankton)
and the effect of trophic cascades induced by simultaneous mesozooplankton predation, clearance rate calculated from bottle incubation method is actually the net strength of trophic interaction caused by mesozooplankton feeding including both direct consumption and indirect cascading. Cascading effects can be apparent when cascading effect is stronger than direct consumption that negative clearance rates are to be observed (Nejstgaard et al., 2001).
Various biological factors (such as prey sizes and concentrations, food quality, feeding characteristics of consumers, prey and predator diversity, and mixture of trophic levels of grazers, etc.) contribute to of the strength of trophic cascades in aquatic systems, among which the feeding activities and taxonomy (high composition of omnivores and carnivores) are the most important ones (Shurin et al., 2002; Borer et al., 2005). For marine planktonic food web, the increase of carnivorous feeding of mesozooplankton is the main reason for driving trophic cascades (Sommer, 2008). For omnivorous species, their effects on phytoplankton depend on their carnivory degrees (the degree of feeding preference of protozoa and animal food to phytoplankton). Thus, as for the entire assemblage of mesozooplankton, higher composition of omnivorous and carnivorous species would result in higher trophic cascades and lower direct consumption on phytoplankton. However, the omnivory degree of an omnivorous species or assemblage is so far hard to quantify (Stevens et al., 2004a,b). Traditional method to measure mesozooplankton predation requires incubation and expertise to count microzooplankton, which is time-consuming (e.g.,Atkinson et al., 1996; Zeldis et al., 2002; Gifford et al., 2007). In this study, we aim to investigate how omnivorous mesozooplankton assemblages influence phytoplankton of different sizes and what the magnitudes of grazing impacts are. We hypothesize that mesozooplankton clearance rates on phytoplankton should decrease with increasing proportion of predators or increasing net carnivory degree of the entire mesozooplankton assemblage. To achieve our objectives, we conducted mesozooplankton feeding experiments monthly in a coastal site and an estuarine site of Hong Kong waters to measure feeding rates of mesozooplankton on phytoplankton of different sizes. As a direct measurement of mesozooplankton carnivory degree is not possible, we adopted an alternative approach to estimate the carnivory degree by assigning a rough estimation of a carnivory degree (0, 0.25, 0.5, 0.75, and 1) to each mesozooplankton species based on previous published feeding strategies and habits, in an attempt to obtain a relationship between the carnivory degree of a mesozooplankton assemblage and its clearance rates on phytoplankton of different sizes. Results of this study will provide insight information of how variations of carnivory degree of mesozooplankton assemblages affect the structure of marine planktonic food webs.
MATERIALS AND METHODS
Sampling and Analysis
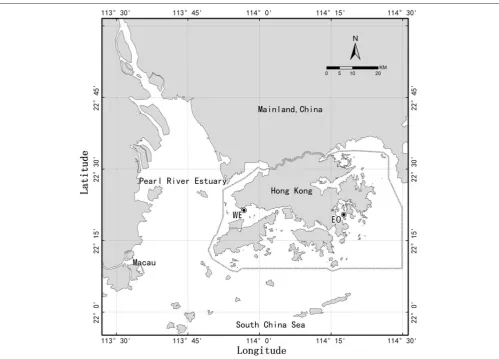
waters (mesotrophic vs. eutrophic). Samples of seawater and mesozooplankton were collected from two contrasting sites of Hong Kong coastal waters (Figure 1) on a roughly monthly basis at two periods from May 2007 to February 2008 and from February 2009 to February 2010 (total 20 months for each site). The western estuarine site (22◦ 21.324′ N, 113◦ 56.783′ E) is
located at the edge of the Pearl River estuary on the west side of Hong Kong (hereafter, WE). The ecosystem of this site is significantly influenced by the Pearl River, the second largest river in China in terms of freshwater discharge. The influence is particularly strong, bringing a great amount of nutrients during wet season when southwest monsoon is prevailing. The eastern coastal-oceanic site (22◦ 20.453′ N, 114◦ 17.703′ E) is located
in Port Shelter on the east coast of Hong Kong (hereafter, EO), which is affected by shelf and oceanic waters from the South China Sea. Nutrients at eastern coastal water are generally lower than the western estuarine water, until a coastal current rich in nutrients intruding during early winter when northeast monsoon is prevailing (Yin, 2002; Chen et al., 2009andChen et al., 2011). Water depth of both sites is about 17 m.
Temperature and salinity were recorded with a multi-probe sensor YSI6600 (YSI Inc.). Ambient seawater was collected by immersing a 20-l polycarbonate carboy below the water surface. Concentrations of chlorophylla(Chla) in different size fractions of phytoplankton were determined by filtering duplicate 250– 500 ml of seawater from the carboy onto 20 and 2 µm PC
membrane filters (5 µm for the second sampling period) and
GF/F glass-fiber filters by a cascading filtering device under low vacuum pressure. After extraction with 90% acetone, Chla
was analyzed by a Turner Design fluorometer. For determining microzooplankton biomass, 100 ml seawater was taken from the carboy and fixed with 5% acidic Lugol’s solution Cell numbers and bio-volumes of ciliates and dinoflagellates were analyzed under an inverted microscope and then converted to biomass based on empirical formulas (Putt and Stocker, 1989).
Mesozooplankton was collected by towing a plankton net (0.5 m diameter, 167 µm mesh size) equipped with a digital
flow meter (HYDRO-BIOS) in the upper part of the water column (usually from about 10 m to surface with a speed of about 0.5 m s−1). The contents of the cod-end were transferred
into plastic bottles and adjusted to a volume of 500 ml using prescreened seawater. Mesozooplankton samples were preserved with formalin (4%final concentration) for identification and counting. Another net tow was operated at the same way to capture live mesozooplankton for grazing experiments. Live animals were immediately placed into a cooler filled with surface seawater and took back to laboratory for further process within 1 h.
Mesozooplankton Grazing Experiments
The procedure of mesozooplankton grazing experiments had been described by Liu et al. (2010). Briefly, ambient seawater from the carboy was prescreened through a 200 µm mesh to
remove mesozooplankton and siphoned into five 2.4 l PC bottles (3 treatments and 2 controls). Live mesozooplankton in the cooler were gently mixed and an aliquot (50–100 ml) of live mesozooplankton was added to each of the three treatment
bottles, respectively. Duplicate mesozooplankton aliquots of the same volumes were filtered onto pre-weighed PC membrane to determine dry weight of grazers added to each treatment bottle. Nutrients (10µmol l−1NaNO3and 1µmol l−1KH2PO4)
were added to all bottles to promote phytoplankton growth and eliminate the effect of mesozooplankton excretion. All bottles were then capped and incubated for 24 h in an out-door incubator cooled by running seawater.
At the end of incubation, mesozooplankton were removed from the bottles. Final Chlaconcentrations of each size fraction (<2µm, 2∼20µm,>20µm) in all bottles were determined as
described above. The changes of Chlaconcentrations during the incubation were applied to calculate mesozooplankton clearance rate (F, l·mg−1·d−1) based on equations ofFrost (1972):
F= kc−kt
dw ×V
wheredw(mg) is the dry weight of mesozooplankton that was added into the treatment bottles;V(l) is the volume of bottles;
kc (d−1) and kt (d−1) are the chlorophyll a-based growth of
phytoplankton in controls and treatments, which are calculated by the following equation:
k=(lnCe
C0) /t
where C0 and Ce are the concentrations of Chl a (µg·l−1)
at the beginning and the end of the incubation, respectively;
t (d) is the time of incubation. In case of contamination by abundant large-sized phytoplankton (>20µm) in net tow in a
few special months, we calibrated the initial concentration of Chl
aby measuring the Chlaconcentration in the mesozooplankton aliquots. To provide the information of the certain amount of Chla(µg) that was ingested by a unit of mesozooplankton (mg) per day (d), we calculated the ingestion rate (I,µg·mg−1·d−1) of
mesozooplankton on phytoplankton by the following equation:
I=F×Cmean
where Cmean (µg·l−1) is the mean Chl a concentration of
phytoplankton during the incubation period and can be calculated through:
Cmean=
Ce−C0
lnCe−lnC0.
Daily grazing impacts (GI, %) of mesozooplankton on phytoplankton were calculated based on thein situingestion rate per phytoplankton standing stock as the following equation:
GI= I×dw
C0 ×t×100
Mesozooplankton Identification and the
Criteria for Determining Carnivory Degree
FIGURE 1 |Map of Hong Kong waters showing two stations, WE in western estuarine waters and EO in eastern coastal water. Circle around Hong Kong indicate the Special Administrative Regions of China.
in a HYDRO-BIOS plate chamber and analyzed under a stereomicroscope to species level when possible. Abundant species and non-abundant species were counted separately.
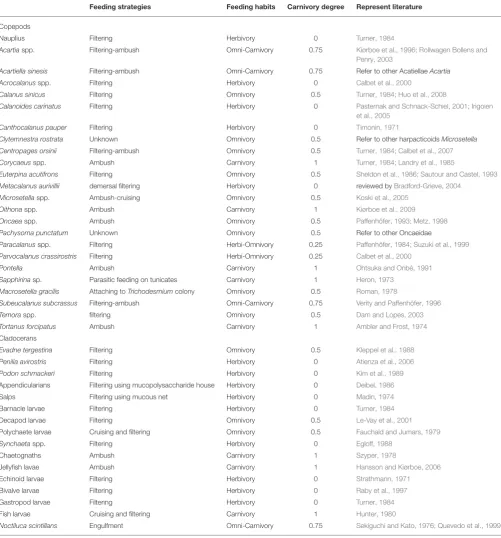
The carnivory degree of a mesozooplankton assemblage that was added to grazing treatments was determined by weighted-average of the carnivory degree of each species. In order to quantify the degree of carnivory of individual species, we manually established five levels of carnivory degree (0, 0.25, 0.5, 0.75, and 1) based on their feeding behavior and dietary habits in natural environments according to the previously published reports and reviews. Generally, the criteria to define the dietary habits of a species in this study only considered the relative importance of phytoplankton, microzooplankton and metazoans (including larvae and eggs) in diets. Other food sources like detritus and copepod fecal pellets were not considered in this approach. Basically, the carnivory degree of an individual species was referred to the efficiency of predating heterotrophic grazers, ranging from herbivores (inefficient predators), omnivores (less efficient) and carnivores (high efficient). Details of feeding mode, carnivory degree of individual species and represent literature sources are shown inTable 1.
TABLE 1 |Carnivory degree of mesozooplankton species in Hong Kong coastal and estuarine waters.
Feeding strategies Feeding habits Carnivory degree Represent literature
Copepods
Nauplius Filtering Herbivory 0 Turner, 1984
Acartiaspp. Filtering-ambush Omni-Carnivory 0.75 Kiørboe et al., 1996; Rollwagen Bollens and
Penry, 2003
Acartiella sinesis Filtering-ambush Omni-Carnivory 0.75 Refer to other AcatiellaeAcartia
Acrocalanusspp. Filtering Herbivory 0 Calbet et al., 2000
Calanus sinicus Filtering Omnivory 0.5 Turner, 1984; Huo et al., 2008
Calanoides carinatus Filtering Herbivory 0 Pasternak and Schnack-Schiel, 2001; Irigoien
et al., 2005
Canthocalanus pauper Filtering Herbivory 0 Timonin, 1971
Clytemnestra rostrata Unknown Omnivory 0.5 Refer to other harpacticoidsMicrosetella
Centropages orsinii Filtering-ambush Omnivory 0.5 Turner, 1984; Calbet et al., 2007
Corycaeusspp. Ambush Carnivory 1 Turner, 1984; Landry et al., 1985
Euterpina acutifrons Filtering Omnivory 0.5 Sheldon et al., 1986; Sautour and Castel, 1993
Metacalanus aurivillii demersal filtering Herbivory 0 reviewed byBradford-Grieve, 2004
Microsetellaspp. Ambush-cruising Omnivory 0.5 Koski et al., 2005
Oithonaspp. Ambush Carnivory 1 Kiørboe et al., 2009
Oncaeaspp. Ambush Omnivory 0.5 Paffenhöfer, 1993; Metz, 1998
Pachysoma punctatum Unknown Omnivory 0.5 Refer to other Oncaeidae
Paracalanusspp. Filtering Herbi-Omnivory 0.25 Paffenhöfer, 1984; Suzuki et al., 1999
Parvocalanus crassirostris Filtering Herbi-Omnivory 0.25 Calbet et al., 2000
Pontella Ambush Carnivory 1 Ohtsuka and Onbé, 1991
Sapphirinasp. Parasitic feeding on tunicates Carnivory 1 Heron, 1973
Macrosetella gracilis Attaching toTrichodesmiumcolony Omnivory 0.5 Roman, 1978
Subeucalanus subcrassus Filtering-ambush Omni-Carnivory 0.75 Verity and Paffenhöfer, 1996
Temoraspp. filtering Omnivory 0.5 Dam and Lopes, 2003
Tortanus forcipatus Ambush Carnivory 1 Ambler and Frost, 1974
Cladocerans
Evadne tergestina Filtering Omnivory 0.5 Kleppel et al., 1988
Penilia avirostris Filtering Herbivory 0 Atienza et al., 2006
Podon schmackeri Filtering Herbivory 0 Kim et al., 1989
Appendicularians Filtering using mucopolysaccharide house Herbivory 0 Deibel, 1986
Salps Filtering using mucous net Herbivory 0 Madin, 1974
Barnacle larvae Filtering Herbivory 0 Turner, 1984
Decapod larvae Filtering Omnivory 0.5 Le-Vay et al., 2001
Polychaete larvae Cruising and filtering Omnivory 0.5 Fauchald and Jumars, 1979
Synchaetaspp. Filtering Herbivory 0 Egloff, 1988
Chaetognaths Ambush Carnivory 1 Szyper, 1978
Jellyfish lavae Ambush Carnivory 1 Hansson and Kiørboe, 2006
Echinoid larvae Filtering Herbivory 0 Strathmann, 1971
Bivalve larvae Filtering Herbivory 0 Raby et al., 1997
Gastropod larvae Filtering Herbivory 0 Turner, 1984
Fish larvae Cruising and filtering Carnivory 1 Hunter, 1980
Noctiluca scintillans Engulfment Omni-Carnivory 0.75 Sekiguchi and Kato, 1976; Quevedo et al., 1999
Feeding strategies and feeding habits are determined according to literature.
their feeding modes from filtering feeding to ambush feeding have a carnivory degree of 0.75. For example, Acartia species ingest more microzooplankton than phytoplankton in most cases to conquer food limitation or to fulfill nutritional requirement according to many studies (e.g.,Kiørboe et al., 1996; Rollwagen
or carnivores, depending on what trophic levels they generally influence. For example, detritivorous feeders like cyclopoid speciesOncaea and harpacticoid species Microsetellaprimarily feed on particles attached to marine snow (Metz, 1998; Koski et al., 2005), while they are also able to capture algae and motile heterotrophs (Paffenhöfer, 1993), so they were considered as omnivores with a carnivory degree of 0.5.Macrosetella gracilis
has a unique feeding behavior by attaching to Trichodesmium
colony and feeding on individual particles associated with the colony, includingTrichodesmiumcells, ciliates and hydroids, etc. (Roman, 1978). Thus, the carnivory degree of M. gracilis was defined as 0.5. Other detritivorous cyclopoid species likeOithona
spp. and Corycaeus spp. were defined as carnivorous species since ciliates and heterotrophic dinoflagellates can be their major food items although they are able to ingest other forms of particles such as fecal pellets and detritus aggregates (Turner, 1984). The carnivory degree of parasitic speciesSapphirinasp. was defined as 1, since this species influences and even kills their host tunicates (Heron, 1973).Noctiluca scintillanswere also considered as omnivores with high carnivory degree (0.75), since they are important predators of copepods and able to ingest ciliates, dinoflagellates and diatoms as well (Sekiguchi and Kato, 1976; Quevedo et al., 1999).
Data Analysis
Means were compared by independent t-test and one-way ANOVA using SPSS 16.0. To explain the variations of mesozooplankton carnivory degree, we performed generalized additive models (GAM) tests to reveal the partial effects of predictors including physical-chemical parameters (temperature and salinity) and biological parameters (size-fractionated Chla
concentrations and biomass of ciliates and dinoflagellates). The GAM tests were performed using the mgcv package in the version 2.14.0 of R software (The R Development Core Team, 2009). We used Gaussian family (normal distribution) and cubic regression spline to smooth the predictors, with a freedom of 3.
RESULTS
Temperature, Salinity and Chlorophyll a
Concentrations
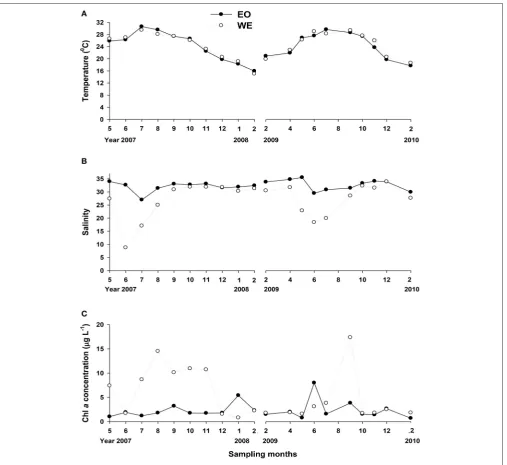
The seawater conditions for mesozooplankton grazing experiments exhibited large variations of temperature, salinity and chlorophyll a concentrations, since the experiments were carried out across two sampling years. Seawater temperature ranged from 15.0 to 30.6◦C, while the difference between the two
stations was small (Figure 2A). Salinity was apparently different between the two stations (Paired-t-test,t =3.877,p= 0.001). The salinity of WE, located at the edge of Pearl River estuary, was apparently lower than EO and there was a drop in April when the wet season (April to September) began (Figure 2B). The lowest value of surface water reached 8.8 ppt in June.
Chl a concentrations ranged from 0.7 to 17.4µg l−1, and
did not show the same patterns in the two sampling years
(Figure 2C). In the first sampling year (2007–2008), Chl a
concentrations were apparently higher at WE than EO
(Paired-t-test, t = 2.665,p = 0.026), except the winter (December to
February) during which an increase was observed in EO but not in WE. The difference between the two stations was insignificant at most months during the second sampling year (Paired-t -test, p > 0.05), except September (the end of wet season). The seasonal variability of phytoplankton composition based on sizes was complex at both stations (Figure 3), yielding variable food conditions for mesozooplankton. Overall, the patterns were rather contrasting between two sampling years at both stations. The percentage of large-sized phytoplankton (>20µm) in total
Chlawere 53±23% and 35±20% (mean±sd) in the first and the second sampling year, respectively. The relationship between concentrations of >20 µm Chl a and total Chl a was highly
correlated (Linear regression,R2=0.957,p<0.001), suggesting that the variation of total phytoplankton abundance was mainly due to the variation of large-sized phytoplankton (>20 µm).
Small-sized phytoplankton (<2µm) only dominated during the
early summer of EO and early winter of WE at the first sampling year; whereas they dominated at most months of the second sampling year except September of WE.
Mesozooplankton Carnivory Degree
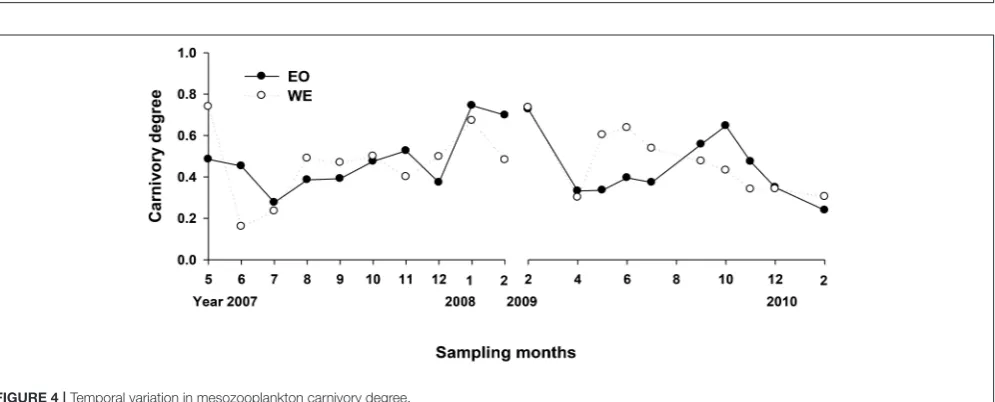
The net carnivory degrees of mesozooplankton assemblage ranged from 0.16 to 0.75 (Figure 4), indicating that mesozooplankton assemblage were overall omnivorous but with feeding selectivity (either phytoplankton or microzooplankton). The difference between the two stations was not significant (Paired-t-test, p > 0.05), but the variation trend was not consistent between years. A slight increase of carnivory degrees from summer to winter was observed for the first sampling year for both stations, while there was a decrease for the second sampling year at the same period for WE and a decrease starting at autumn for EO. Overall, a gradient of carnivory degree was achieved for treatments of mesozooplankton feeding experiment. In half of treatments (months), carnivory degrees of grazer assemblage were smaller than 0.5; whereas the degree was around 0.5 in a quarter of treatments and was>0.5 in the rest.
Looking at the composition (percentage in abundance), species with carnivory degree<0.5 generally dominated in grazer assemblages for most months, primarily due to Parvocalanus crassirostris, Paracalanus spp. and their developmental forms, marine cladocerans, and tunicates. In several cases during the winter at PM7, the assemblage were dominated by noctilucales with carnivory degree >0.5. High carnivory degree during autumn in the second sampling year was primarily due to contributions of Acartia erytharea and Corycaeus spp. The dominance of highly carnivorous species was different between years at WE where noctilucales dominated in the first sampling year whileAcartia spinicaudaandAcartiella sinesisdominated in the second sampling year.
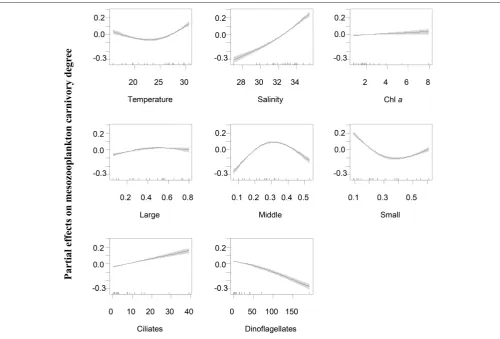
Generalized additive models analyses revealed that the variations of mesozooplankton carnivory degree were significantly and nonlinearly correlated with variable factors
(Table 2). The deviances explained by the models were 92.9 and
FIGURE 2 |Temporal variation in environmental variables in Hong Kong coastal waters:(A)temperature,(B)salinity and(C)Chlaconcentration.
biomass (Figure 6). Overall, carnivory degree was independent on Chl a concentrations and the percentage of large-sized phytoplankton (>20 µm). While the percentages of
middle-and small-sized phytoplankton significantly contributed to explain the deviance of mesozooplankton carnivory degree. The partial effects were high when the percentage of middle-sized phytoplankton in total phytoplankton was around 30% and the percentage of small-sized phytoplankton was low. This situation primarily occurred during the winter
(Figure 3).
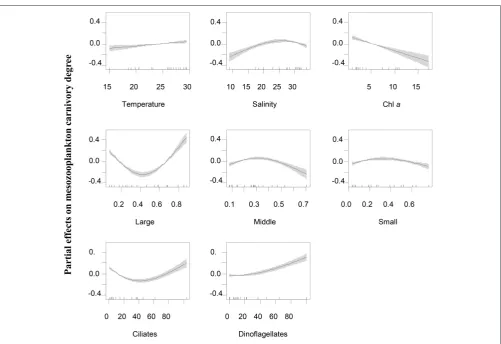
At WE, mesozooplankton carnivory degree increased with increasing dinoflagellates, decreased with increasing Chl a
concentrations and was independent on temperature (Figure 6). The partial effect by salinity generally increased until when salinity reached 25. The partial effect by ciliates on the variation of mesozooplankton carnivory had a U-shaped relationship with ciliate biomass. It was contrasting to EO if only considering the lower scale of biomass (0–40 µg l−1) that the partial
effect of ciliates decrease at WE until when ciliate biomass was larger than 40 µg l−1. The partial effect by large-sized
phytoplankton (>20µm) on mesozooplankton carnivory degree
FIGURE 3 |Composition of Chlain different size-fractionated phytoplankton. Large-sized: phytoplankton>20µm; Middle-sized: phytoplankton 2∼20µm in the first sampling year and phytoplankton 5∼20µm in the second sampling year; Small-sized: phytoplankton<2µm in the first sampling year and phytoplankton<5
µm in the second sampling year.
FIGURE 4 |Temporal variation in mesozooplankton carnivory degree.
Mesozooplankton Clearance Rate
Calculated from the change of Chl a concentrations, mesozooplankton clearance rate in this study is the clearance of
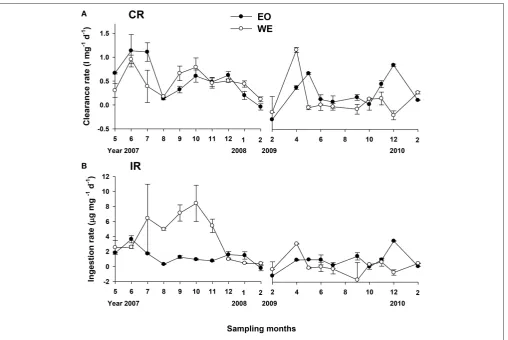
result showed that mesozooplankton clearance rate on total phytoplankton ranged from−0.3 to 1.1 l mg−1 d−1 and from −0.2 to 1.1 l mg−1d−1at EO and WE, respectively (Figure 7A).
TABLE 2 |Coefficients (F) and significance levels (p) of the effects of variable predictors on mesozooplankton carnivory using Generalized additive model test.
Predictors EO WE
F p F p
Temperature 14.4 <0.001 2.2 n.s.
Salinity 58.5 <0.001 5.6 0.007
Chla 1.2 n.s. 9.1 0.004
Large 2.2 n.s. 12.5 <0.001
Middle 69.7 <0.001 5.3 0.011
Small 69.1 <0.001 1.5 n.s.
Ciliates 27.6 <0.001 13.3 <0.001
Dinoflagellates 42.2 <0.001 7.7 0.002
Predictors include temperature, salinity, biomass of ciliates and dinoflagellates, Chl a concentrations of large-sized (Large), middle-sized (Middle) and small-sized (Small) phytoplankton. n.s. means no significance.
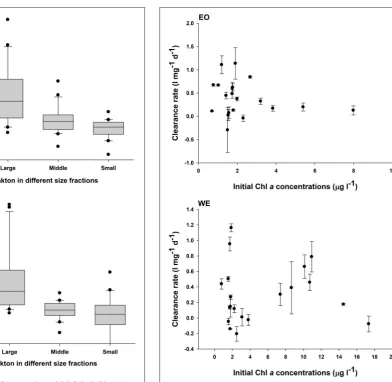
No significant difference of mesozooplankton clearance rates between the two stations was found (Paired-t-test, p > 0.05). Seasonal pattern was also unclear. Nevertheless, negative clearance rates were only observed during the winter. Peaks of clearance rates were primarily observed during the spring. The clearance rates on different size fractions of phytoplankton were significantly different (one-way ANOVA, p < 0.001), indicating that mesozooplankton had strong feeding selectivity based on prey sizes. Generally, clearance rates on large-sized phytoplankton were higher than those on middle- and small-sized phytoplankton (Figure 8). Median rates on middle-and small-sized phytoplankton was close to or less than zero, indicating that the grazing effects due to mesozooplankton was minor or negative on these size-spectra of phytoplankton (note that negative grazing rate causes increase of phytoplankton). Due to the negative clearance rates on small phytoplankton, the median rates for total phytoplankton were smaller than those on the large-sized phytoplankton.
Overall, the variations of clearance rates were independent to variations of total Chl a concentrations at both stations
(Figure 9), until the concentration was higher than 10µg l−1at
WE where a functional response of clearance rate occurred. The
FIGURE 6 |Partial effects of variable predictors on mesozooplankton carnivory rate at station WE. Predictors includes temperature, salinity, Chlaconcentrations, percentages of large-sized (Large), middle-sized (Middle) and small-sized phytoplankton (Small) in total phytoplankton community, ciliate biomass and dinoflagellate biomass. Shades indicate 95% of confidence interval.
relationship between clearance rate and total Chlaconcentration suggested that food condition for mesozooplankton at most cases was overall unsaturated.
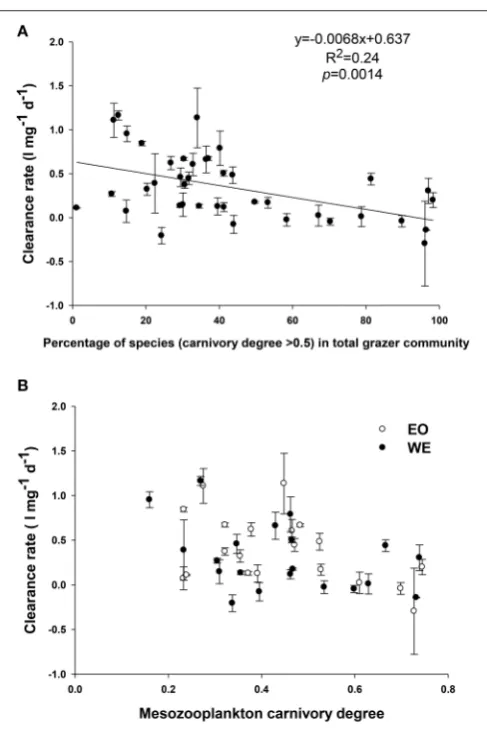
Mesozooplankton clearance rates were significantly correlated with mesozooplankton composition (Figure 9B) and carnivory degree (Figure 9C). Generally, the clearance rates decreased when the percentage of species with high carnivory degree (such as Acartia, Corycaeus, Oithona, and Noctiluca) in total mesozooplankton assemblage increased (Figure 11). On the other hand, the rates increased with increasing percentage of species with low carnivory degree (such as
Penilia,Appendicularians,and barnacle larvae). The rates were not influenced by percentage of species with intermediate carnivory degree (such as Temora and Centropages). The relationship between clearance rates and the net carnivory degree of the entire mesozooplankton assemblage, shown in
Figure 9C, indicated that mesozooplankton clearance rate or
grazing rate was reduced by increasing carnivory degree (Linear regression, R2= 0.2, p = 0.004). This pattern was consistent between stations, despite of different dominant high carnivorous species.
Mesozooplankton Ingestion Rate and
Grazing Impacts
The specific ingestion rate of mesozooplankton (the rate for a given amount of mesozooplankton community) on total phytoplankton Chl a ranged from −1.165 to 3.638 and from
−1.707 to 8.418 µg mg−1 d−1 at EO and WE, respectively
(Figure 7B). Rates were apparently higher during the wet season
at WE in the first year associated with high Chlaconcentrations
(Figure 2C).
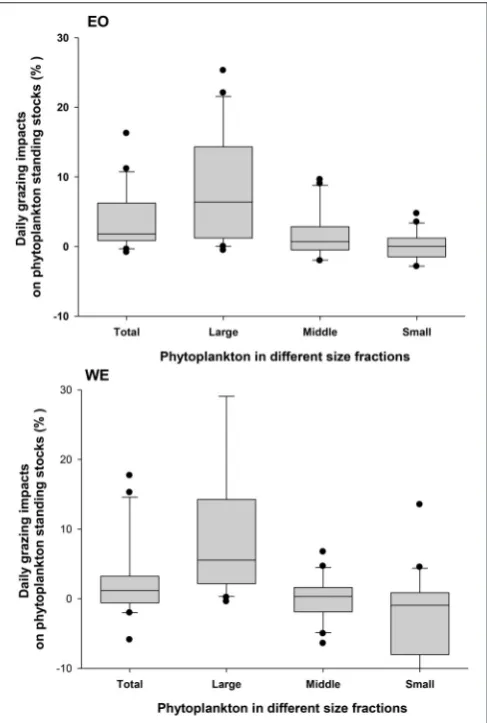
Averaged daily grazing impacts on total phytoplankton Chl
a standing stock were 3.8% (ranging from −0.8 to 16.2%) and 3.2% (−5.9 ∼ 17.7%) at EO and WE, respectively
(Figure 11). There was not a significant difference between
the two stations (Independent t-test, p > 0.05). For different size fractions, grazing impacts on large-sized phytoplankton were significantly higher than middle-sized and small-sized phytoplankton for both stations (one-way ANOVA,p<0.001;
Figure 11), suggesting an apparent size-selectivity. Mean impacts
FIGURE 7 |Temporal variation in mesozooplankton(A)clearance rates (CR) and(B)ingestion rates (IR) on total phytoplankton.
primarily occurred during late autumn and winter at EO, while occurred during summer at WE. Mesozooplankton grazing had minor mean impacts on middle-sized (1.4 ±4.4% for EO and
−0.1 ±3.1% for WE) and negative mean impacts small-sized phytoplankton (−0.3±3.1% for EO and−3.8±9.9% for WE) at both stations.
DISCUSSION
The Net Effect of Mesozooplankton
Feeding on Phytoplankton
In this study, we measured relatively low daily grazing impacts (mean impacts around 3%) of mesozooplankton on phytoplankton, which is a result of phytoplankton ingested by mesozooplankton and indirect increase of phytoplankton due to trophic cascading induced by mesozooplankton grazing on microzooplankton grazers at both a coastal and an estuarine stations. Abundance of mesozooplankton was not the reason for causing such low impacts, since we had reported that mesozooplankton abundance in these two stations were generally higher, especially during some specific seasons like late spring and summer (Chen et al., 2011). The mean impacts were similar to that in the shelf water (5%) and oceanic water (3.7%) of the adjacent northern South China Sea (Chen et al., 2015). However,
if only large-sized phytoplankton (>20µm) were considered, the
mean impacts were much higher (8.3 to 9.7%), which suggests an increase of mid- and/or small-sized phytoplankton due to inefficient ingestion of mesozooplankton on small cells and possible trophic cascading due to mesozooplankton feeding on microzooplankton grazers.
FIGURE 8 |Mesozooplankton clearance rates on total phytoplankton community (Total) and phytoplankton with different sizes (Large:>20µm; Middle: 2∼20µm and 5∼20µm in the first and the second sampling year, respectively; Small:<2 and<5µm in the first and the second sampling year, respectively) at the two stations EO and WE. Data are expressed as median (horizontal bar) with 25th–75th (box) and 10th–90th (whiskers) percentiles.
overall independent of total abundance of phytoplankton in terms of chlorophyll a concentrations in Hong Kong coastal and estuarine waters (Figure 9A), indicating that the food concentrations were generally unsaturated and were not a critical factor to influence mesozooplankton clearance rates except in 2 months (August 2007 and September 2009) during which phytoplankton (mainly diatoms) bloom occurred after a maximum river discharge. The filtration activities by filtering feeders were substantially reduced in responding to the extremely high concentrations of particles during blooms due to functional response (Frost, 1972, 1977).
The grazing impacts of mesozooplankton on total phytoplankton can be counter balanced by trophic cascades, referred by negative clearance rates, especially when trophic cascade effect was greater than direct grazing rate because that the suppression of microzooplankton would in turn cause an increase of phytoplankton (Nejstgaard et al., 2001; Liu
FIGURE 9 |Relationship between mesozooplankton clearance rates and phytoplankton Chlaconcentrations in the two stations of Hong Kong waters: EO and WE
and Dagg, 2003; Olson et al., 2006). The cascading effect was generally neglected for mesozooplankton feeding until when an attempt to calculate the real mesozooplankton grazing rate on phytoplankton by correction factor was published by
Nejstgaard et al. (2001). Overall, trophic cascades induced by marine mesozooplankton are still not received much attention due to difficult quantification (Froneman, 2002; Stibor et al., 2004; Sommer and Sommer, 2006; Zöllner et al., 2009). Chen and Liu (2011)attempted to quantify the trophic cascading rate by investigating the difference of microzooplankton grazing rate caused by copepod predation through laboratory simulation. However, it is still hard to be applied in field studies unless parallel dilution experiments measuring microzooplankton grazing rates and microzooplankton cell counting are also carried out, which requires a large expenditure of labor.
confirmed the traditional view that mesozooplankton were acting as potential grazers to control phytoplankton total biomass, primarily those of large-sized phytoplankton and to shape the prey structure by stimulating small-sized phytoplankton.
The Effect of Mesozooplankton
Size-Selective Feeding
We found a significant size-selectivity of mesozooplankton feeding, which caused a greater clearance rate and a grazing impact on large-sized phytoplankton than those on middle-sized phytoplankton and a negative impact on small-sized phytoplankton (Figures 8, 10). A major proportion of mesozooplankton filtering-feeder species exhibit size-selective feeding behavior and prefer large-sized phytoplankton, determined by limits of feeding appendages. Our results showed that large-sized phytoplankton (>20µm) (mainly diatoms and
dinoflagellates) were generally cleared by mesozooplankton with high rates, which had also been reported by many field studies in coastal and estuarine waters (e.g.,Liu and Dagg, 2003; Liu et al., 2010). Therefore, the general role of mesozooplankton in natural seawaters was to directly consume large-sized phytoplankton (mostly diatoms and autotrophic dinoflagellates), which made the consumers important in the classic food chain, in addition to regulating microbial food web.
It was only when the microzooplankton assemblage were predominated by heterotrophic dinoflagellates which are able to consume prey like chain-forming diatoms with size similar to predators (Jacobson and Anderson, 1986 and Jeong et al., 2004) and the suppression of such heterotrophic dinoflagellates by copepods would eventually cause trophic cascades on chain-forming diatoms (Chen and Liu, 2011). Therefore, the strength and importance of trophic cascades on this size fraction of phytoplankton were dependent on the abundance and composition of microzooplankton in addition to the feeding preference of mesozooplankton assemblage (herbivores or omnivores).
On contrary, instead of direct consumption, the phenomena of trophic cascades were generally the case for small-sized phytoplankton (<5µm) referred by negative mesozooplankton
clearance rate measured by this study (Figure 8). Generally, small-sized phytoplankton (<5µm) were the preferential food
items for microzooplankton, while they were generally too small to be directly ingested by the majority of mesozooplankton species (Calbet and Landry, 1999; Froneman, 2002; Liu and Dagg, 2003; Liu et al., 2005a and this study). A parallel study of our research through HPLC pigment analysis also showed that the clearance rates of mesozooplankton on small-sized phytoplankton, green algae and Synechococcus, were generally negative due to trophic cascades (Liu et al., 2010).
[image:13.595.306.550.59.424.2]However, positive clearance rates on small-sized phytoplankton were also occasionally found at specific months, associated with high abundance of fine-filtering feeders like tunicates and barnacle larvae, which played a similar role of microzooplankton. In our sampling waters, barnacle larvae were mainly abundant during the period after the maximum river discharge when phytoplankton became bloom (Chen et al., 2011). Tunicates, mainly larvaceans, were abundant during
FIGURE 10 |Relationship between clearance rate and(A)percentage of mesozooplankton with a carnivory degree>0.5 in total assemblage;(B)net carnivory degree of mesozooplankton assemblage
winter and spring at the coastal stations and abundant at the month of the maximum river discharge (Chen et al., 2011). We believe that the role of larvaceans in direct consumption in other months was overall limited by low abundance and copepod carnivorous predation on eggs and adults of larvaceans (Sommer et al., 2003; López-Urrutia et al., 2004). Another factor that contributed to clear small-sized phytoplankton in mesozooplankton feeding bottles was a top-down control by elevated heterotrophic nanoflagelates through trophic cascades. This two-level trophic cascading effect was also demonstrated by mesocosm studies that mesozooplankton predation decreased microzooplankton abundance causing a trophic cascading on heterotrophic nanoflagelates and such trophic cascades further extended to the level of the food of heterotrophic nanoflagelates (Zöllner et al., 2003, 2009). However, this kind of two-level trophic cascade will be dampened to null by high diversity of small-sized of phytoplankton and compensation of anti-predation for a longer incubation time-scale, suggested by
FIGURE 11 |Mesozooplankton grazing impacts on total phytoplankton community (Total) and phytoplankton with different sizes (Large:>20µm; Middle: 2∼20µm and 5∼20µm in the first and the second sampling year, respectively; Small:<2 and<5µm in the first and the second sampling year, respectively) at the two stations EO and WE. Data are expressed as median (horizontal bar) with 25th–75th (box) and 10th–90th (whiskers) percentiles.
For middle-sized phytoplankton (mainly nanoflagelates and single cell diatoms), the mean clearance rates on were close to zero at both waters (Figure 8), indicative that the effects of direct consumption and trophic cascades on this size fraction of phytoplankton were almost equivalent because they were vulnerably ingested by both trophic levels of grazers (mesozooplankton and microzooplankton). The mesozooplankton in this study occasionally exerted high grazing pressures on nanoflagelates when fine-filtering feeders such as copepod copepodites, marine cladocerans and veliger larvae were abundant in the assemblages during summer period (July to September) at the coastal stations (EO).
The Effect of Mesozooplankton Carnivory
The key finding of this study was that the variations of mesozooplankton clearance rates or grazing impacts were significantly influenced by the variations of carnivory degree (the level of ingesting protozoan and animal prey)
of mesozooplankton assemblage in Hong Kong coastal waters
(Figures 9B,C), which in turn were influenced by interactive
effects of planktonic abundances and physical environmental parameters (Table 2, Figures 5, 6). This result demonstrated that the flexibility of feeding behavior of mesozooplankton was an important factor to regulate the trophic interactions. The net carnivory degree of an assemblage was balanced from the composition of species with different feeding behaviors. High composition of relatively herbivorous species (carnivory degree
<0.5) generally caused an increase of clearance rate, while high composition of relatively carnivorous species (carnivory degree
>0.5) caused a decrease (Figure 9B). Moreover, carnivorous and omnivorous species survived well by raptorial feeding behavior during blooms, preying on aggregates and motile organisms such as heterotrophic dinoflagellates and ciliates for better nutrition, since these food items might be well coupled with bloom organisms directly or indirectly. For example, we observed a quite high composition of Oithona(15.6%) at the first-year bloom (Chen et al., 2011) and high composition of Acartia (18.2%) at the $$$second-year bloom (data no shown). Although microzooplankton might contribute less than phytoplankton to mesozooplankton diets in terms of ingestion rates in rich food conditions (Calbet and Saiz, 2005; Liu et al., 2005b), our result suggested that carnivorous feeding was always a reason for the reduction of the clearance rate of phytoplankton by mesozooplankton assemblage even during phytoplankton bloom in addition to functional response. Preference on microzooplankton by copepods during phytoplankton bloom and associated trophic cascades were also reported in other coastal and estuarine waters (e.g.,Fessenden and Cowles, 1994; Liu et al., 2005a).
The mechanism that increasing carnivory degree of omnivorous mesozooplankton assemblage reduces the net clearance rates is primarily a combination of a weakening direct consumption and enhancing indirect trophic cascades on phytoplankton. It is difficult to separate whichever was more important because they usually take place simultaneously due to the fact that in a highly carnivorous assemblage, more individuals feed in ambush mode, while fewer individuals feed in suspension-filtering mode. In situations that mesozooplankton assemblage were highly carnivorous, motile organisms like ciliates and dinoflagellates are cleared with high rates, while most non-motile phytoplankton were simultaneously cleared with low rates (Zeldis et al., 2002; Gifford et al., 2007). On the other hand, a relatively herbivorous assemblage dominated by marine cladocerans, tunicates and suspension-feeding copepods clear more phytoplankton than microzooplankton (Sommer and Stibor, 2002). While some omnivorous species likeTemoraand
Centropageare generalist grazers that clear both groups of prey equivalently (Kozlowsky-Suzuki et al., 2006); increasing of their percentage in assemblage does not change the clearance rates.
biomass, suggesting that ciliates might be the most important trophic intermediates in mesotrophic conditions as foods for
Corycaeus spp., Oithona spp. and noctilucales. Dinoflagellate biomass at this station had a negative effect and caused a decline of carnivory degree, suggesting that they were not the critical protozoan food for carnivorous species. However, a parallel study had shown that autotrophic dinoflagellates were significantly preferred by mesozooplankton assemblage compared to other phytoplankton food (Liu et al., 2010), suggesting that dinoflagellates at EO were probably autotrophic. Total Chl a concentrations were overall low at EO, so that the variations of phytoplankton levels had no effect on mesozooplankton carnivory. On the other hand, variations of total Chl a concentrations were large at the estuarine station (WE) that the increase of phytoplankton level overall caused a decline of mesozooplankton carnivory. Both ciliates and dinoflagellates at this estuarine station were important to increase mesozooplankton carnivory, while they might serve at different situations. For example, dinoflagellates associated with diatom blooms during wet season were probably important for high carnivorous species likeA. spinicaudaandA. sinesis, while ciliates may be important for noctilucales, Corycaeus spp. and
Oithonaspp. similar to that of the coastal stations. Size-structure of phytoplankton community in terms of size-fractionated Chla
may also affect mesozooplankton carnivory degree. The increase of percentage of middle-sized and small-sized phytoplankton during summer at the coastal stations appeared to favor herbivorous species like marine cladocerans and tunicates. The increase of percentage of large-sized phytoplankton such as chain-forming and blooming diatoms in the estuarine stations was linked to the occurrence of heterotrophic dinoflagellates and indirectly increased mesozooplankton carnivory degree.
Another potential factor that also contributed to lower the clearance rates of mesozooplankton was the low temperature in winters, during which the metabolic activity of mesozooplankton was reduced by low temperature. Nevertheless, the partial effect of temperature (GAM,F=5.0,p=0.008) was much less than the partial effect of carnivory (GAM,F=26.9,p<0.001) based on results of GAM analysis.
The shortcoming of this study is that we used a coarse determination of feeding habits of mesozooplankton assemblage by multiplying a set ratio of individual carnivory with percentage of each individual in the assemblage. We believed that even for individuals, their carnivory degree could change with food and environmental conditions from seasons to seasons, at least for those generalist feeders and for those species that are able to switch feeding behaviors. For example,Kiørboe et al. (1996)
showed thatAcartiawere able to switch feeding behaviors from filtering feeding to ambush feeding depending on phytoplankton concentrations. Thus, the real carnivory degree of such species is difficult to determine. Feeding behaviors of decapod larvae are diverse (including herbivorous, omnivorous, and carnivorous;
Le-Vay et al., 2001). Because the identification of decapods larvae was rather difficult, their feeding behavior was set as generalist feeders with a middle carnivory degree. We believed that a better determination of mesozooplankton carnivory degree together with feeding rate measurements will allow better understanding of the effect of mesozooplankton feeding behavior on planktonic food web interactions in future. For example, (Stevens et al., 2004a,b) proposed a potential method to determine omnivory degree by using stable isotope or fatty acid biomarkers to track the feeding history of new captured copepods.
CONCLUSION
In conclusion, our study found that mesozooplankton overall had a low impact in consuming phytoplankton at coastal and estuarine waters, except some specific months. Such low grazing impact was primarily because the assemblage of mesozooplankton was overall omnivorous with varying degree of carnivory. The carnivory degree of a mesozooplankton assemblage was moderated by changes of environmental parameters and food conditions, such as the biomass of ciliates and dinoflagellates and the size structure of phytoplankton community in the coastal and estuarine waters. An increase in the carnivory degree resulted in the decrease of mesozooplankton herbivory due to reduced direct consumption and enhanced trophic cascades by suppressing microzooplankton grazing. However, trophic cascades induced by mesozooplankton were size-dependent; mesozooplankton in natural seawater generally facilitates the growth of small-sized phytoplankton (<5 µm),
which regulates microbial food web structure and function, and substantially consumes large-sized phytoplankton (>20 µm),
transferring biomass directly to higher trophic levels.
Potentially, we can use the empirical relationship between carnivory degree derived from community composition and mesozooplankton clearance rate to predict the feeding rate of the omnivorous mesozooplankton assemblage in the nature.
AUTHOR CONTRIBUTIONS
HL designed the experiments; MC and BC carried out the experiments; MC and BC analyzed data; MC and HL wrote the manuscript; MC and HL revised and improved the manuscript.
ACKNOWLEDGMENTS
We thank L. Shek, P. Lee, Y. Tam, and E. Lau for their assistance in field sampling. We also thank Prof. Paul Harrison of UBC for English editing. This study was supported by National Natural Science Foundation of China (41306168) provided to MC and by Hong Kong Research Grant Council (661610 and 661911) provided to HL. BC was also supported by a Grants-in-Aid for Scientific Research (KAKENHI)(JP16K21701) of JSPS.
REFERENCES
Ambler, J. W., and Frost, B. W. (1974). The feeding behavior of a predatory planktonic copepod, Tortanus discaudatus.Limnol. Oceanogr.19, 446–451.
Atienza, D., Saiz, E., and Calbet, A. (2006). Feeding ecology of the marine cladoceranPenilia avirostris: natural diet, prey selectivity and daily ration.Mar. Ecol. Prog. Ser.315, 211–220. doi: 10.3354/meps315211
evacuation rate. J. Plankton Res. 18, 1387–1405. doi: 10.1093/plankt/18. 8.1387
Båmstedt, U., Gifford, D., Atkinson, A., Irigoien, X., and Roman, M. (2000). “Feeding,” inICES Zooplankton Methodology Manual,eds R. P. Harris, P. H. Wiebe, J. Lenz, H. R. Skjoldal, and M. Huntley (London: Academic press), 297–399.
Borer, E. T., Seabloom, E. W., Shurin, J. B., Anderson, K. E., Blanchette, C. A., Broitman, B., et al. (2005). What determines the strength of a trophic cascade?
Ecology86, 528–537. doi: 10.1890/03-0816
Bradford-Grieve, J. M. (2004). Deep-sea benthopelagic calanoid copepods and their colonization of the near-bottom environment.Zool. Stud.43, 276–291. Calbet, A., François, C., and Raymond, G. (2007). The feeding ecology of
the copepod Centropages typicus (Kröyer). Prog. Oceanogr. 72, 137–150. doi: 10.1016/j.pocean.2007.01.003
Calbet, A., and Landry, M. R. (1999). Mesozooplankton influences on the microbial food web: direct and indirect trophic interactions in the oligotrophic open ocean.Limnol. Oceanogr.44, 1370–1380. doi: 10.4319/lo.1999.44.6.1370 Calbet, A., and Landry, M. R. (2004). Phytoplankton growth, microzooplankton
grazing, and carbon cycling in marine systems.Limnol. Oceanogr.49, 51–57. doi: 10.4319/lo.2004.49.1.0051
Calbet, A., Landry, M. R., and Scheinberg, R. D. (2000). Copepod grazing in a subtropical bay: species-specific responses to a midsummer increase in nanoplankton standing stock. Mar. Ecol. Prog. Ser. 193, 15–84. doi: 10.3354/meps193075
Calbet, A., and Saiz, E. (2005). The ciliate-copepod link in marine ecosystems.
Aquat. Microb. Ecol.38, 157–167. doi: 10.3354/ame038157
Chen, B. Z., Liu, H. B., Landry, M. R., Chen, M. R., Sun, J., Shek, L. L., et al. (2009). Estuarine nutrient loading affects phytoplankton growth and microzooplankton grazing at two contrasting sites in Hong Kong coastal waters.Mar. Ecol. Prog. Ser.379, 77–90. doi: 10.3354/meps07888
Chen, M., Chen, B., Harrison, P. J., and Liu, H. (2011). Dynamics of mesozooplankton assemblages in subtropical coastal waters of Hong Kong: a comparative study between a eutrophic estuarine and a mesotrophic coastal site.Cont. Shelf Res.31, 1075–1086. doi: 10.1016/j.csr.2011.03.011
Chen, M., and Liu, H. (2011). Experimental simulation of trophic interactions among omnivorous copepods, heterotrophic dinoflagellates and diatoms.J. Exp. Mar. Biol. Ecol.403, 65–74. doi: 10.1016/j.jembe.2011.04.009
Chen, M., Liu, H., Song, S., and Sun, J. (2015). Size-fractionated mesozooplankton biomass and grazing impact on phytoplankton in Northern South China Sea during four seasons. Deep Sea Res. II 117, 108–118. doi: 10.1016/j.dsr2.2015.02.026
Dam, H. G., and Lopes, R. M. (2003). Omnivory in the calanoid copepod Temora longicornis: feeding, egg production and egg hatching rates.J. Exp. Mar. Biol.
Ecol.292, 119–137. doi: 10.1016/S0022-0981(03)00162-X
Deibel, D. (1986). Feeding mechanism and house of the appendicularian
Oikopleura vanhoeffeni. Mar. Biol.93, 429–436. doi: 10.1007/BF00401110 Egloff, D. A. (1988). Food and growth relations of the marine microzooplankter,
Synchaeta Cecilia(Rotifera).Hydrobiol.157, 129–141. doi: 10.1007/BF00006966 Fauchald, K., and Jumars, P. A. (1979). The diet of worms: a study of Polychaete
feeding guilds.Oceanogr. Mar. Biol. Ann. Rev.17, 193–284.
Fessenden, L., and Cowles, T. J. (1994). Copepod predation on phagotrophic ciliates in Oregon coastal waters. Mar. Ecol. Prog. Ser. 107, 103–111. doi: 10.3354/meps107103
Froneman, P. W. (2002). Trophic cascading in an oligotrophic temperate estuary, South Africa.J. Plankton Res.24, 807–816. doi: 10.1093/plankt/24.8.807 Frost, B. W. (1972). Effects of size and concentration of food particles on the
feeding behavior of the marine planktonic copepodCalanus pacificus.Limnol. Oceanogr.17, 805–815. doi: 10.4319/lo.1972.17.6.0805
Frost, B. W. (1977). Feeding behavior ofCalanus pacificusin mixtures of food particles.Limnol. Oceanogr.22, 472–491. doi: 10.4319/lo.1977.22.3.0472 Gifford, D. J. (1991). The protozoan-metazoan trophic link in pelagic ecosystems.
J. Protozool.38, 81–86. doi: 10.1111/j.1550-7408.1991.tb04806.x
Gifford, S. M., Rollwagen-Bollens, G., and Bollens, S. M. (2007). Mesozooplankton omnivory in the upper San Francisco estuary.Mar. Ecol. Prog. Ser.348, 33–46. doi: 10.3354/meps07003
Hansson, L. J., and Kiørboe, T. (2006). Prey-specific encounter rates and handling efficiencies as causes of prey selectivity in ambush-feeding hydromedusae.
Limnol. Oceanogr.51, 1849–1858. doi: 10.4319/lo.2006.51.4.1849
Heron, A. C. (1973). A Specialized predator-prey relationship between the copepod
Sapphirina angustaand the pelagic tunicateThalia democratica.J. Mar. Biol.
Ass. U.K.53, 429–435. doi: 10.1017/s0025315400022372
Hunter, J. R. (1980). “The feeding behavior and ecology of marine fish larvae,”
inFish Behavior and Its Use in the Capture and Culture of Fishes.ICLARM
Conference Proceedings(Manila), 287–330.
Huo, Y., Wang, S., Sun, S., Li, C., and Liu, M. (2008). Feeding and egg production of the planktonic copepodCalanus sinicusin spring and autumn in the Yellow Sea, China.J. Plankton Res.30, 723–734. doi: 10.1093/plankt/fbn034 Irigoien, X., Verheye, H. M., Harris, R. P., and Harbour, D. (2005). Effect of food
composition on egg production and hatching success rate of two copepod species (Calanoides carinatus and Rhincalanus nasutus) in the Benguela upwelling system.J. Plankton Res.27, 735–742. doi: 10.1093/plankt/fbi046 Jacobson, D. M., and Anderson, D. M. (1986). Thecate heterotrophic
dinoflagellates: feeding behavior and mechanism. J. Phycol. 22, 249–258. doi: 10.1111/j.1529-8817.1986.tb00021.x
Jeong, H. J., Yoo, Y. D., Kim, S. T., and Kand, N. S. (2004). Feeding by the heterotrophic dinoflagellateProtoperidinium bipeson the diatomSkeletonema costatum.Aquat. Microb. Ecol.36, 171–179. doi: 10.3354/ame036171 Katechakis, A., and Stibor, H. (2004). Feeding selectivities of the marine
cladoceransPenilia avirostris,Podon intermedius,andEvadne nordmanni.Mar.
Biol.145, 529–539. doi: 10.1007/s00227-004-1347-1
Kim, S. W., Onbé, T., and Yoon, Y. H. (1989). Feeding habits of marine cladocerans in the Inland Sea of Japan.Mar. Biol.100, 313–318. doi: 10.1007/BF00391145 Kiørboe, T., Andersen, A., Langlois, V. J., Jakobsen, H. H., and Bohr, T. (2009).
Mechanisms and feasibility of prey capture in ambush-feeding zooplankton.
Proc. Natl. Acad. Sci. U.S.A. 106, 12394–12399. doi: 10.1073/pnas.0903350106 Kiørboe, T., and Saiz, E. (1995). Planktivorous feeding in calm and turbulent
environments, with emphasis on copepods.Mar. Ecol. Prog. Ser.122, 135–145. doi: 10.3354/meps122135
Kiørboe, T., Saiz, E., and Viitasalo, M. (1996). Prey switching behavior in the plantonic copepodAcartia tonsa. Mar. Ecol. Prog. Ser. 143, 65–75. doi: 10.3354/meps143065
Kleppel, G. S. (1993). On the diets of calanoid copepods.Mar. Ecol. Prog. Ser.99, 183–195. doi: 10.3354/meps099183
Kleppel, G. S., Frazel, D., Pieper, R. E., and Holliday, D. V. (1988). Natural diets of zooplankton off southern California.Mar. Ecol. Prog. Ser.49, 231–241. doi: 10.3354/meps049231
Koski, M., Kiørboe, T., and Takahashi, K. (2005). Benthic life in the pelagic: aggregate encounter and degradation rates by pelagic harpacticoid copepods.
Limnol. Oceanogr.50, 1254–1263. doi: 10.4319/lo.2005.50.4.1254
Kozlowsky-Suzuki, B., Carlsson, P., Rühl, A., and Granéli, E. (2006). Food selectivity and grazing impact on toxic Dinophysis spp. by copepods feeding on natural plankton assemblages. Harmful Algae 5, 57–68. doi: 10.1016/j.hal.2005.05.002
Landry, M. R., Lehner-Fournier, J. M., and Fagerness, V. L. (1985). Predatory feeding behavior of the marine cyclopoid copepodCorycaeus anglicus.Mar.
Biol.85, 163–169. doi: 10.1007/BF00397435
Le-Vay, L., Jones, D. A., Puello-Cruz, A. C., Sangha, R. S., and Ngamphongsai, C. (2001). Digestion in relation to feeding strategies exhibited by crustacean larvae. Comp. Biochem. Physiol. A Mol. Integr. Physiol. 128, 623–630. doi: 10.1016/s1095-6433(00)00339-1
Levinsen, H., Turner, J. T., Nielsen, T. G., and Hansen, B. W. (2000). On the trophic coupling between protists and copepods in arctic marine ecosystems.Mar. Ecol. Prog. Ser.204, 65–77. doi: 10.3354/meps204065
Liu, H., Chen, M., Suzuki, K., Wong, C. K., and Chen, B. (2010). Mesozooplankton selective feeding in subtropical coastal waters as revealed by HPLC pigment analysis.Mar. Ecol. Prog. Ser.407, 111–123. doi: 10.3354/meps08550 Liu, H., and Dagg, M. (2003). Interactions between nutrients, phytoplankton
growth, and micro- and mesozooplankton grazing in the plume of the Mississippi River.Mar. Ecol. Prog. Ser.258, 31–42. doi: 10.3354/meps258031 Liu, H., Dagg, M. J., and Strom, S. (2005a). Grazing by the calanoid copepod
Neocalanus cristatuson the microbial food web in the coastal Gulf of Alaska.
J. Plankton Res.27, 647–662. doi: 10.1093/plankt/fbi039
López-Urrutia, Á., Harris, R. P., and Smith, T. (2004). Predation by calanoid copepods on the appendicularianOikopleura dioica.Limnol. Oceanogr.49, 303–307. doi: 10.4319/lo.2004.49.1.0303
Madin, L. P. (1974). Field observations on the feeding behavior of salps (Tunicata: Thaliacea).Mar. Biol.25, 143–147. doi: 10.1007/bf00389262
Marques, S. C., Pardal, M. A., Pereira, M. J., Pereira, M. J., Concalves, F., Marques, J. C., et al. (2007). Zooplankton distribution and dynamics in a temperate shallow estuary.Hydrobiologia587, 213–223. doi: 10.1007/s10750-007-0682-x Metz, C. (1998). Feeding of Oncaea curvata (Poecilostomatoida, Copepoda).Mar.
Ecol. Prog. Ser.169, 229–235. doi: 10.3354/meps169229
Nejstgaard, J. C., Gismervik, I., and Solberg, P. T. (1997). Feeding and reproduction
byCalanus finmarchicus, and microzooplankton grazing during mesocosm
blooms of diatoms and the coccolithophoreEmiliania huxleyi.Mar. Ecol. Prog. Ser. 147, 197–217. doi: 10.3354/meps147197
Nejstgaard, J. C., Naustvoll, L., and Sazhin, A. (2001). Correcting for underestimation of microzooplankton grazing in bottle incubation experiments with mesozooplankton. Mar. Ecol. Prog. Ser. 221, 59–75. doi: 10.3354/meps221059
Ohtsuka, S., and Onbé, T. (1991). Relationship between mouthpart structures
andin situfeeding habits of species of the family Pontellidae (Copepoda:
Calanoida).Mar. Biol.111, 213–225. doi: 10.1007/BF01319703
Olson, M. B., Lessard, E. J., Wong, C. H. J., and Bernhardt, M. J. (2006). Copepod feeding selectivity on microplankton, including the toxigenic diatoms
Pseudonitzschiaspp., in the coastal Pacific Northwest.Mar. Ecol. Prog. Ser.326, 207–220. doi: 10.3354/meps326207
Paffenhöfer, G. (1993). On the ecology of marine cyclopoid copepods (Crustacea, Copepoda).J. Plankton Res.15, 37–55. doi: 10.1093/plankt/15.1.37
Paffenhöfer, G. A. (1984). Food ingestion by the marine planktonic copepod
Paracalanusin relation to abundance and size distribution of food.Mar. Biol.
80, 323–333. doi: 10.1007/BF00392828
Pasternak, A. F., and Schnack-Schiel, S. B. (2001). Seasonal feeding patterns of the dominant Antarctic copepodsCalanus propinquusandCalanoides acutusin the Weddell Sea.Polar Biol.24, 771–784. doi: 10.1007/s003000100283
Putt, M., and Stocker, D. K. (1989). An experimentally determined carbon:volumn ratio for marine ‘oligotrichous’ ciliates from estuarine and coastal waters.
Limnol. Oceanogr.34, 1097–1103.
Quevedo, M., Gonzalez-Quiros, R., and Anadon, R. (1999). Evidence of heavy predation by Noctiluca scintillans on Acartia clausi (Copepoda) eggs off the central Cantabrian coast (NW Spain). Oceanol. Acta 22, 127–131. doi: 10.1016/S0399-1784(99)80039-5
Raby, D., Mingelbier, M., Dodson, J. J., Klein, B., Lagadeuc, Y., and Legendre, L. (1997). Food-particle size and selection by bivalve larvae in a temperate embayment.Mar. Biol.127, 665–672. doi: 10.1007/s002270050057
Rollwagen Bollens, G. C., and Penry, D. L. (2003). Feeding dynamics of Acartia spp. copepods in a large, temperate estuary (San Francisco Bay, CA).Mar. Ecol.
Prog. Ser.257, 139–158. doi: 10.3354/meps257139
Roman, M. R. (1978). Ingestion of the blue-green algaTrichodesmiumby the harpactacoid copepod,Macrosetella gracilis.Limnol. Oceanogr.23, 1245–1248. doi: 10.4319/lo.1978.23.6.1245
Roman, M. R., Smith, S., Wishner, K., Zhang, X., and Gowing, M. (2000). Mesozooplankton production and grazing in the Arabian Sea.Deep- Sea Res.
47, 1423–1450. doi: 10.1016/S0967-0645(99)00149-6
Sautour, B., and Castel, J. (1993). Feeding behaviour of the coastal copepod
Euterpina acutifronson small particles.Cah. Biol. Mar.34, 239–251. Scheinberg, R. D., Landry, M. R., and Calbet, A. (2005). Grazing of two
common appendicularians on the natural prey assemblage of a tropical coastal ecosystem.Mar. Ecol. Prog. Ser.294, 201–212. doi: 10.3354/meps294201 Sekiguchi, H., and Kato, T. (1976). Influence ofNoctiluca’s predation on the acartia
population in Ise bay, central Japan.J. Oceanogr. Soc. Japan32, 195–198. doi: 10.1007/BF02107121
Sheldon, R. W., Nival, P., and Rassoulzadegan, F. (1986). An experimental investigation of a flagellate-ciliate-copepod food chain with some observations relevant to the linear biomass hypothesis.Limnol. Oceanogr. 31, 184–188. doi: 10.4319/lo.1986.31.1.0184
Shurin, J. B., Borer, E. T., Seabloom, E. W., Anderson, K., Blanchette, C. A., Broitman, B., et al. (2002). A cross-ecosystem comparison of the strength of trophic cascades.Ecol. Lett.5, 785–791. doi: 10.1046/j.1461-0248.2002.00381.x Sommer, F., Hansen, T., Feuchtmayr, H., Santer, B., Tokle, N., and Sommer, U. (2003). Do calanoid copepods suppress appendicularians in the coastal ocean?
Sommer, U. (2008). Trophic cascades in marine and freshwater plankton.Internat. Rev. Hydrobiol.93, 506–516. doi: 10.1002/iroh.200711039
Sommer, U., and Sommer, F. (2006). Cladocerans versus copepods: the cause of contrasting top-down controls on freshwater and marine phytoplankton.
Oecologia147, 183–194. doi: 10.1007/s00442-005-0320-0
Sommer, U., and Stibor, H. (2002). Copepoda - cladocera - tunicata: the role of three major mesozooplankton groups in pelagic food webs.Ecol. Res.17, 161–174. doi: 10.1046/j.1440-1703.2002.00476.x
Stevens, C. J., Deibel, D., and Parrish, C. C. (2004a). Copepod omnivory in the North Water Polynya (Baffin bay) during autumn: spatial patterns in lipid composition.Deep-Sea Res. I51, 1637–1658. doi: 10.1016/j.dsr.2004.07.011 Stevens, C. J., Deibel, D., and Parrish, C. C. (2004b). Species-specific differences
in lipid composition and omnivory indices in arctic copepods collected in deep water during autumn (North Water Polynya).Mar. Biol.144, 905–915. doi: 10.1007/s00227-003-1259-5
Stibor, H., Vadstein, O., Diehl, S., Gelzleichter, A., Hansen, T., Hantzsche, F., et al. (2004). Copepods act as a switch between alternative trophic cascades in marine pelagic food webs.Ecol. Lett.7, 321–328. doi: 10.1111/j.1461-0248.2004.00580.x Stoecker, D. K., and Capuzzo, J. M. (1990). Predation on Protozoa: Its importance
to zooplankton.J. Plankton Res.12, 891–908. doi: 10.1093/plankt/12.5.891 Strathmann, R. R. (1971). The feeding behavior of plankotrophic Echinoderm
larvae: mechanisms, regulation, and rates of suspension-feeding.J. Exp. Mar.
Ecol.6, 109–160. doi: 10.1016/0022-0981(71)90054-2
Suzuki, K., Nakamura, Y., and Hiromi, J. (1999). Feeding by the small calanoid copepodParacalanussp. on heterotrophic dinoflagellates and ciliates.Mar. Ecol. Prog. Ser.17, 99–103. doi: 10.3354/ame017099
Szyper, J. P. (1978). Feeding Rate of the ChaetognathSagitta enflatain Nature.
Estuar. Coast. Mar. Sci.7, 567–575. doi: 10.1016/0302-3524(78)90065-8 The R Development Core Team (2009).R: A Language and Environment for
Statistical Computing.Vienna: The R Foundation for Statistical Computing. Timonin, A. G. (1971). The structure of plankton communities of the Indian
Ocean.Mar. Biol.9, 281–289. doi: 10.1007/BF00372822
Turner, J. T. (1984). The feeding ecology of some zooplankters that are important prey items of larval fish.NOAA Tech. Rep. NMFS7, 1–28.
Turner, J. T. (2004). The importance of small planktonic copepods and their roles in pelagic marine food web.Zool. Stud.43, 255–266.
Vargas, C. A., Manríquez, P. H., and Navarrete, S. A. (2006). Feeding by larvae of intertidal invertebrates: assessing their position in pelagic food webs.Ecology
87, 444–457. doi: 10.1890/05-0265
Verity, P. G., and Paffenhöfer, G. A. (1996). On assessment of prey ingestion by copepods.J. Plankton. Res.18, 1767–1779. doi: 10.1093/plankt/18.10.1767 Yang, E. J., Ju, S. J., and Choi, J. K. (2010). Feeding activity of the copepod Acartia
hongi on phytoplankton and microzooplankton in Gyeonggi bay, yellow sea.
Estuar. Coast. Shelf Sci.88, 292–301. doi: 10.1016/j.ecss.2010.04.005 Yin, K. (2002). Monsoonal influence on seasonal variations in nutrients
and phytoplankton biomass in coastal waters of Hong Kong in the vicinity of the Pearl River estuary. Mar. Ecol. Prog. Ser. 245, 111–122. doi: 10.3354/meps245111
Zeldis, J., James, M. R., Grieve, J., and Richards, L. (2002). Omnivory by copepods in the New Zealand Subtropical Frontal Zone.J. Plankton Res.24, 9–23. doi: 10.1093/plankt/24.1.9
Zöllner, E., Hoppe, H., Sommer, U., and Jürgens, K. (2009). Effect of zooplankton-mediated trophic cascades on marine microbial food web components (bacteria, nanoflagellates, ciliates).Limnol. Oceanogr.54, 262–275. doi: 10.4319/lo.2009.54.1.0262
Zöllner, E., Santer, B., Boersma, M., Hoppe, H.-G., and Jürgens, K. (2003). Cascading predation effects of Daphnia and copepods on microbial food web components. Freshwat. Biol. 48, 2174–2193. doi: 10.1046/j.1365-2426.2003.01158.x
Conflict of Interest Statement: The authors declare that the research was conducted in the absence of any commercial or financial relationships that could be construed as a potential conflict of interest.