British Journal of Social Psychology (2018) ©2018 The Authors. British Journal of Social Psychology published by John Wiley & Sons Ltd on behalf of British Psychological Society
www.wileyonlinelibrary.com
Testing the effects of explicit and implicit
bidimensional attitudes on objectively measured
speeding behaviour
Rebecca McCartan*
, Mark A. Elliott, Stefania Pagani,
Eimear Finnegan and Steve W. Kelly
School of Psychological Sciences and Health, University of Strathclyde, Glasgow, UK
Bidimensional attitudes have been shown to independently predict behaviour, with the positive dimension of attitude being a stronger predictor of behaviour than the negative dimension (e.g., Elliott, Brewster,et al., 2015,Br. J. Psychol, 106, 656). However, this positivity bias has been demonstrated with explicit attitude measures only and explicit attitude measures tap deliberative processes rather than automatic processes, which are known to be important in the execution of many behaviours. The aim of this study was to test whether implicit bidimensional attitudes can account for variance in speeding behaviour over and above explicit bidimensional attitudes and whether the positivity bias that is typically found with explicit attitudes generalizes to implicit attitudes. A total of 131 drivers completed a questionnaire measuring their explicit bidimensional attitudes towards speeding. They also completed Implicit Association Tests measuring their implicit bidimensional attitudes. Two weeks later, speeding behaviour was measured using a driving simulator. Explicit attitudes accounted for a significant proportion of the variance in subsequent speeding behaviour. Implicit attitudes accounted for a statistically significant increment to explained variance. The positive dimension of both explicit and implicit attitudes predicted speeding behaviour but the negative dimensions did not. Theoretical implications for understanding the potential attitudinal causes of behaviour and practical implications for behaviour-change interventions are discussed.
Attitudes are typically treated as unidimensional predictors of behavioural intentions and subsequent behaviour (e.g., Armitage & Conner, 2001; Eagly & Chaiken, 1993). In line with traditional conceptualizations of the attitude construct (e.g., Osgood, Suci, & Tannenbaum, 1957; Thurstone, 1928), this means that individuals are held to evaluate
behaviours along a single, bipolar, positive–negative dimension (e.g., ‘For me, speeding is
negative or positive’). The likelihood of a behaviour being performed is then held to increase with the extent to which it is evaluated positively rather than negatively (e.g., Fishbein, 1963). More recently, however, attitudes have been conceptualized as bidimensional predictors of behaviour (Elliott, Brewster, Thomson, Malcolm, & Rasmussen, 2015; McCartan & Elliott, 2018). This means that attitudes comprise separate unipolar, positive, and negative dimensions (e.g., ‘For me, speeding is not at all positive to
This is an open access article under the terms of the Creative Commons Attribution License, which permits use, distribution and reproduction in any medium, provided the original work is properly cited.
*Correspondence should be addressed to Rebecca McCartan, School of Psychological Sciences and Health, University of Strathclyde, 40 George Street, Glasgow G1 1QE, UK (email: [email protected]).
extremely positive’ and ‘For me, speeding is not at all negative to extremely negative’). The likelihood of a behaviour being performed is then held to increase with the extent to which it is evaluated positively and, at the same time, the extent to which it is not evaluated negatively. In this article, we present a study in which we tested these effects of bidimensional attitudes on drivers’ speeding behaviour. In line with recent research, we aimed to test the effects of explicit, questionnaire-based measures of bidimensional attitudes on subsequent behaviour. We also aimed to extend previous research by testing the extent to which implicit, cognitive test-based measures of bidimensional attitudes could increase the prediction of subsequent behaviour over and above the explicit measures.
Traditionally, attitudes have been conceptualized as unidimensional evaluations that are measured on single, bipolar scales (Allport, 1935). Several researchers, however, have questioned the singularity of the attitude construct and have distinguished between different components of attitudes. In particular, it is common for researchers (e.g., Elliott & Thomson, 2010; Elliott, Thomson, Robertson, Stephenson, & Wicks, 2013; Lawton, Conner, & McEachan, 2009; Rhodes, Blanchard, & Matheson, 2006) to distinguish between cognitive attitudes (positive or negative instrumental evaluations; e.g., ‘For me, speeding is harmful/beneficial’) and affective attitudes (e.g., positive or negative emotional evaluations; e.g., ‘For me, speeding is enjoyable/unenjoyable’). In both cases, however, attitudes are treated as unidimensional (i.e., positive or negative). This unidimensionality has previously attracted criticism (e.g., Kaplan, 1972) because it makes the midpoint of an attitude scale ambiguous, indicating either attitudinal indifference (i.e., a state that occurs when a behaviour is simultaneously evaluated as neither positive nor negative) or attitudinal ambivalence (i.e., a state that occurs when a behaviour is simultaneously evaluated as both positive and negative). As a solution to this problem, Kaplan (1972) recommended splitting the single positive/negative attitude dimension at its midpoint, thus producing a positive dimension and a separate negative dimension (i.e., bidimensional attitudes). Operationally, Kaplan (1972) recommended the split semantic differential technique as a method for measuring the two attitude dimensions because it allows individuals to evaluate the positive and negative attributes (consequences) of a behaviour independently on separate (positive and negative) unipolar scales, thereby acknowledging the possibility that positive and negative attitudes towards the same behaviour can coexist (Thompson, Zanna, & Griffin, 1995).
In support of the bidimensional conceptualization of an attitude, factor analytic studies have demonstrated that positive and negative behavioural evaluations load separately
onto two independent dimensions (e.g., Conneret al., 2002). However, attitudes have
continued to be treated as unidimensional constructs when testing the relationships between attitudes, on the one hand, and measures of behavioural intentions or subsequent behaviour, on the other hand (for reviews, see McEachan, Conner, Taylor, & Lawton, 2011; Wallace, Paulson, Lord, & Bond, 2005). Even in studies of attitudinal ambivalence (for a review, see Conner & Sparks, 2002), a primary focus has been to demonstrate that evaluative conflict between the separate positive and negative attitude dimensions (i.e., attitude ambivalence) moderates the relationship between overall (i.e., unidimensional) measures of attitudes, on the one hand, and measures of behavioural intentions or subsequent behaviour, on the other hand, with greater evaluative conflict
leading to poorer attitude–behaviour relationships (see Conner & Sparks, 2002). The
rationale is that the evaluative conflict, which stems from simultaneously evaluating a behaviour as both positive and negative, is indicative of weak attitudes, which are poor
Notwithstanding the importance of research on attitudinal ambivalence, a serious acceptance of the bidimensional conceptualization of attitudes requires that the positive and negative dimensions are treated as independent predictors of behaviour. While it is conceptually redundant to treat attitude ambivalence as a moderator of these relation-ships (i.e., it is circular to reason that a measure based on two independent constructs
should moderate the effects of those same constructs on an outcome),1 treating the
separate positive and negative attitude dimensions as independent predictors of behaviour is important nonetheless. It allows researchers to test potential differences between their predictive validities, which has important implications for better understanding behaviour (i.e., which attitude dimension is the better predictor of behaviour?) and the development of effective interventions (i.e., which attitude dimension might need prioritizing in behaviour-change efforts?).
Recent research in which attitudes have been treated as bidimensional predictors of
behaviour (Elliott, Brewster, et al., 2015; McCartan & Elliott, 2018) has shown that
both the positive and negative attitude dimensions independently predict
binge-drinking intentions (Elliott, Brewster, et al., 2015 [studies 1 and 2]), smoking and
unhealthy dieting intentions (Elliott, Brewster, et al., 2015 [study 2]), self-reported
speeding behaviour (Elliott, Brewster,et al., 2015 [study 3]), and objectivity measured
speeding behaviour (McCartan & Elliott, 2018). These studies have also shown that the positive dimension of attitude is a significantly stronger predictor of both intentions and subsequent behaviour than is the negative dimension. This finding is in line with the majority of previous studies on expectancy beliefs (precursors to attitudes) in which beliefs about the likelihood of positive behavioural outcomes have been found to predict behaviour to a greater extent than beliefs about the likelihood of negative behavioural outcomes. For example, Lee, Greely, and Oei (1999) found that positive expectancy beliefs accounted for more variance in binge-drinking behaviour than did negative expectancy beliefs. Lawton, Conner, and Parker (2007 [study 2]) found that positive expectancy beliefs had larger standardized regression weights than did negative expectancy beliefs in the prediction of smoking behaviour (also see Anderson, Pollak, & Wetter, 2002). Similarly, Rhodes and Conner (2010) found that positive expectancy beliefs had larger standardized regression weights than did negative expectancy beliefs in the prediction of physical activity intentions, in particular for affective rather than cognitive and proximal rather than distal outcomes. Furthermore, Fromme, Katz, and Rivet (1997) found that positive expectancy beliefs had larger standardized regression weights than did negative expectancy beliefs in the prediction of a range of behaviours including drug-use, heavy-drinking, and engagement in illegal
activities such as drink driving. Although Lawton et al. (2007 [study 1]) found that
expectancy beliefs about negative affective outcomes had larger standardized regres-sion weights in the prediction of speeding behaviour than did expectancy beliefs about positive affective outcomes, the findings of previous research, overall, suggest a ‘positivity bias’ in behavioural decision-making (e.g., Boucher & Osgood, 1969). With regard to bidimensional attitudes, evaluations of positive behavioural outcomes
outweigh evaluations of negative behavioural outcomes in the prediction of behaviour
(but see Lawton et al., 2007 [study 1]).
A potential limitation of the above cited studies, however, is that they have all focused exclusively on explicit attitudes. Explicit attitudes are attitudes of which an individual is consciously aware. Consequently, they are held to influence behaviour through a deliberative process, with individuals consciously considering the positive and negative outcomes of a behaviour before engaging in it (e.g., Elliott, Lee, Robertson, & Innes, 2015; Fazio & Olson, 2003; Fazio, 1990; Spalding & Hardin, 1999). This raises two potential concerns. First, many real-world behaviours (e.g., speeding) are readily repeatable and are therefore afforded the opportunity to become automatic. This means that spontaneous processes are likely to be involved in the execution of behaviour in addition to more deliberative processes (e.g., Verplanken & Orbell, 2003). Second, explicit attitudes are typically measured using self-report questionnaires, which can be susceptible to various cognitive biases, such as primary and recency effects (Murdock, 1962), affective biases such as mood congruent memory effects (e.g., Mayer, McCormick, & Strong, 1995), and self-presentation biases such as self-deception (Gur & Sackeim, 1979) and impression management (Paulhus & Reid, 1991). Implicitly measured attitudes help to overcome these potential problems. This is because implicit attitudes are attitudes of which
individuals arenotconsciously aware. Consequently, they are held to influence behaviour
through a spontaneous, rather than a deliberative, process. More specifically, they are held to be activated spontaneously when individuals encounter salient cues that are associated with a behaviour. These automatically activated attitudes are then held to exert a biasing effect on an individual, effectively priming (initiating rapidly and without conscious awareness) attitude-congruent behaviour (e.g., Fazio, 1990; Fazio & Olson, 2003). In addition, implicit attitudes are not vulnerable to self-reporting biases because they are measured by performance on cognitive tests, rather than self-report questionnaires (e.g., Banse, Seise, & Zerbes, 2001).
The most commonly employed method for measuring implicit attitudes is the Implicit Association Test (IAT; Greenwald, McGhee, & Schwartz, 1998; Greenwald, Nosek, & Banaji, 2003; but see Fazio, 2001 for an alternative method). The IAT is a computer-based reaction time task that assesses the strength of associations between ‘target concepts’ (e.g., behaviours) and ‘attributes’ (e.g., evaluations). In a standard, traditional IAT, a target concept (e.g., speeding) is presented on one side of a computer screen and its opposite concept (e.g., complying) is presented on the other side. Each concept is paired with an attribute (e.g., speeding/good; complying/bad). The participants are presented with items in the middle of the screen relating to both the concepts (e.g., illegal or legal) and the attributes (e.g., happy or nasty). The participants’ task is to categorize each item into its relevant category as quickly and
accurately as possible (e.g., Greenwald et al., 1998). A measure of attitude (e.g.,
towards speeding) is then derived from the difference in the participants’ response latencies (i.e., time taken to categorize items) in ‘compatible trials’, when the target concept is paired with ‘good’ and its opposite concept is paired with ‘bad’, and their response latencies in the ‘incompatible trials’, when the target concept is paired with
‘bad’ and its opposite concept is paired with ‘good’ (Greenwald et al., 1998, 2003).
The rationale is that faster response latencies in compatible relative to incompatible trials indicate a positive attitude towards the target concept.
‘speeding’ is paired with ‘bad’ and ‘complying’ is paired with ‘good’ (i.e., the incompatible trials). This is because his or her pre-existing cognitive association between ‘speeding’ and ‘good’ (i.e., his or her positive attitude towards speeding) is facilitating task performance
in the compatible trials and inhibiting it in the incompatible trials (e.g., Greenwaldet al.,
1998). On the other hand, a driver with a negative attitude towards speeding would be able to more quickly categorize items in an IAT when ‘speeding’ is paired with ‘bad’ and ‘complying’ is paired with ‘good’ than when ‘speeding’ is paired with ‘good’ and ‘complying’ is paired with ‘bad’. This is because his or her pre-existing cognitive association between ‘speeding’ and ‘bad’ (i.e., his or her negative attitude towards speeding) is facilitating task performance in the incompatible trials and inhibiting it in the compatible trials.
Several studies have demonstrated that implicit attitudes can predict health-risk behaviours, such as smoking (Chassin, Presson, Sherman, Seo, & Macy, 2010), binge-drinking (Houben, Havermans, & Wiers, 2010), and speeding (Hatfield, Fernandes, Faunce, & Job, 2008). However, these studies have all focused on unidimensional rather than bidimensional measures of attitudes, using IATs such as the one described above. Given the findings from studies of explicit bidimensional attitudes, it seems plausible that implicit attitudes will also have separate positive and negative dimensions that independently predict behaviour. One aim of this research therefore was to measure implicit bidimensional attitudes and test the extent to which they predict subsequent behaviour. We focused on drivers’ speeding behaviour because it is a behaviour that typically results in both positive and negative outcomes and therefore tends to generate both positive and negative dimensions of attitudes (e.g., Elliott, Armitage, & Baughan, 2005). Additionally, speeding is a prominent cause of road traffic accidents and casualties (Department for Transport, 2016). Research that identifies potentially modifiable predictors of speeding (e.g., attitudes) is therefore important for understanding this behaviour and finding ways to reduce it.
An additional aim of this study was to explore the relative effects of implicit and explicit attitudes in the prediction of behaviour. Understanding the interplay between deliberative and automatic decision-making in the prediction of behaviour is particularly important for behaviours such as speeding because both types of processes are likely to influence action. For example, in certain situations (e.g., driving on a road with a speed camera), deliberative decision-making, reflected in explicit attitudes, is likely to dictate behaviour. However, in other situations (e.g., driving on a well-rehearsed journey in which nothing out of the ordinary occurs and does not therefore require high levels of conscious deliberation), automatic decision-making, reflected in implicit attitudes, is likely to dictate behaviour.
Several studies have examined the effects of both implicit and explicit attitudes on behaviour (e.g., Gawronski, Galdi, & Arcuri, 2015; Greenwald, Poehlman, Uhlmann, &
Banaji, 2009; Spence & Townsend, 2010). A meta-analysis ofk = 152 independent studies
by Greenwaldet al.(2009) found that implicit attitudes accounted for an increment to
explained variance in behaviour over and above the variance accounted for by explicit attitudes, and both types of attitude accounted for unique variance in behaviour. However, no previous studies have simultaneously tested the predictive validity of implicit and explicit attitudes on speeding and no studies have tested the effects of both
implicit and explicitbidimensionalattitudes on any behaviour. It was expected in this
In line with the above discussion, the aim of this research was to test the effects of implicit bidimensional attitudes on behaviour over and above the effects of explicit
bidimensional attitudes. In line with previous research (e.g., Elliott, Brewster,et al., 2015;
McCartan & Elliott, 2018), hypothesis 1 was that the positive and negative dimensions of explicit attitudes would account for a significant proportion of the variance in behaviour, with the positive dimension being the stronger predictor. Hypothesis 2 was that the positive and negative dimensions of implicit attitudes would account for a significant increment to explained variance in behaviour, with the positive dimension again being the stronger predictor.
Method
ParticipantsOne hundred and thirty-one active drivers (full UK driving licence holders who drove at least once a week) took part. The participants were recruited using advertisements placed on notice boards around the campus of a large university in the West of Scotland and online posts (e.g., advertisements on social networking sites and the virtual learning environment of the university). The mean age of the sample was
22.66 (SD= 8.50; range= 18–65), and 21.4% was male (N = 28). The mean weekly
mileage was 74.81 (SD= 75.90; range= 1–400), and the mean number of years that
the participants had held a full driving licence for was 4.09 (SD= 6.84; range= 0.16–
38).
Power analysis indicated that the power provided by the present sample (n= 131) to
detect a meaningful (small to moderate) sized relationship (r= .22 for correlation and
f2= .10 for regression with four independent variables) was power =0.82. Given the
power estimate was above 0.80 (see Cohen, 1992), it was concluded that the present study was sufficiently powered for testing the hypotheses.
Design and procedure
A prospective design was used. The participants were invited to participate after being informed the study was a general-purpose investigation into driver behaviour and attitudes. All of the participants were invited to the social cognition laboratory situated in the School of Psychological Sciences and Health. After providing their consent, the participants completed a questionnaire that contained standard items to measure basic demographic information (e.g., age, gender, weekly mileage, number of years licensed to drive) and explicit attitudes towards exceeding the speed limit (both the positive and negative dimensions, separately). The participants also completed IATs to measure their implicit attitudes towards exceeding the speed limit (again, both the positive and negative dimensions, separately). The questionnaire took approximately 5 min to complete and was developed and administered using Qualtrics. The IATs took approximately 15 min to complete and were developed and administered using E-Prime. Half of the participants received the questionnaire first and half received the IATs first to control for any potential order effects.
The explicit attitude measures
Explicit attitudes were measured using standard questionnaire items (i.e., commonly employed in the literature and shown to procedure reliable measures). The participants were asked to respond to the items that measured their attitudes towards exceeding the speed limit using 9-point scales. All attitude items were presented in a pseudo-random order, with the response scales reversed for half the items to reduce response set bias (e.g., Nederhof, 1985). These measures were presented amongst ‘filler items’ asking the participants about their general driving practices (e.g., how often they drive in urban areas) to help prevent consistency biases (e.g., Budd, 1987) from influencing the participants’ responses.
The split semantic differential technique (Kaplan, 1972) was used to measure the separate positive and negative dimensions of attitude. Four items were used to measure the positive dimension. The participants were asked to ‘Think only about the positive/ rewarding/beneficial/pleasant outcomes that you associate with speeding’ and to rate ‘How positive/rewarding/beneficial/pleasant are they?’ The participants’ ratings were provided on scales from ‘not at all positive/rewarding/beneficial/pleasant’ (scored 1) to ‘extremely positive/rewarding/beneficial/pleasant’ (scored 9). The mean of the four items was calculated and used as the final measure of the explicit positive attitude
dimension. The Cronbach’s alpha was a =.88 and therefore was judged to possess
internal reliability (i.e.,a > .70; Cronbach, 1951; Nunnaly, 1978). Higher scores indicated
that the positive outcomes of speeding were rated more positively.
Four items were also used to measure the negative dimension of attitude. The participants were asked to ‘Think only about the negative/unrewarding/harmful/ unpleasant outcomes that you associate with speeding’ and to rate ‘How negative/ unrewarding/harmful/unpleasant are they?’ The ratings were provided on a scale from ‘not at all negative/unrewarding/harmful/unpleasant’ (scored 1) to ‘extremely negative/ unrewarding/harmful/unpleasant’ (scored 9). The mean of the four items provided a
reliable final measure of the explicit negative attitude dimension (Cronbach’sa = .73).
Higher scores indicated that the negative outcomes of speeding were rated more negatively.
The implicit attitude measures
A standard IAT, as described in the Introduction, is appropriate for measuring implicit unidimensional attitudes (i.e., positive or negative associations). However, ‘single-attribute’ IATs (e.g., Penke, Eichstaedt, & Asendorpf, 2006) are required to measure the separate positive and negative dimensions of implicit bidimensional attitudes. Single-attribute IATs are typically used when an Single-attribute has no clear opposite category (e.g.,
sociosexuality: Penkeet al., 2006). However, single-attribute IATs have not previously
been used to measure bidimensional attitudes. Single-attribute IATs were therefore developed to measure implicit bidimensional attitudes in this research.
illegal, and disobey) and five items related to ‘complying’ (slow, cautious, adhere, legal, and comply). Each item was presented twice, meaning that there were 20 trials in total. The participants were asked to press the ‘E’ key on the computer keyboard when item belonged to the concept category on the left of the screen and to press the ‘I’ key when the item belonged to the category on the right. The items remained on the screen until a response was given and, if an incorrect response was given (e.g., if a speeding-related item was categorized as ‘complying’), an X appeared in the centre of the screen until the correct response was provided.
In block 2, the participants were presented with the same display as in block 1, except that the single-attribute category ‘good’ was paired with the concept category at the top left of the screen. The participants were then presented with the same series of ‘speeding’/’complying’ items used in block 1. They were also presented with five items related to the attribute category ‘good’ (happy, fun, wonderful, positive, and enjoyable). Each of the items from the concept and attribute categories (‘speeding’, ‘complying’, and ‘good’) was presented at least once. Five of the items were shown twice. Of these items, three items belonged to the concept category on the left side of the screen, one belonged to the concept category on the right, and one belonged to the attribute category. This meant that block 2 comprised 20 trials and the number of items that the participants needed to categorize on the left and right sides of the screen was proportional to the number of categories. As in block 1, the participants were asked to press ‘E’ on the keyboard when the item belonged a category on the left of the screen and ‘I’ when it belonged to the category on the right.
In block 3, the participants completed the same task as in block 2 except that they needed to classify twice as many items (i.e., there were 40 trials in block 3). In blocks 4 and 5, the participants were given the same tasks as in blocks 2 and 3 except that the attribute category ‘good’ was paired with the concept category on the right rather than the left of the screen.
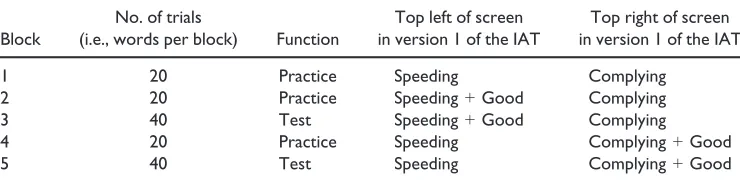
There were two different versions of this single-target IAT. In version 1, the target-concept category ‘speeding’ was presented on the left-hand side of the screen and the opposite-concept category ‘complying’ was on the right. In version 2, this was reversed. Half of the participants were selected at random to receive version 1, and half were selected at random to receive version 2 to counterbalance across the sample. This procedure was used to address the commonly found order effect in IAT research, with performance on the compatible or incompatible trials being faster when it is completed first (i.e., blocks 2 and 3) compared with when it is completed second (i.e., blocks 4 and 5;
[image:8.485.44.414.82.172.2]e.g., Greenwaldet al., 2003). In both IATs, the intertrial interval (milliseconds between
Table 1. Sequence of trial blocks for single-attribute Implicit Association Test (IAT) measuring the positive dimension of attitude
Block
No. of trials
(i.e., words per block) Function
Top left of screen in version 1 of the IAT
Top right of screen in version 1 of the IAT
1 20 Practice Speeding Complying
2 20 Practice Speeding+Good Complying
3 40 Test Speeding+Good Complying
4 20 Practice Speeding Complying+Good
each trial) used was 250 ms, consistent with standard practice (e.g., Greenwaldet al., 2003).
Regardless of which version of the IAT the participants received, the response latencies to the blocks in which the attribute category was paired with the ‘speeding’ target-concept category (commonly referred to as ‘compatible trials’) and the blocks in which it was paired with the ‘complying’ opposite-concept category (commonly referred
to as ‘incompatible trials’) were used to derive a ‘D-score’ (see Greenwaldet al., 2003).
ThisD-score served as the implicit measure of the positive attitude dimension. Following
Greenwaldet al.(2003), the mean response latencies (the time in milliseconds it took for
participants to correctly classify each item) for the compatible trials were subtracted from the mean response latencies for the incompatible trials, meaning that higher scores equated to faster categorization of items when ‘good’ was paired with ‘speeding’ rather than ‘complying’ (i.e., higher scores equated to more positive attitudes towards speeding). The difference between the participants’ mean latencies of response in the compatible versus incompatible trials was divided by the standard deviation across the
compatible and incompatible trials to produce an overall measure of effect size (i.e.,D). In
line with standard practice (i.e., Greenwaldet al., 2003), this procedure was used to
calculate aD-score for blocks 2 versus 4 and 3 versus 5 separately and the mean of the two
scores served as the final measure (D) of the positive dimension of the participants’
implicit attitudes towards speeding.2The Cronbach’s alphas for versions 1 and 2 of this
IAT werea = .72 anda = .66, respectively. This meant that the Cronbach’s alpha for the
overall measure of the positive dimension of implicit attitudes wasa =.69.
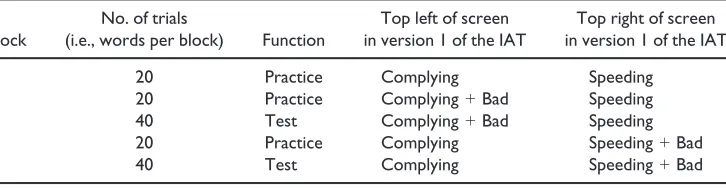
The negative dimension of implicit attitudes was also measured using a single-attribute IAT (see Table 2). This IAT was the same as the one used to measure the positive dimension of implicit attitudes except that the attribute category ‘bad’, rather than ‘good’, was paired with the target-concept category ‘speeding’ and the opposite-concept
category ‘complying’ in blocks 2–5. In addition to correctly categorizing the items relating
to speeding and complying, the participants therefore had to correctly categorize items relating to the attribute category ‘bad’ (evil, disaster, awful, negative and nasty). Once again, there were two different versions of the IAT. In version 1, the opposite-concept category ‘complying’ was presented on the left-hand side of the screen and the
target-Table 2.Sequence of trial blocks for single-attribute Implicit Association Test (IAT) measuring the negative dimension of attitude
Block
No. of trials
(i.e., words per block) Function
Top left of screen in version 1 of the IAT
Top right of screen in version 1 of the IAT
1 20 Practice Complying Speeding
2 20 Practice Complying+Bad Speeding
3 40 Test Complying+Bad Speeding
4 20 Practice Complying Speeding+Bad
5 40 Test Complying Speeding+Bad
2
[image:9.485.78.441.471.565.2]concept category ‘speeding’ was presented on the right. In version 2, this was reversed. To counterbalance across the sample, the participants who received version 1 of the IAT to measure the positive dimension of attitude received version 1 of this IAT. Similarly, the participants who received version 2 of the IAT to measure the positive dimension of attitude received version 2 of this IAT. To control for any potential practice effects, the order in which the participants received their two IATs varied. The participants either received the positive single-attribute IAT first or the negative single-attribute IAT first.
A final measure of the negative dimension of the participants’ implicit attitudes towards speeding was calculated following the same procedure as for the positive dimension of their implicit attitudes. The mean of the response latencies in the incompatible trials (‘bad’ paired with ‘complying’) was subtracted from the mean of the response latencies in the compatible trials (‘bad’ paired with ‘speeding’), meaning that higher scores reflected more negative attitudes towards speeding. This difference was then divided by the standard deviation across the compatible and incompatible trials for
the ‘practice’ and ‘test’ blocks separately and the mean of the resultingDs served as the
final measure (D) of the negative dimension of the participants’ implicit attitudes. The
Cronbach’s alphas for versions 1 and 2 of this IAT werea = .61 anda= .68, respectively.
This meant that the Cronbach’s alpha for the overall measure of the negative dimension of
implicit attitudes wasa =.64).
It should be noted that the data from all IATs were trimmed following standard
procedures (Greenwaldet al., 2003). All response latencies that were over 10,000 ms
were removed to ensure that the data were not contaminated by trials that were
‘abnormally slow’. Across all IATs, there were just n= 5 participants with response
latencies over 10,000 ms. In each case, the maximum number of abnormally slow trials
was justn = 2. These participants’ finalDscores were calculated using the remaining
latencies. Greenwaldet al.(2003) also recommend that participants should be removed
from the sample if more than 10% of their response latencies are <300 ms to prevent
contamination by ‘abnormally fast’ trials. In this study, there were no participants with more than 10% of their trials<300 ms.
The speeding behaviour measure
The driving simulator used in this study was an interactive fixed-based driving simulator modelled on the layout of a British car (i.e., right-hand drive). The simulator had three high-resolution screens to the front, providing 210 degree visual field of view. The simulator operated with an automatic transmission and had controls (e.g., a steering wheel, indicators, clutch, brake, and accelerator) that are situated and operate as in a real-world vehicle. The rear-view mirror was shown at the top of the centre screen, and a speedometer and tachometer were shown at the bottom. The wing mirrors were shown on the side screens.
behaviour used in the data analysis was the percentage of the trial route that the participants spent driving over the 30 mph speed limit. This was operationalized as 30.50 mph or to prevent microfluctuations in speed around 30 mph from unduly influencing the results.
Previous research (McCartan & Elliott, 2018) has shown that measures of speeding behaviour obtained in the present driving simulator correlate well with self-reported
measures of speeding in the real world (r = .65, p < .001). The demographic and
sociocognitive variables that are typically associated with real-world speeding behaviour and traffic-crash rates are also associated with speeding behaviour as measured on this driving simulator. More specifically, accumulated research in road safety has shown that age and driving experience are the key demographic predictors of both real-world speeding and traffic-crash risk, with younger and less experienced drivers being found to speed more often and have higher traffic-crash rates than older and more experienced drivers (e.g., Department for Transport, 2016; McCartt, Mayhew, Braitman, Ferguson, &
Simpson, 2009; Stradlinget al., 2003). Re-analyses of data from an independent study by
Brewster, Elliott, McCartan, McGregor, and Kelly (2016) showed that both these
demographic variables were reliable predictors of both mean speed (for age:b = .27,
p< .001; for driving experience: b = .25, p< .01) and the proportion of time that
participants spend driving over the speed limit (for age:b = .26,p < .01; for driving
experience:b = .23,p< .01) on this driving simulator. Conneret al.(2007 [study 2])
showed that the sociocognitive variables that predict on-road vehicle speeds in the real
world were behavioural intention (b = .35, p< .01), perceived behavioural control
(b = .03,p < .05), and moral norm (b = .21,p < .05). Re-analysis of the data collected
by Brewster et al. (2016) showed that behavioural intention (b = .35, p < .01),
perceived behavioural control (b = .14,p < .05), and moral norm (b= .16,p < .05)
also predicted vehicle speed in this driving simulator.
Results
Descriptive statistics and correlations
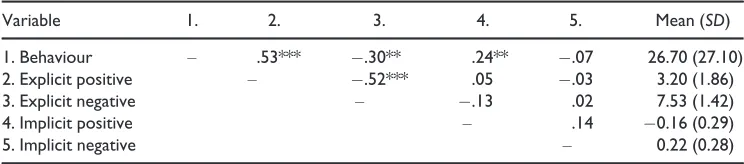
[image:11.485.70.442.536.618.2]The sample means, standard deviations, and correlations for the explicit and implicit attitude measures and the measure of speeding behaviour are shown in Table 3. The sample mean for the explicit positive attitude dimension was below the scale midpoint (i.e., 5), which indicates that the participants did not, on average, explicitly evaluate the positive outcomes of exceeding the speed limit very positively. The sample mean for the explicit negative attitude dimension was towards the top end of the scale, indicating that the participants, on average, explicitly evaluated the negative outcomes of exceeding the
Table 3.Descriptive statistics and correlations for all attitude measures and speeding behaviour
Variable 1. 2. 3. 4. 5. Mean (SD)
1. Behaviour – .53*** .30** .24** .07 26.70 (27.10)
2. Explicit positive – .52*** .05 .03 3.20 (1.86)
3. Explicit negative – .13 .02 7.53 (1.42)
4. Implicit positive – .14 0.16 (0.29)
5. Implicit negative – 0.22 (0.28)
speed limit as very negative. The sample mean for the implicit positive attitude dimension was below zero, indicating that the participants, on average, did not have strong positive implicit attitudes towards speeding. The sample mean for the implicit negative attitude dimension, on the other hand, was greater than zero, indicating that the participants, on average, had negative implicit attitudes towards speeding. The mean on the measure of behaviour was 26.70, indicating that the participants, on average, exceeded the speed limit for just over a quarter of the simulator drive.
The correlations in Table 3 show that the positive and negative dimensions of explicit attitudes were negatively correlated, meaning that the more the participants evaluated the positive outcomes of exceeding the speed limit as being positive, the less they evaluated the negative outcomes as being negative. However, the correlation
was below r= .70, which is the conventionally accepted criterion for demonstrating
independence amongst constructs (Tabachnick & Fidell, 1996). Similarly, the positive and negative dimensions of implicit attitudes were independent because they were not correlated significantly.
In line with expectations, the positive dimension of explicit attitudes was positively correlated with behaviour (i.e., the more participants evaluated the positive outcomes of exceeding the speed limit as positive, the more they exceeded the speed limit) whereas the negative dimension of explicit attitude was negatively correlated with behaviour. Similarly, the positive dimension of implicit attitudes was positively correlated with behaviour. However, the negative dimension of implicit attitudes was not.
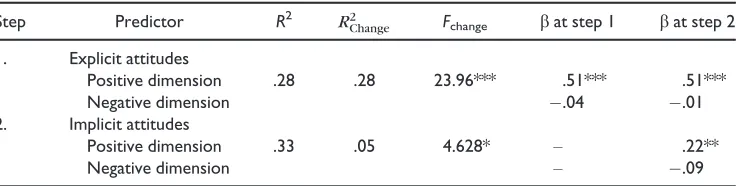
Predicting behaviour using explicit and implicit measures of bidimensional attitudes A two-step hierarchical multiple linear regression was conducted to test both hypotheses 1 and 2 (see Table 4). The dependent variable was the measure of speeding behaviour. The independent variables at step 1 were the explicit positive and negative dimensions of attitude. The implicit positive and negative dimensions of attitude were added to the regression at step 2.
[image:12.485.47.415.526.619.2]In support of hypothesis 1, Table 4 shows that 28% of the variance in speeding behaviour was account for at step 1 of the regression model. The positive dimension of explicit attitudes was an independent predictor. The negative dimension of explicit attitudes was not. Also in support of hypothesis 1, the positive dimension of explicit
Table 4. Hierarchical multiple linear regression predicting speeding behaviour from the explicit and implicit positive and negative dimensions of attitude
Step Predictor R2
R2
Change Fchange bat step 1 bat step 2
1. Explicit attitudes
Positive dimension .28 .28 23.96*** .51*** .51***
Negative dimension .04 .01
2. Implicit attitudes
Positive dimension .33 .05 4.628* – .22**
Negative dimension – .09
attitude had a significantly larger standardized regression coefficient than did the negative
dimension,t(125) =5.36,p< .001.
In support of hypothesis 2, Table 4 also shows that there was a 5% increase to
explained variance in speeding behaviour at step 2 of the regression model.3 The
positive dimension of implicit attitude was an independent predictor. The negative dimension of implicit attitude was not. Also in support of hypothesis 2, the positive dimension of implicit attitude had a significantly larger standardized regression
coefficient than did the negative dimension, t(123) = 2.71, p < .01. The positive
dimension of explicit attitudes remained an independent predictor of behaviour at step 2, and the negative dimension of explicit attitudes still did not predict behaviour. Also at step 2, the positive dimension of explicit attitude still had a significantly larger standardized regression coefficient than did the negative dimension of explicit attitude,t(123) = 5.13, p< .001.4
Discussion
The aim of this research was to test the effects of implicit bidimensional attitudes on drivers’ speeding behaviour over and above the effects of explicit bidimensional attitudes. Hypothesis 1 was that the positive and negative dimensions of explicit attitudes would account for a significant proportion of the variance in behaviour, with the positive dimension being the stronger predictor. Hypothesis 2 was that the positive and negative dimensions of implicit attitudes would account for a significant increment to explained variance in behaviour, with the positive dimension being the stronger predictor.
3Research on unidimensional attitudes shows that affective attitudes are typically stronger predictors of behaviour than are cognitive (instrumental) attitudes (e.g., Lawtonet al., 2009) and that implicitly measured attitudes add little to the prediction of behaviour over and above explicitly measured affective attitudes (e.g., Conner, Prestwich, & Ayres, 2011). This raises the possibility that the additional variance accounted for at step 2 of the regression model was due to the implicit measures containing more affective than cognitive attribute items (i.e., each IAT required the participants to categorize four emotive attributes [e.g., ‘happy’, ‘fun’, ‘wonderful’, and ‘enjoyable’] and just one instrumental attribute [e.g., ‘positive’]) and the explicit measures containing more cognitive than affective attitude items (i.e., the questionnaires required the participants to rate three instrumental items [e.g., ‘positive’, ‘rewarding’ and ‘beneficial’] and just one affective item [e.g., ‘pleasant’]). To rule out this possible explanation for the results, the regression analysis presented in the main text was re-run with explicit and implicit attitude measures that were computed using just the cognitive attitude items and, again, using just affective attitude items. In both cases, the pattern of results was the same as reported in Table 4.
4
Bidimensional effects of explicit and implicit attitudes on behaviour
In support of hypothesis 1, the positive and negative dimensions of explicit attitudes together accounted for a significant proportion of the variance in speeding behaviour. The positive dimension was also found to predict speeding behaviour to a significantly greater extent than the negative dimension. The results from this study therefore extend the findings from studies of unidimensional attitudes (e.g., Armitage & Conner, 2001; Eagly & Chaiken, 1993) in which attitudes are conceptualized as either positive or negative evaluations. They also support the positivity bias that is typically found in previous studies of bidimensional attitudes with the positive attitude dimension being more predictive of
behaviour than the negative dimension (Elliott, Brewster,et al., 2015; McCartan & Elliott,
2018).
It is worth considering, however, that the findings are not consistent with Lawton et al.’s (2007 [study 1]) research on expectancy beliefs about speeding in which beliefs about the likelihood of negative affective outcomes had larger standardized regression weights in the prediction of speeding behaviour than did beliefs about the likelihood of positive affective outcomes. The reason for the discrepancy is unlikely to be a result of
Lawtonet al.(2007) focusing on affective beliefs and the present research focusing on
attitudes more generally (i.e., overall measures of cognitive plus affective attitudes). This is because supplementary analyses showed that the positive dimension of attitude still predicted behaviour to a greater extent than the negative dimension when cognitive and
affective attitudes were separated (see footnote3). One possible reason for the discrepant
finding is that the mean age of the drivers in this sample was 23 years, and in Lawtonet al.
(2007 [study 1]), it was 49 years. It is possible that the older sample used in Lawtonet al.
(2007 [study 1]) had accumulated more experience of the negative consequences of speeding, thus reinforcing their beliefs about the negative outcomes of this behaviour, which in turn would be expected to increase the relationship with behaviour (cf. Fazio &
Zanna, 1981). However, in Elliott, Brewster,et al.(2015 [study 3]), the mean age of the
sample was 56 years. That study also focused on recent speed limit offenders, all of whom had received a recent negative outcome for their behaviour (being caught by the police in the last 4 months). It was still found that the positive dimension of attitude was more predictive of subsequent speeding than was the negative dimension, in line with the
findings of this study and most other studies of outcome beliefs (e.g., Andersonet al.,
2002; Fromme et al., 1997; Lawtonet al., 2007 [study 2]; Leeet al., 1999; Rhodes &
Conner, 2010). Although future research might usefully identify the conditions under which the positive dimension of attitude is more predictive of behaviour than the negative dimension (and vice versa), the present findings are consistent with the idea that the positive dimension of attitude is, in general, the primary dictator of behaviour, with individuals’ evaluations of positive behavioural outcomes outweighing their evaluations
of negative behavioural outcomes when deciding to act (but see Lawton et al., 2007
[study 1]).
It is also worth noting that the negative dimension of explicit attitude was not a significant predictor of behaviour in this study. While it has been shown to predict behaviour in previous research, along with the positive dimension, the effect size has been
small. For example, Elliott, Brewster,et al.(2015 [study 3]) showed that the beta-weight
for the negative dimension of explicit attitude in the prediction of speeding behaviour on
both urban and rural roads was justb = .11 (compared withb = .31 andb = .38 for the
In support of hypothesis 2, this study demonstrated that the positive and negative dimensions of implicit attitudes together accounted for a significant increment to explained variance in speeding behaviour over and above the variance that was accounted for by the positive and negative dimensions of explicit attitudes. This finding is therefore in line with research on unidimensional attitudes in which implicit measures of attitudes have been found to add variance to behaviour over and above explicit attitudes (e.g.,
Greenwald et al., 2009). The findings imply that spontaneous processes, tapped by
implicit attitudes, are important in dictating behaviour along with more deliberative, controlled processes, tapped by explicit attitudes (see Fazio, 1990). Additionally, it is worth noting that the explicit and implicit attitude measures of bidimensional attitudes were uncorrelated in this study, indicating that the measures tapped conceptually different types of attitudes that independently predicted behaviour, consistent with research on unidimensional attitudes (see Perugini, 2005; Wilson, Lindsey, & Schooler, 2000).
Also in support of hypothesis 2, the positive dimension of implicit attitude was a significantly stronger independent predictor of speeding behaviour than was the negative dimension. The results therefore demonstrate, for the first time, that the positivity bias
found with explicit bidimensional attitude–behaviour relationships generalize to implicit
bidimensional attitude–behaviour relationships. The implication is that behaviour is
dictated by evaluations of positive behavioural outcomes at the expense of the negative behavioural outcomes at both the explicit level of cognitive functioning (i.e., when an individual has the motivation and opportunity to think about what action to take) and the implicit level (i.e., when behaviour is more reactive or automatic).
The positivity bias that was found with regard to implicit bidimensional attitudes is particularly important because bidimensional attitudes have been measured in previous research using self-reported questionnaires, which can be criticized for being susceptible
to cognitive (e.g., Murdock, 1962), affective (e.g., Mayer et al., 1995), and
self-presentation biases (e.g., Gur & Sackeim, 1979; Paulhus & Reid, 1991). On the other hand, measures of implicit attitudes from IATs are less vulnerable to these criticisms (e.g.,
Banseet al., 2001). The positivity bias found in previous studies of explicit bidimensional
attitudes, with the positive dimension predicting speeding behaviour to a significantly
greater extent than the negative dimension (e.g., Elliott, Brewster,et al., 2015; McCartan
& Elliott, 2018), can therefore be held with greater confidence.
Implications for behaviour-change interventions
behaviours and the long history of such fear inducing messages having a rather limited effect on behaviour is consistent with the results of this study. More generally, research in road safety has shown that educational interventions that focus on drivers’ attitudes are generally ineffective at modifying driving behaviour and crash risk (Helman, Grayson, &
Parkes, 2010; Kinnear et al., 2013). Failure to target interventions appropriately is a
possible explanation for this finding.
The finding that implicit attitudes predicted behaviour over and above explicit attitudes also has important implications for behaviour-change interventions. Specifically, the findings imply that interventions are needed to focus on the automatic (implicit) cognitive processes that guide behaviour in addition to more rational (explicit) processes. ‘Evaluative conditioning’ tasks (e.g., Olsen & Fazio, 2001, 2006) are designed to alter implicit associations between behaviours (e.g., speeding) and evaluative attributes (e.g., ‘good’). Such tasks might be useful for changing implicit attitudes towards speeding. In line with the findings of this study, such tasks would need to target implicit associations between speeding and positive, rather than negative, evaluative responses. Alternatively, interventions might usefully prevent implicit attitudes from guiding behaviour in the first
place. For example, ‘thought stopping’ tasks (e.g., Foaet al., 2005) are known to prevent
unwanted cognitions. Such tasks might therefore be able to prevent the positive dimension of implicit attitudes from being activated automatically in response to salient cues associated with speeding and therefore prevent this risky behaviour from being primed. More generally, given that both explicit and implicit attitudes independently predicted speeding in this study, a multipronged intervention approach is recommended through which the positive dimensions of both explicit and implicit attitudes are targeted (e.g., Rydell & McConnell, 2006). Further research is needed to test the sorts of interventions discussed above.
Methodological considerations
While this study has important implications for both theory and practice, a number of methodological features need to be considered when interpreting the data. First, the sample comprised mainly university students, which resulted in a sample that was younger than the UK driving population (mean age: 22.66 years old vs. 48.8 years old for the UK driving population; DVLA, 2016). However, it is well established that young drivers are overrepresented in traffic crashes (Department for Transport, 2016). Identifying the constructs (e.g., attitudes) that contribute towards the risk-increasing behaviours of this group (e.g., speeding) is therefore important. It is also worth re-iterating that the pattern of findings was broadly consistent with previous studies on bidimensional
attitudes in which participants were non-university students (e.g., Elliott, Brewster,et al.,
2015 [study 3]).
experimental control, in which all participants are exposed to the same environmental conditions. Therefore, they eliminate confounding factors that are often found in the real world (e.g., experience of difficult traffic conditions across participants).
A third methodological feature of the present study that needs to be considered is that implicit attitudes were measured using single-attribute IATs, in which a single-attribute category (e.g., ‘good’ or ‘bad’) was paired with either ‘speeding’ or ‘complying’ and participants were asked to categorize target items relating to the three categories. The risk is that the IATs might have been measuring attitudes towards complying with the speed limit rather than attitudes towards exceeding the speed limit. This is potentially problematic because research has demonstrated that ‘doing’ cognitions (i.e., cognitions that relate to performance of a behaviour such as speeding) are separate from ‘not doing’ cognitions (i.e., cognitions that relate to not performing a behaviour such as avoiding speeding, or complying with the speed limit; e.g., Richetin, Conner, & Perugini, 2011). However, attitudes towards exceeding the speed limit and attitudes towards complying with the speed limit are usually found to be highly correlated and therefore typically have
the same predictive utility (see Conner et al., 2007; Elliott, 2012; Elliott, Armitage, &
Baughan, 2003; Letirand & Delhomme, 2005). Furthermore, the IATs developed for this study were shown to be psychometrically reliable and the finding that the positive dimensions of both explicit and implicit attitudes were stronger predictors of behaviour than were the negative dimensions provides evidence of construct validity. Future studies might usefully employ the single-attribute IATs developed in this study, along with
measures of explicit attitudes, to test bidimensional attitude–behaviour relationships with
regard to behaviours other than speeding.
A fourth methodological feature of this study is that the measures of explicit attitudes (both dimensions) were based primarily on items that tapped cognitive attitudes rather than affective attitudes whereas the measures of implicit attitudes (both dimensions) were based primarily on attribute items that tapped affective attitudes. This raises the possibility that the implicit attitude measures accounted for additional variance in behaviour over and above the variance accounted for by the explicit attitude measures because affective attitudes are generally stronger predictors. However, it was found that implicit attitudes still accounted for additional variance in speeding behaviour over and above the variance accounted for by explicit attitudes when we separated the cognitive and affective attitude
items (see footnote3). Although this research was not designed to address the distinction
between cognitive and affective attitudes, and future research might usefully do so (e.g., by developing separate IATs for cognitive and affective attitudes), the conclusion that implicit bidimensional attitudes increase the prediction of behaviour over and above explicit bidimensional attitudes seems to hold for both cognitive and affective attitudes. A fifth methodological feature of this study that is worthy of discussion is that the positive dimensions of both explicit and implicit attitudes were marginally more reliable than were the measures of the negative dimensions. This raises the possibility that differential regression attenuation (e.g., Goodwin & Leech, 2006) accounted for the greater prediction of behaviour by the positive attitude dimensions compared with the negative attitude dimensions. However, the positive dimensions of both explicit and implicit attitudes predicted behaviour to a greater extent than did the negative dimensions
even when controlling for the differences in measurement reliability (see footnote4).
attitude dimensions. However, the variances of the positive and negative dimensions of implicit attitudes were not statistically significant. While the variance in the positive dimension of explicit attitude was greater than was the variance in the negative dimension, the positive dimension was still a significantly stronger predictor of behaviour
even when correcting for the difference (see footnote4).
Conclusions
This research shows that the positive attitude dimension is a stronger predictor of behaviour than was the negative dimension and therefore supports the positivity bias
found in previous studies of the bidimensional attitude–behaviour relationship (e.g.,
Elliott, Brewster,et al., 2015; McCartan & Elliott, 2018). This result was found for explicit attitudes and, for the first time, implicit attitudes. Attitude-change interventions might usefully target the positive dimension of both explicit and implicit attitudes. Further research is needed to test the effectiveness of these interventions.
Funding
The research reported in this article was supported by funding from the Economic and Social Research Council (reference: ES/J500136/1) and the Big Lottery Fund (reference: IID/1/01047171871).
References
Allport, G. W. (1935). Attitudes. In C. Murchison (Ed.),Handbook of social psychology(pp. 798– 844). Worcester, MA: Clark University Press.
Anderson, C. B., Pollak, K. I., & Wetter, D. W. (2002). Relations between self-generated positive and negative expected smoking outcomes and smoking behavior: An exploratory study among adolescents.Psychology of Addictive Behaviors,16, 196–204. https://doi.org/10.1037/0893-164X.16.3.196
Armitage, C. J., & Conner, M. (2001). Efficacy of the theory of planned behaviour: A meta-analytic review. British Journal of Social Psychology, 40, 471–499. https://doi.org/10.1348/ 014466601164939
Banse, R., Seise, J., & Zerbes, N. (2001). Implicit attitudes towards homosexuality: Reliability, validity, and controllability of the IAT.Experimental Psychology,48, 145–160. https://doi.org/ 10.1026//0949-3946.48.2.145
Boucher, J., & Osgood, C. E. (1969). The pollyanna hypothesis.Journal of Verbal Learning and Verbal Behaviour,8(1), 1–8. https://doi.org/10.1016/S0022-5371(69)80002-2
Brewster, S. E., Elliott, M. A., McCartan, R., McGregor, B., & Kelly, S. W. (2016). Conditional or unconditional? The effects of implementation intentions on driver behavior. Journal of Experimental Psychology: Applied,22(1), 124–133. https://doi.org/10.1037/xap0000072 Budd, R. J. (1987). Response bias and the theory of reasoned action.Social Cognition,5(2), 95–107.
https://doi.org/10.1521/soco.1987.5.2.95
Carey, R. N., McDermott, D. T., & Sarma, K. M. (2013). The impact of threat appeals on fear arousal and driver behaviour: A meta-analysis of experimental research 1990–2011.PLoS One,8(5), e62821. https://doi.org/10.1371/journal.pone.0062821
Cohen, J. (1992). A power primer.Psychological Bulletin,112(1), 155–159. https://doi.org/10. 1037/0033-2909.112.1.155
Conner, M., Lawton, R., Parker, D., Chorlton, K., Manstead, A. S., & Stradlling, S. (2007). Application of the theory of planned behaviour to the prediction of objectively assessed breaking of posted speed limits. British Journal of Psychology, 98, 429–453. https://doi.org/10.1348/ 000712606X133597
Conner, M., & Norman, P. (2005).Predicting health behaviour: Research and practice with social cognition models. Maidenhead, UK: Open University Press.
Conner, M., Prestwich, A., & Ayres, K. (2011). Using explicit affective attitudes to tap impulsive influences on health behavior: A commentary on Hofmann et al. (2008).Health Psychology Review,5, 145–149. https://doi.org/10.1080/17437199.2010.539969
Conner, M., & Sparks, P. (2002). Ambivalence and attitudes.European Review of Social Psychology, 12(1), 37–70. https://doi.org/10.1080/14792772143000012
Conner, M., Sparks, P., Povey, R., James, R., Shepherd, R., & Armitage, C. J. (2002). Moderator effects of attitudinal ambivalence on attitude–behaviour relationships.European Journal of Social Psychology,32, 705–718. https://doi.org/10.1002/ejsp.117
Cronbach, L. J. (1951). Coefficient alpha and the internal structure of tests.Psychometrika,16, 297– 334. https://doi.org/10.1007/BF02310555
Department for Transport. (2016).Statistical data set: Reported road accidents (RAS10). Retrieved from https://www.gov.uk/government/statistical-data-sets/ras10-reported-road-accidents#tab le-ras10001
DVLA. (2016).DVLA driver licence data: Provisional and Full driving licences held, by age and by gender, Great Britain: as at March 2016. Retrieved from http://data.dft.gov.uk/driving-licence-data/Driving-licence-data-March2016.xls
Eagly, A. H., & Chaiken, S. (1993).The psychology of attitudes. Fort Worth, TX: Harcourt Brace Jovanovich.
Elliott, M. A. (2012). Testing the capacity within an extended theory of planned behaviour to reduce the commission of driving violations.Transportmetrica,8, 321–343. https://doi.org/10.1080/ 18128602.2010.502548
Elliott, M. A., Armitage, C. J., & Baughan, C. J. (2003). Drivers’ compliance with speed limits: An application of the theory of planned behavior.Journal of Applied Psychology,88, 964–972. https://doi.org/10.1037/0021-9010.88.5.964
Elliott, M. A., Armitage, C. J., & Baughan, C. J. (2005). Exploring the beliefs underpinning drivers’ intentions to comply with speed limits.Transportation Research Part F: Traffic Psychology and Behaviour,8, 459–479. https://doi.org/10.1016/j.trf.2005.08.002
Elliott, M. A., Brewster, S., Thomson, J., Malcolm, C., & Rasmussen, S. (2015). Testing the bi-dimensional effects of attitudes on behavioural intentions and subsequent behaviour.British Journal of Psychology,106, 656–674. https://doi.org/10.1111/bjop.12107
Elliott, M. A., Lee, E., Robertson, J., & Innes, R. (2015). Evidence that attitude accessibility increases the relationship between speeding attitudes and speeding behavior.Accident Analysis and Prevention,74, 49–59. https://doi.org/10.1016/j.aap.2014.10.007
Elliott, M. A., & Thomson, J. A. (2010). The social cognitive determinants of offending drivers’ speeding behaviour.Accident Analysis and Prevention,42, 1595–1605. https://doi.org/10. 1016/j.aap.2010.03.018
Elliott, M. A., Thomson, J. A., Robertson, K., Stephenson, C., & Wicks, J. (2013). Evidence that changes in social cognitions predict changes in self-reported driver behavior: Causal analyses of two-wave panel data.Accident Analysis and Prevention,50, 905–916. https://doi.org/10.1016/ j.aap.2012.07.017
Fazio, R. H. (1990). Multiple processes by which attitudes guide behaviour: The MODE model as an integrative framework.Advances in Experimental Social Psychology,23, 75–109. https://doi. org/10.1016/S0065-2601(08)60318-4
Fazio, R. H., & Olson, M. A. (2003). Implicit measures in social cognition research: Their meaning and use.Annual Review of Psychology,54(1), 297–327. https://doi.org/10.1146/annurev.psych. 54.101601.145225
Fazio, R. H., & Zanna, M. P. (1981). Direct experience and attitude–behaviour consistency. Advances in Experimental Social Psychology,14, 161–202. https://doi.org/10.1016/S0065-2601(08)60372-X
Fishbein, M. (1963). An investigation of the relationship between beliefs about an object and the attitude toward that object. Human Relations, 16, 233–240. https://doi.org/10.1177/ 001872676301600302
Foa, E. B., Hembree, E. A., Cahill, S. P., Rauch, S. A., Riggs, D. S., Feeny, N. C., & Yadin, E. (2005). Randomized trial of prolonged exposure for posttraumatic stress disorder with and without cognitive restructuring: Outcome at academic and community clinics.Journal of Consulting and Clinical Psychology,73, 953–964. https://doi.org/10.1037/0022-006X.73.5.953
Fromme, K., Katz, E. C., & Rivet, K. (1997). Outcome expectancies and risk-taking behavior. Cognitive Therapy and Research,21, 421–442. https://doi.org/10.1023/A:1021932326716 Gawronski, B., Galdi, S., & Arcuri, L. (2015). What can political psychology learn from implicit
measures? Empirical evidence and new directions.Political Psychology,36(1), 1–17. https:// doi.org/10.1111/pops.12094
Glasman, L. R., & Albarracın, D. (2006). Forming attitudes that predict future behavior: A meta-analysis of the attitude–behavior relation.Psychological Bulletin,132, 778–822. https://doi. org/10.1037/0033-2909.132.5.778
Glass, G. V., & Hopkins, K. D. (1996).Statistical methods in psychology and education(3rd ed.). Needham Heights, MA: Allyn & Bacon.
Goodwin, L. D., & Leech, N. L. (2006). Understanding correlation: Factors that affect the size ofr. Journal of Experimental Education,74, 251–266. https://doi.org/10.3200/JEXE.74.3.249-266 Greenwald, A. G., McGhee, D. E., & Schwartz, J. L. K. (1998). Measuring individual differences in implicit cognition: The Implicit Association Test.Journal of Personality and Social Psychology, 74, 1464–1480. https://doi.org/10.1037/0022-3514.74.6.1464
Greenwald, A. G., Nosek, B. A., & Banaji, M. R. (2003). Understanding and using the Implicit Association Test: I. An improved scoring algorithm. Journal of Personality and Social Psychology,85, 197–216. https://doi.org/10.1037/0022-3514.85.2.197
Greenwald, A. G., Poehlman, T. A., Uhlmann, E. L., & Banaji, M. R. (2009). Understanding and using the Implicit Association Test: III. Meta-analysis of predictive validity.Journal of Personality and Social Psychology,97(1), 17–41. https://doi.org/10.1037/a0015575
Gur, R. C., & Sackeim, H. A. (1979). Self-deception: A concept in search of a phenomenon.Journal of Personality and Social Psychology,37, 147–169. https://doi.org/10.1037/0022-3514.37.2.147 Hair, J., Anderson, R., Tatham, R., & Black, W. (1998).Multivariate data analysis(5th ed.). London,
UK: Prentice Hall International.
Hatfield, J., Fernandes, R., Faunce, G., & Job, R. F. (2008). An Implicit non- self-report measure of attitudes to speeding: Development and validation.Accident Analysis and Prevention,40, 616– 627. https://doi.org/10.1016/j.aap.2007.08.020
Helman, S., Grayson, G., & Parkes, A. M. (2010).How can we produce safer new drivers? A review of the effects of experience, training, and limiting exposure on the collision risk of new drivers. TRL Insight Report (INS005). Crowthorne, UK: Transport Research Laboratory.
Helman, S., & Reed, N. (2015). Validation of the driver behaviour questionnaire using behavioural data from an instrumented vehicle and high-fidelity driving simulator. Accident Analysis & Prevention,75, 245–251. https://doi.org/10.1016/j.aap.2014.12.008
Houben, K., Havermans, R. C., & Wiers, R. W. (2010). Learning to dislike alcohol: Conditioning negative implicit attitudes towards alcohol and its effect on drinking behaviour. Psychopharmacology (Berl),211(1), 79–86. https://doi.org/10.1007/s00213-010-1872-1 Kaplan, K. J. (1972). On the ambivalence-indifference problem in attitude theory and measurement:
Kinnear, N., Lloyd, L., Helman, S., Husband, P., Scoons, J., Jones, S.,. . .Broughton, J. (2013).Novice drivers: Evidence review and evaluation. TRL Published Project Report (PPR673). Crowthorne, UK: Transport Research Laboratory.
Kraus, S. J. (1995). Attitudes and the prediction of behavior: A meta-analysis of the empirical literature.Personality and Social Psychology Bulletin,21(1), 58–75. https://doi.org/10.1177/ 0146167295211007
Lawton, R., Conner, M., & McEachan, R. (2009). Desire or reason: Predicting health behaviors from affective and cognitive attitudes.Health Psychology,28(1), 56–65. https://doi.org/10.1037/ a0013424
Lawton, R., Conner, M., & Parker, D. (2007). Beyond cognition: Predicting health risk behaviors from instrumental and affective beliefs.Health Psychology,26, 259–267. https://doi.org/10. 1037/0278-6133.26.3.259
Lee, N. K., Greely, J., & Oei, T. P. S. (1999). The relationship of positive and negative alcohol expectancies to patterns of consumption of alcohol in social drinkers.Addictive Behaviors,24, 359–369. https://doi.org/10.1016/S0306-4603(98)00091-4
Letirand, F., & Delhomme, P. (2005). Speed behaviour as a choice between observing and exceeding the speed limit.Transportation Research Part F: Traffic Psychology and Behaviour,8, 481– 492. https://doi.org/10.1016/j.trf.2005.06.002
Mayer, J. D., McCormick, L. J., & Strong, S. E. (1995). Mood-congruent memory and natural mood: New evidence.Personality and Social Psychology Bulletin,21, 736–746. https://doi.org/10. 1177/0146167295217008
McCartan, R., & Elliott, M. A. (2018).Testing the effects of attitude accessibility on the relationship between bi-dimensional attitudes and behaviour. Manuscript submitted for publication. McCartt, A. T., Mayhew, D. R., Braitman, K. A., Ferguson, S. A., & Simpson, H. M. (2009). Effects of
age and experience on young driver crashes: Review of recent literature. Traffic Injury Prevention,10, 209–219. https://doi.org/10.1080/15389580802677807
McEachan, R. R. C., Conner, M., Taylor, N. J., & Lawton, R. J. (2011). Prospective prediction of health-related behaviours with the theory of planned behaviour: A metaanalysis. Health Psychology Review,5(2), 97–144. https://doi.org/10.1080/17437199.2010.521684
Muchinsky, P. M. (1996). The correction for attenuation. Educational & Psychological Measurement,56(1), 63–75. https://doi.org/10.1177/0013164496056001004
Murdock, B. B. (1962). The serial position effect of free recall.Journal of Experimental Psychology, 64, 482–488. https://doi.org/10.1037/h0045106
Nederhof, A. (1985). Methods of coping with social desirability bias: A review.European Journal of Social Psychology,15, 263–280. https://doi.org/10.1002/ejsp.2420150303
Nunnaly, J. (1978).Psychometric theory. New York, NY: McGraw-Hill.
Olsen, M. A., & Fazio, R. H. (2001). Implicit attitude formation through classical conditioning. Psychological Science,12, 413–417. https://doi.org/10.1111/1467-9280.00376
Olsen, M. A., & Fazio, R. H. (2006). Reducing automatically activated racial prejudice through implicit evaluative conditioning. Personality & Social Psychology Bulletin, 32, 421–433. https://doi.org/10.1177/0146167205284004
Osgood, C. E., Suci, G. J., & Tannenbaum, P. H. (1957).The measurement of meaning. Oxford, UK: University Illinois Press.
Parker, D., Stradling, S. G., & Manstead, A. S. R. (1996). Modifying beliefs and attitudes to exceeding the speed limit: An intervention study based on the theory of planned behavior.Journal of Applied Social Psychology,26(1), 1–19. https://doi.org/10.1111/j.1559-1816.1996.tb01835.x Paulhus, D. L., & Reid, D. B. (1991). Enhancement and denial in socially desirable responding.
Journal of Personality and Social Psychology, 60, 307–317. https://doi.org/10.1037/0022-3514.60.2.307