Ayman Attya
1*, Jose Luis Dominguez-Garcia
2, Olimpo Anaya-Lara
1 1: Department of Electronic and Electrical, University of Strathclyde, Glasgow, UK 2: Power Systems Group, Institut de Recerca en Energia de Catalunya (IREC), Barcelona, SpainCorresponding author:[email protected]
Estimation of Frequency Support Market Indices using
Monte Carlo Simulation for Wind Power Generation
Abstract— the foreseen high penetration levels of renewable
energy sources into modern power system will force these green power plants to provide full range of ancillary services. Consequently, the schemes and mechanisms of the markets of such services should be adapted to accommodate the intermittent and uncertain nature of renewable power generation. This paper develops a novel probabilistic method to evaluate the key indices of frequency support according to the present market practices. Focus will be brought to wind power generation, where three different concepts of frequency support are compared through the proposed estimation algorithm, which is based on Monte Carlo Simulation (MCS). This study also considers different ranges of wind speed. Results reflect the disability of current factors, which are used to calculate the incentives and rates of provided power and energy support, to deal with wind power. It also reveals the average deviations between the applied support methods from viewpoint of the estimated indices. Matlab/Simulink is the applied simulation environment, where supplementary controllers are integrated into the NREL 5MW benchmark to enable its provision for frequency support.
Index Terms—Ancillary services, Electricity markets, Frequency
support, Monte Carlo Simulation.
I. INTRODUCTION
The published energy roadmaps and plans reveal a huge drift towards renewable and uncertain energy sources (RES) where conventional power plants will be shutdown and replaced by RES [1, 2]. This will imply critical changes on the technical and economic aspects of the provision of ancillary services (AS) including market key indices and practices. Maintaining the system frequency deviations within a tight and pre-defined margin is a top priority of grid codes, and the AS market as well. These markets act as an economic interface between power plants and Transmission System Operators (TSOs) [3] to provide such services according to the technical regulations, namely the grid codes. Frequency support is one of the most critical AS, and it can be described as a certain power surge provided by power plants during frequency drops to tackle frequency deterioration and mitigate the unbalance between generation and demand, which is the main cause of frequency deviations. Literature has excessively developed and discussed methods which enable wind turbine generators (WTGs) to provide frequency support to power systems [4].
However, there are three major concepts, which are applied through different control methods to secure a power surge from WTGs during frequency excursions taking into account the intermittent nature of wind power, pitch de-loading [5, 6], over-speeding de-loading and kinetic energy extraction [7-9]. In spite of this large volume of research, the nexus between AS markets and the developed frequency support methods is still vague and rarely investigated [10]. This paper tries to cross the bridge between the technical aspects of the three support concepts and its impact on the key market indices, which are used by TSO to assess the financial income of frequency support. A certain set of these indices will be defined and estimated for each support method under different wind speed (WS) conditions to reflect the interplay between the applied support method and the incident WS. To acknowledge the uncertainty of many factors, including the timing, severity and pattern of frequency event, and WS intermittency as well, MCS is applied [11]. The next section illustrates the three implemented support methods, and provides a brief overview on the current market schemes. Section 3 explains the applied algorithm to evaluate the selected indices using MCS. Fourth section discusses the results, finally, Section five concludes.
II. FREQUENCY SUPPORT METHODS AND MARKET INDICES
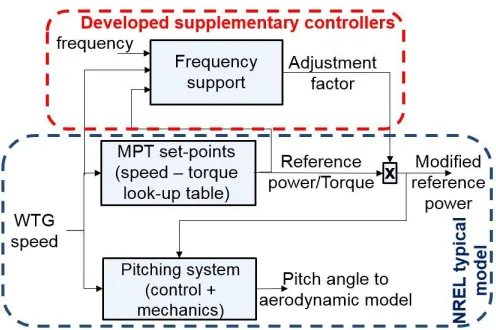
The cornerstone of frequency support methods is to secure a sustainable and adequate power surge, reflecting frequency dynamics regardless the pertaining WS conditions [4]. The NREL 5MW detailed Simulink model [12] is developed to integrate three supplementary controllers as depicted in Figure 1 to enable the provision of frequency support.
A. Support methods 1) Pitch de-loading
Figure 1 integration OF controllers into NREL model
Both techniques are widely applied using pitch de-loading, however this paper applies delta de-loading to maintain a certain de-loading ratio (DF), where the reference pitch angle and power signals are updated continuously to maintain the predefined DF. To achieve that, the reference active power is reduced by the required de-loading ratio, meanwhile the rotor speed is regulated around its nominal value according to the incident WS. In case of a frequency excursion (i.e. frequency violates a safe margin; flow), the de-loading ratio is curtailed regularly through a droop gain until the frequency drop reaches a predefined threshold (fm
d), where the WTG provides its available output. The active power reference (Po
ref) is reduced by the required de-loading ratio following (1),
F low
m o
F m o d low
d
m o d
D , f f
f -f
Deloading= D × -1 , f -f <f<f f
0, f f -f
(1)
where fLow is the lower deadband of frequency deviations, and the de-loading is fully waived at fm
d. This procedure smoothens the system frequency response and imitates the governor droop response provided by conventional synchronous generators.
2) Accelerative de-loading
This method has the privilege of being applicable to all variable speed WTGs, even when it is not desirable to apply special pitch control methods, or the WTG is not equipped with a pitching system. Nevertheless, it depends on the margin of rotor speed variation, according to the rating of the integrated power electronics interface. This method aims to reduce the reference torque by a certain ratio (KAcc) below its default value, hence the WTG will accelerate, as the demand is slightly less than available mechanical torque and the electrical output is de-loaded. This reduction factor has an upper limit to ensure that rotor speed limit is not violated [7]. As an illustration, incident WS is roughly measured to estimate the nominal rotor speed through a look-up table, thereupon KAcc is
set to ensure an acceptable rotor speed, where in this study 0.85 ≤ KAcc ≤ 1; at KAcc = 0.85 full de-loading is applied. The acceleration factor is waived gradually, when flow is violated, through a droop gain similar to that used in Pitch de-loading. Consequently, the support is provided by the extracted kinetic energy (KE), WTG decelerates converting KE into mechanical then electrical energy. Moreover, it approaches the optimum operation point when the torque reaches its non-de-loaded value, hence optimum output (i.e. MPT). Post event, the recovery to normal accelerated speed is executed within a predefined duration (TR; 30s in this paper).
3) Kinetic energy extraction
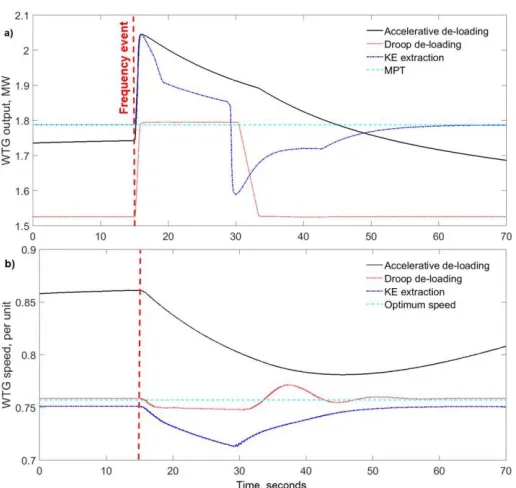
[image:2.612.352.544.554.597.2]This method is based on increasing the reference torque above its nominal value during the frequency event, where the concept of forcing the WTG to extract some of its stored KE to provide supportive power surge is applied. This method is thought to be favorable to WFs owners as it does not imply major energy losses during normal operation (i.e. the WTG is following MPT when there is no frequency event). However, it provides support for shorter time and it is highly vulnerable to WS conditions, during and after the event. The extraction factor (Kex) is governed by the frequency drop severity through similar linear droop applied in the two previous methods (1 ≤ Kex ≤ 1.15). It is of note that, the same ratio of 0.15 either for de-loading or over-loading is fixed among the three support methods to make the comparison on a common basis. The extraction process stops when the rotor speed reaches a certain low rotor speed threshold. Severe WS drops paralyze this method if the extractable KE is insufficient to maintain the supportive power surge, and it also puts the WTG under the risk of complete stop, hence, the extraction process continues as long as rotor speed is not violated, where the torque value at the event start is maintained, given that the ratio between the actual torque and its initial value does not exceed the maximum Kex. The post event stage is critical since the WTG accelerates to recover nominal speed, thus Kex is set to be less than one implying a reference torque less than the available such that the extra energy accelerates the WTG. Nevertheless, the rate of decay of the torque is regulated such that it does not exceed Kex/TR. The response of NREL to a moderate frequency drop of rate of change 0.5 Hz/s are displayed in Figure 2 to illustrate the operation under the three methods, where MPT refers to conventional operation. The implemented support controllers’ parameters are in Table 1.
TABLE I. FREQUENCY SUPPORT PARAMETERS
flow fmd Kacc Kex. DF TR
Figure 2. WTG 5MW-rated, wind speed = 8 m/s response to a frequency event under three support methods: a) Output power; b) Rotor speed
B. Market schemes
The TSOs decide three main parameters which shape up the expected power surge from the connected power plants, namely, frequency deadband, frequency nadir at which the full power surge should be provided, and how long the surge should sustain [14, 15]. According to several practices in European countries [16, 17], and UCTE/ENTSO-e recommendations [18], the frequency deadband is ±20 mHz, 49.8 Hz nadir and sustains for 8s. In addition, there is a restriction on the size of either the unit or the reserve (i.e. expected surge) that can participate in short term frequency support in some regions. The available KE is a key factor to determine/estimate the system inertia, hence the Irish TSOs proposed the SIRF index [3] is evaluated using (2), which is close to inertia constant (H) of a generator,
2
0.5×J×ω H×S
SIRF= =
Min. output Min. output (2)
where J, H, ω and S are moment of inertia, inertia constant, rotational speed and rated power respectively. The challenge of wind power is the intermittency of wind speed, which influences the WTG rotor speed and output, hence the stored KE and minimum output.
On the economic side, the generic compensation to participating power plants covers three components; capacity (X/MW); standby duration (Y/hour); and actual support energy provision (Z/MWh), where X, Y, and Z are the assigned prices according to the submitted bids. However, these parameters are neither reliable nor attractive to wind power plants’ owners as
shown through this study. The second challenge is the relatively long bidding window (e.g. 4 hours in Germany), which is dedicated to balancing power not short term frequency support [19]. In this paper, this generic scheme is considered with a shorter time-window of 50 minutes as explained in the next sections.
III. MCS ALGORITHMS
The MCS relies on parameters changing randomly within a carefully selected range in each sample. These parameters reflect the different uncertainties incorporated into the examined process. The integrated WS is a high resolution real data for 50 minutes and 1 reading/s. Two frequency drops occur within the sample duration of 50 minutes, and each event lasts for 30s. The pattern of the frequency event and the adjacent prices of supportive power and energy during the event is the first uncertainty, beside more uncertainties due to the provision of support by wind power, the incident WS. To consider these uncertainties, the following algorithm is applied:
Frequency pattern is decided based on a uniform random value between (-0.4 and -1 Hz/s) of the RoCoF of each event;
Instant of first event initiation (t1) is a uniform random value between 1 and 1500 s, while instant of first event initiation (t2) is random value between t1+300 to 2900 s. This ensures that the WTG has retained the normal operation before the second event and also allows enough time to react after the second event before the sample time ends;
To consider the WS class (i.e., low, medium and high), the base WS array is rescaled by a certain factor (RWS). As an illustration, the average WS of the original array is 8.5 m/s, but to consider a high WS, the average could be raised to a range of (9.51, 14) m/s, hence the RWS is randomly selected between (9.51, 12)/8.5;
The prices of supportive energy and power (CE and CP) for each simulation span (Ts, 3000s) are uniform random values between (25, 50) €/MWH and (1, 3) €/MW respectively inspired by the gathered data from many resources [10, 20], however, there is no market schemes for such AS from wind power.
The following indices are evaluated for each Ts inspired by the current practices in Balancing power markets:
Average power surges within 5s and 30s from event initiation respectively (ΔP5 and ΔP30). To evaluate ΔP, the average WTG output during 1 minute before the event is subtracted from its output arrays within 5s and 30s, thereupon the average of each array is obtained. Supportive energy during 30s (ΔE30) is the time integral
[image:3.612.37.295.53.297.2] The income of supportive energy and power are MΔP = ΔP30*CP, MΔE = ΔE30*CE respectively;
The ratio between the generated energy by the WTG after 30s from the event clearance (ti+30 until ti+60), and the energy generated if there was no event at the same time interval (i.e. same wind conditions), noted as
Recovery ratio. This reflects the amount of possible energy wasting to enable the WTG to recover to normal operation.
The flowchart in Figure 3 illustrates the implemented algorithm, where m, n and Ns are the no. of events per Ts, samples count, and the aimed no. of samples respectively. The signal of frequency event is fed to the supplementary controller according to the set values of t1, t2 and RoCoF1 and RoCoF2.
A separate algorithm is applied to evaluate the SIRF index when the WTG operates under each of the three support methods. The WS array is changed randomly by RWS based on the examined class (i.e. low, medium or high). The average stored KE within Ts is obtained using the rotor speed of the WTG and its moment of inertia, and the minimum output is the average of the lowest 10% of WTG output array during Ts. Afterwards, the SIRF is evaluated for each Ts. In this algorithm the WTG does not respond to any frequency events, where it is aimed to evaluate the SIRF index at normal operation. In both algorithms, a Matlab code runs a Simulink file that contains three separate models of the NREL-5MW, where each one is equipped with a supplementary controller that applies one of the investigated support methods, meanwhile a fourth model is the NREL-5MW original model to represent conventional output (i.e. MPT).
Figure 3. MCS algorithm to evaluate key market indices
IV. RESULTS AND DISCUSSION
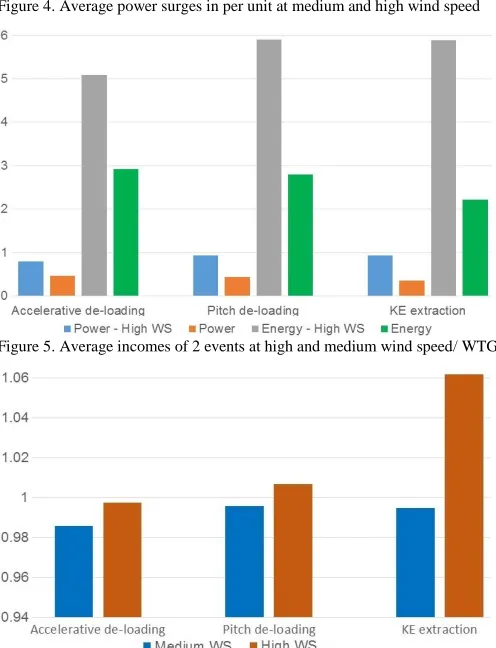
The examined WS classes are medium (7.1 up to 9.5 m/s) and high (9.51 up to 14 m/s), where RWS is randomly obtained according to the selected WS class as explained in Section 3. The results of the estimated power surges at the two WS classes are displayed in Figure 4, where the MCS algorithm is executed for Ns = 1500 samples, where the steady state error is below 0.5%. The results reflect the average divergence between support methods, however, the WS conditions have a critical impact. The 5s and 30s power surges are almost similar mainly in case of Pitch de-loading, meanwhile the 5s surge is higher in case of Accelerative d-loading at high WS. This returns to the key influence of accelerating the WTG at high WS. Likewise, KE extraction provides a slightly higher 5s surge before the extractable energy is depleted. This performance reflects clearly to the financial income as depicted in Figure 5, where the income during Ts is almost tripled at high WS. It should be highlighted the larger deficit between the medium and high WS in case of KE extraction method. This is ensured by the estimated Recovery ratio in where the KE extraction achieved much larger ratio at high WS, which reflects the considerable amount of wasted energy post frequency event. However, in the other two support methods, the Recovery ratio is not highly affected by WS conditions, which might be an indicator of a better economic cost-worth compared to KE extraction.
A comprehensive comparison between the proposed indices and conventional market schemes is found in Table 2. The uncertain nature of WS reflects on all the aspects of comparison. In addition, the applied support method and the incorporated parameters (e.g. de-loading and extraction factors) play a key role. The amount of extra i.e. support released energy relies on the event severity, which is common between conventional and wind power plants, however, the applied support method and the incident wind speed could make a major difference compared to the sustained generation of conventional plants. Some special requirements are hard to be achieved by intermittent wind power plants like the guaranteed provision of two successive events within 30s as requirement by Belgian grid operators. However, such challenging requirements could be incentivized in the case of wind energy. Moreover, penalizing the wind power plants that fails to supply the reserve bid cannot be evaluated based on a constant penalty factor (e.g. 1.5 x reserve price in Portugal) but it should rely on the actual WS conditions during the event.
operation, which is much higher than the corresponding SIRF of a conventional synchronous power plant that can operate economically efficient at minimum output of 70%.
Figure 4. Average power surges in per unit at medium and high wind speed
Figure 5. Average incomes of 2 events at high and medium wind speed/ WTG
Figure 6. Recovery ratio at high and medium wind speeds
Figure 7. MCS arrays of SIRF index at medium wind speed
Figure 8. SIRF index of the three support methods at medium wind speed TABLE II. COMPARISON BETWEEN TRADITIONAL SCHEMES AND
PROPOSED MCS ESTIMATION INDICES
Aspects Proposed indices Traditional practice Evaluation Probabilistic Deterministic
Model based Yes No
Primary reserve Dynamic Constant
Reserve value Ratio of pre-event generation
Reserve ratio of installed capacity 2 times successive
deployment capability Incentivized Mandatory
Deployment speed Support method &
WS based Constant
Penalty factor Dynamic (function
of WS) Constant
Other Relies on adopted support method
Relies on synchronous plant droop setting
V. CONCLUSIONS
[image:5.612.38.286.287.611.2]achieved income to judge the value of the applied methods. These algorithms could be used to forecast and set the bids of wind power plants to the future markets of frequency support under high penetration of renewables. However, its accuracy relies on the input wind speed data, and it should be executed within short time window. The short time window ensures the accuracy of wind speed forecast and mitigates allocated memory compared to running MCS for longer time intervals. In addition, wind data should be of high resolution i.e. sampling time is about 1-2s to capture the essential transients of WTGs/WFs to achieve a more accurate assessment of the actual and optimum generation.
ACKNOWLEDGEMENT
This work was funded by EU-Energy-2013 FP7 project IRPWIND, grant no. 609795.
REFERENCES
[1] European Commission. (2014). 2050 Energy strategy. Available: https://ec.europa.eu/energy/en/topics/energy-strategy/2050-energy-strategy
[2] European Network of Transmission System Operators for Electricity (ENTSO-e), "Research, innovation and development roadmap 2017-2026," European Network of Transmission System Operators for Electricity (ENTSO-e),2017.
[3] EirGrid. (2015). DS3:System Services Review. Available: http://www.eirgridgroup.com/site-files/library/EirGrid/System-Services-TSO-Recommendations-May2013.pdf
[4] A. B. Attya, J. L. Dominguez-Garcia, and O. Anaya-Lara, "A review on frequency support provision by wind power plants: current and future challenges," Elsevier Renewable & Sustainable Energy Reviews, Online, 2017 [dx.doi.org/10.1016/j.rser.2017.06.016].
[5] A. B. Attya and T. Hartkopf, "Wind turbine contribution in frequency drop mitigation - modified operation and estimating released supportive energy," IET Generation Transmission & Distribution, vol. 8, pp. 862-872, May 2014.
[6] I. A. Gowaid, A. El-Zawawi, and M. El-Gammal, "Improved Inertia and Frequency Support from Grid-Connected DFIG Wind Farms," presented at the IEEE Power Systems Conference and Exposition (PSCE), USA, 2011.
[7] A. B. T. Attya and T. Hartkopf, "Control and quantification of kinetic energy released by wind farms during power system frequency drops,"
IET Renewable Power Generation, vol. 7, pp. 210-224, May 2013. [8] P.-K. Keung, P. Li, H. Banakar, and B. T. Ooi, "Kinetic Energy of
Wind-Turbine Generators for System Frequency Support," IEEE Transactions on Power Systems, vol. 24, pp. 279-287, Feb 2009.
[9] J. Lee, E. Muljadi, P. Sorensen, and Y. C. Kang, "Releasable Kinetic Energy-Based Inertial Control of a DFIG Wind Power Plant," Sustainable Energy, IEEE Transactions on, vol. 7, pp. 279-288, 2016.
[10] A. Ivanova, "Frequency support with wind power participation," Master, Polytechnic University of Catalonia, 2016.
[11] C. Singh and R. Billinton, System reliability, modelling and evaluation: Hutchinson, 1977.
[12] Aeolus FP7. Simplified NREL5MW turbine for Simulink [Online]. Available: http://www.ict-aeolus.eu/SimWindFarm/index.html [13] I. D. Margaris, S. A. Papathanassiou, N. D. Hatziargyriou, A. D.
Hansen, and P. Sorensen, "Frequency Control in Autonomous Power Systems With High Wind Power Penetration," IEEE Transactions on Sustainable Energy, vol. 3, pp. CP2-199, Apr 2012.
[14] UCTE, "Appendix 1 — Load-Frequency Control and Performance," ed: The Union of the coordination of the transmission of electricity, 2002.
[15] (2015). Procurement of Control Power and Energy in Germany. Available: http://www.amprion.net/en/control-energy
[16] Rules on Balancing - Spain. Available:
https://transparency.entsoe.eu/balancing-domain/r2/rulesOnBalancing/show?name=&defaultValue=true&viewTyp e=TABLE&areaType=MBA&atch=false&dateTime.dateTime=01.01.201 6+00:00|UTC|YEAR&dateTime.endDateTime=01.01.2017+00:00|UTC|Y
EAR&biddingZone.values=CTY|10YES.
[17] E. Belgium. Ancillary Services. Available: http://www.elia.be/en/products-and-services/ancillary-services
[18] ENTSO-E. (2015). Network Code on Load Frequency Control and Reserves (LFCR). Available: https://www.entsoe.eu/major-
projects/network-code-development/load-frequency-control-reserves/Pages/default.aspx
[19] (2015). Rules on Balancing - Germany. Available:
https://transparency.entsoe.eu/balancing-domain/r2/rulesOnBalancing/show?name=&defaultValue=true&viewTyp e=TABLE&areaType=MBA&atch=false&dateTime.dateTime=01.01.201 5+00:00|UTC|YEAR&dateTime.endDateTime=01.01.2016+00:00|UTC|Y EAR&biddingZone.values=CTY|10Y10