City, University of London Institutional Repository
Citation
:
Elombo, A., Morstyn, T., Apostolopoulou, D. & McCulloch, M. D. (2017).
Residential Load Variability and Diversity at Different Sampling Time and Aggregation
Scales. 2017 IEEE AFRICON, pp. 1331-1336. doi: 10.1109/AFRCON.2017.8095675
This is the accepted version of the paper.
This version of the publication may differ from the final published
version.
Permanent repository link:
http://openaccess.city.ac.uk/19251/
Link to published version
:
http://dx.doi.org/10.1109/AFRCON.2017.8095675
Copyright and reuse:
City Research Online aims to make research
outputs of City, University of London available to a wider audience.
Copyright and Moral Rights remain with the author(s) and/or copyright
holders. URLs from City Research Online may be freely distributed and
linked to.
City Research Online:
http://openaccess.city.ac.uk/
[email protected]
Residential Load Variability and Diversity at
Different Sampling Time and Aggregation Scales
Andreas I. Elombo
*, Thomas Morstyn, Dimitra Apostolopoulou, Malcolm D. McCulloch
Energy & Power Group: Department of Engineering ScienceUniversity of Oxford Oxford, England, UK *[email protected]
Abstract—The increasing use of large-scale intermittent distributed renewable energy resources on the electrical power system introduces uncertainties in both network planning and management. In addition to architectural changes to the power system, the applications of demand side response (DSR) also add a dimension of complexity – thereby converting the traditionally passive customers into active prosumers (customers that both produce and consume electricity). It has therefore become important to conduct detailed studies on system load profiles to uncover the nature of the system load. These studies could help distribution network operators (DNOs) to adopt relevant strategies that can accommodate new resources such as distributed generation and energy storage on the evolving distribution network and ensure updated design and management approaches. This paper investigates the relationship between both the system load diversity and variability when different customers are aggregated at different scales. Additionally, the implication of sampling time scales is investigated to capture its effect on load diversity and variability. The study looks at the diversity and variability that is observable from the viewpoint of higher power levels, when interconnecting different sized groupings of customers, at different sampling resolutions. The paper thus concludes that the per-customer capacity requirement of the network decreases as the size of customer groupings increases. The load variability also decreases as the aggregation level increases. For active network management, faster time scales are required at lower aggregation scales due to high load variability.
Keywords—After-diverstiy maximum demand; variance; aggregation; sampling resolution; system load
I. INTRODUCTION
The electrical power system is evolving into a more complex system that demands smarter and more efficient planning and operation techniques. This evolution is particularly fueled by the increasing use of distributed renewable energy resources, most of which are intermittent in nature. The increase in large scale connections of these energy resources is expected to continue into the future. In addition to architectural changes to the power system, the applications of demand side response (DSR) also add a dimension of complexity – thereby converting the traditionally passive customers into active prosumers (customers that both produce and consume electricity) [1]–[3]. For this reason, it has become important to conduct detailed studies on system load profiles to uncover the nature of the system load. This knowledge is crucial for distribution network operators
(DNOs) to adopt relevant strategies that can accommodate new resources on the evolving distribution network and ensure updated design and management approaches [4], [5].
The residential sector makes up a significant proportion of the total system load, and it is commonly connected to the network 24 hours a day, all through the year [4]. In fact, the UK’s residential load demand represented about 35% of its total electricity demand in 2013 [6], [7]. This figure is expected to be higher today, given the recorded 1% year-on-year rise in the domestic load since 1970 [6]. Residential homes have widely varying electricity consumptions, and their upper-bound consumptions cannot be accurately forecasted. This creates an uncertainty in keeping a carefully managed balance between generation and demand on the system, especially at the distribution level, as well as in the design process of the distribution network. The use of data loggers (and more recently, smart meters) has gained popular use in collecting electricity consumption data at residential homes to study the patterns that may exist [8]–[11]. Such data serves as valuable input to load modelling and forecasting processes as demonstrated in [2], [12]–[14].
Traditionally, distribution networks were designed according to the expected peak demand, which determines the maximum capacity of the network infrastructure [1]. This characteristic is commonly known as the after-diversity maximum demand (ADMD) of the network, and it is defined as the maximum demand per customer as the number of connected customers, each with an individual maximum demand, approaches infinity [2], [15], [16]. The significant increase of stochastic distributed energy resources at the distribution level introduces the need for active control. This has stirred interest in understanding how the system net load (taking into account the distributed energy resources) varies by using data collected from the field.
studies reported in [4], [17], [18], investigated the effect of aggregation scale and sampling resolution on load variation patterns, i.e., the change in load from sampling instant to sampling instant. A key finding from this work was that higher sampling resolutions are necessary to recognise the impact of individual customers on aggregate demand. However, these studies only considered load variability, and not the effect of sampling resolution or aggregation scale on demand diversity. Also, the load profiles used were obtained from simulations. The implications of load aggregation scale and sampling resolution on the ADMD will be important when considering where to place distributed generation and energy storage, and the sizing of these resources [19]. The variance of loads is of importance for active network management strategies, such as stochastic optimal power flow [20].
This paper investigates the relationship between both the diversity and variability when different customer loads are aggregated at different scales. Additionally, the implication of sampling time scales is also investigated to capture its effect on diversity and variability. Diversity is measured in terms of the ADMD, whereas variability is measured by use of variance. This work uses three sets of data, two of which are synthetic and an additional set of real data obtained from residential customers in Belgium, collected over two years. This allows for comparison between synthetic and real data. The study looks at the ADMD and variance that is observable from the viewpoint of higher power levels, when interconnecting different sized groupings of customers, at different sampling resolutions. The view gives insight into the design and management requirements for active network management by DNOs.
The remainder of the paper is organized as follows: Section II presents details of the proposed framework for data analysis and description of the data used in the study; Section III discusses the results obtained through the prosed framework; Section IV provides key conclusions and presents areas for future work.
II. PROPOSED FRAMEWORK
A. Description of Input Data
Three different data sets of residential load profiles were used to allow for a comparative study. The data was obtained from the following sources:
• Centre for Renewable Energy Systems Technology (CREST) Model: an Excel Workbook model by CREST of Loughborough University; generating a 24-hour period load profile within a single UK home at a 1-minute resolution. A total of 200 load profiles were generated. Detailed descriptions of the model are presented in [12]. This data is henceforth referred to as
CREST data.
• Low Voltage Network Solutions (LVNS) Tier-1 Project by Electricity North West Limited (ENWL) and University of Manchester: a total of 200 load profiles were adopted; 24-hour period load profiles at a 5-minute resolution. Full details of the load profiles are provided in [21]. This data is henceforth referred to as LVNS data.
• Belgian Low Voltage (LV) Feeder Smart Meter (SM) Data: 2-year long daily load profiles obtained from smart meters at a 15-minute resolution, from which a total of 200, 24-hour period load profiles were adapted. It is henceforth referred to as LVSM data. This is real data sourced from an ongoing research project being conducted by the University of Mons, in Belgium. The first two are synthetic data; and the third data set is constructed based on real measurements of the Belgian network.
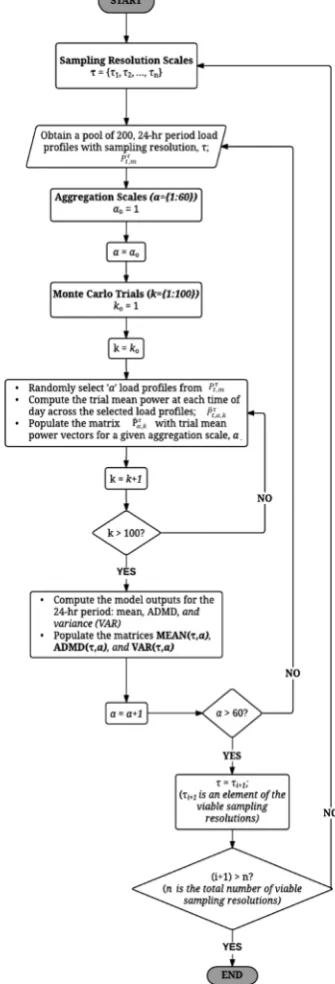
B. The Analysis Framework
The analyses of diversity and variability in relation to both aggregation and sampling resolution scales were done according to the framework illustrated in Fig. 1. The framework was based on the Monte Carlo approach, which is a method of propagating uncertainty from the input to the output sources of a system. In particular, multiple randomized experiments are executed where a number of random inputs are fed to the model to compute its outputs [22]. This approach is necessary due to the large number of possible combinations of homes that occur at each aggregation scale. The idea of using repeated experiments was to estimate the true values of the parameters of interest, and it is expected that as the number of the Monte Carlo trials increase, the observed parameters will tend towards their true values [23]. The random inputs to the model were the 24-hour period load profiles from the respective data sets, and the output parameters of interest were the mean, ADMD, and variance (denoted as VAR). For each sampling resolution, aggregation scales from 1 to 60 homes were considered, and a total of 100 Monte Carlo trials were carried out to compute the model outputs for each of the 60 aggregation scales.
To include the impact of time scale on diversity and variability, it is necessary to consider data with various sampling resolutions. The sampling resolutions (in minutes) for the three respective data sets considered in the study were:
{
1,...,6,10,12,15, 20,30,60}
CREST
τ
= (1){
5,10,15, 20,30,60}
LVNS
τ
= (2){
15,30,60}
LVSM
τ
= (3)These were selected so that they were integer multiples of the underlying data sampling resolutions, and divided evenly into the number minutes during the day.
For each sampling interval
τ
, the pool of 24-hour load profiles for the 200 homes in each dataset (from which inputs to the model are randomly sampled) can be represented as follows:{
}
{
}
24 60, 1,..., , 1,..., 200 , ,
x Pt mτ t Tτ m Tτ
τ
∈ ∈ = (4)
where , is the load for home m at the time intervalt, for the
time-series load profiles sampled at a given resolution of
τ
minutes.
completed. For the kth Monte Carlo trial at aggregation scale
α
, a set of
α
houses, Hkα, is randomly obtained by samplinghomes without replacement. Then, the column vector of the average powers at each time of day for the aggregated group of homes at a sampling resolution
τ
is given by:, , 1, , , , 1, ,
1 1
,..., ,...,
k k
t t
t k k T k m T m m H m H
P P P P P
τ τ
α α
τ τ τ τ τ
α α α α α
∈ ∈
= =
(5)
The mean, ADMD and variance are thus computed as follows:
( )
100 , ,1 1
1 1
,
100
T t k k t
MEAN P
T
τ
τ α τ τ α
= =
=
(6)( )
100(
( )
)
2 , ,1 1
1 1
, ,
100
T t k k t
VAR P MEAN
T
τ
τ α τ
τ α τ α
= =
= −
(7)( )
100(
( )
)
1 1 , ,
, | |T
k t t k
ADMD max max τ Pτ
α
τ α = = = (8)
C. Results Representation
According to the proposed framework, we thus obtain results in the format represented in TABLE I. These results were obtained for each data set in accordance with the corresponding sampling resolutions as defined in (1)-(3).
TABLE I. THE REPRESENTATION OF THE MODEL OUTPUTS FOR EACH
DATASET
Output Matrix
MEAN(τ,α),
[kW]
ADMD(τ,α),
[kW]
VAR(τ,α),
[kW2]
n denotes the number of sampling intervals considered: Fig. 1. The flowchart of a Monte Carlo model to study diversity and variability of aggregated residential load profiles with different sampling resolutions
III. RESULTS
In this section, we present several case studies, for the three data sets, to demonstrate the capabilities of the proposed methodology. We followed the procedure as discussed in Section II, and observed that the average daily demand for the different home grouping sizes tends toward the population mean as the aggregation scale increases. This is true for all the three data sets. The CREST, LVNS and LVSM settled off at about 0.52kW, 0.41kW and 0.83kW, respectively. It was also observed that the mean is the same for all sampling resolution scales across all aggregation scales, as expected. The following
[image:4.595.355.523.64.557.2] [image:4.595.39.288.369.570.2]sections discuss how the ADMD and variance values differ for each of the three data sets.
A. After-diversity Maximum Demand
[image:5.595.325.560.54.554.2]The time-coincident maximum demand was found to decrease as the home grouping size increases. As expected, the highest ADMD was recorded for an aggregation scale of one home for all the data sets, as illustrated in Fig. 2 for CREST. The ADMD then continues to drop before it starts to stabilize at a settling ADMD level when the aggregation level continues to increase. A settling value between 1kW and 2kW was recorded for all the data sets. This observation corresponds with the findings reported in [15].
Fig. 2. CREST: The ADMD variations versus aggregation scales at different sampling resolutions
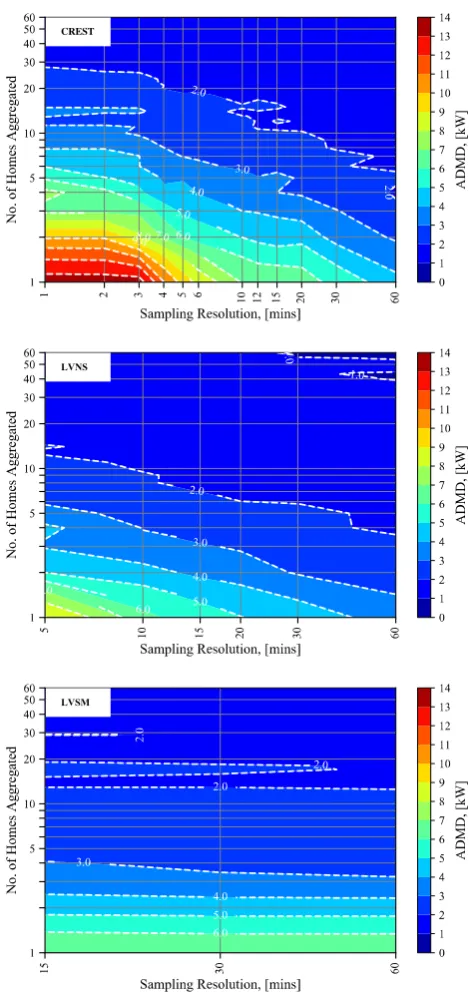
In Fig. 3, we show how the ADMD level changes versus both the aggregation level and sampling resolutions, and it can be observed that higher ADMD values were obtained at higher sampling resolutions. This is more evident for CREST and LVNS data when compared to the LVSM data. Note that the LVSM data was collected at 15 minutes sampling interval.
Fig. 3. A summary of how the ADMD changes when loads of different home grouping sizes are aggregated at different sampling resolutions
B. Variance
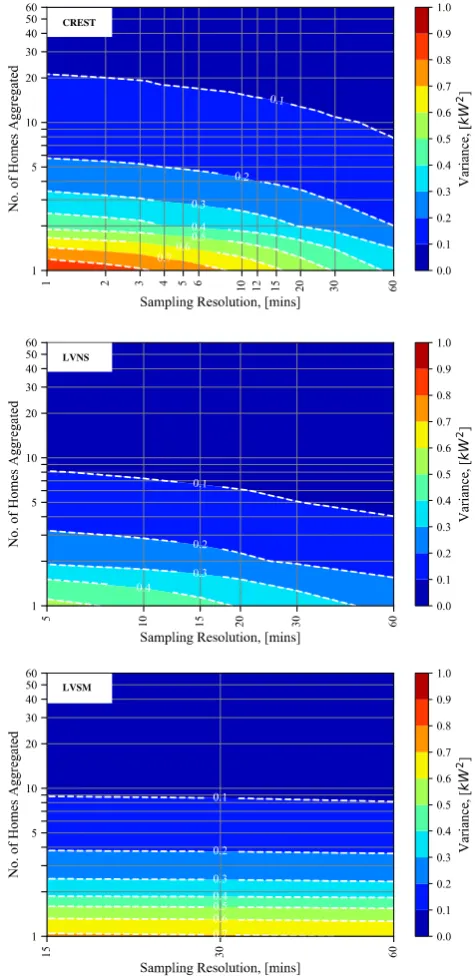
The highest variance was obtained for an aggregation level of one home grouping. As it can be seen in Fig. 4 for CREST, the variance decreases as the level of aggregation increases for all the data sets. This observation is true for all the data sets as depicted in Fig. 5. The CREST data (originally 1 minute resolution) exhibits higher variance levels when compared to the LVNS data (originally 5 minutes resolution). The variance stabilizes at a settling value for all the data sets. The settling value for CREST is the highest (0.07kW2), whereas the settling value for LVSM is the lowest (0.04kW2).
CREST
LVNS
[image:5.595.42.283.208.363.2]Fig. 4. CREST: The variance of loads at different aggregation levels for different sampling resolutions
The effect of aggregation and sampling resolution scales on the variance is summarized in Fig. 5. The variance decreases as the sampling resolution increases.
IV. CONCLUDING REMARKS
In this paper, we have investigated the relationship between system load diversity and variability at different sampling time and aggregation scales. The analysis is relevant for understanding both capacity and operational requirements when interconnecting different sized groupings of residential customers. The per-customer capacity requirement, and load variability of a network decreases as the size of customer groupings increase. However, both capacity requirements and load variability tend to saturate at a finite level as the size of customer groupings go to infinity. For active network management, faster time scales are required at lower aggregation scales due to high load variability
A promising area for future work would be to apply the methods developed for analysis in this paper to determine the optimal placement and sizing of distributed generation and energy storage systems, and to determine the optimal control time scales for active energy management of the network.
ACKNOWLEDGMENT
We are grateful to the University of Mons, Belgium, for granting permission to use their data in this study.
Fig. 5. A summary of how the variance changes when loads of different home grouping sizes are aggregated at different sampling resolutions
REFERENCES
[1] I. Sartori, J. Ortiz, J. Salom, and U. I. Dar, “Estimation of load and generation peaks in residential neighbourhoods with BIPV: bottom-up simulations vs . Velander,” in World Sustainable Building 2014
Conference, 2014, pp. 17–24.
[2] J. Dickert and P. Schegner, “Residential load models for network planning purposes,” in Proceedings - International Symposium: Modern
Electric Power Systems, MEPS’10, 2010, pp. 1–6.
[3] N. Zhang, L. F. Ochoa, and D. S. Kirschen, “Investigating the impact of demand side management on residential customers,” in 2011 2nd IEEE PES International Conference and Exhibition on Innovative
Smart Grid Technologies, 2011, pp. 1–6.
LVNS
[image:6.595.42.282.61.217.2][4] I. A. Sajjad, G. Chicco, and R. Napoli, “A probabilistic approach to study the load variations in aggregated residential load patterns,” in 2014
Power Systems Computation Conference, 2014, pp. 1–7.
[5] UK Power Networks, “Development of new network design and operation practices,” Report D1, 2014. [Online]. Available: https://innovation.ukpowernetworks.co.uk/innovation/en/Projects/tier-2-projects/Low-Carbon-London-(LCL)/Project-Documents/LCL Learning Report - D1 - Development of new network design and operation practices.pdf. [Accessed: 20-Apr-2017].
[6] R. V. Jones and K. J. Lomas, “Determinants of high electrical energy demand in UK homes: Socio-economic and dwelling characteristics,” Energy and Buildings, vol. 101, pp. 24–34, 2015. [7] D. G. Infield, J. Short, C. Horne, and L. L. Freris, “Potential for domestic dynamic demand-side management in the UK,” in 2007 IEEE
Power Engineering Society General Meeting, PES, 2007, no. July 2007.
[8] UK Power Networks, “Use of smart meter information for network planning and operation,” Report C1, 2014. [Online]. Available: https://innovation.ukpowernetworks.co.uk/innovation/en/Projects/tier-2-projects/Low-Carbon-London-(LCL)/Project-Documents/LCL Learning Report - C1 - Use of smart meter information for network planning and operation.pdf. [Accessed: 20-Apr-2017].
[9] E. McKenna, I. Richardson, and M. Thomson, “Smart meter data: Balancing consumer privacy concerns with legitimate applications,”
Energy Policy, vol. 41, pp. 807–814, 2012.
[10] K. Svehla, “A Specification for Measuring Domestic Energy Demand Profiles,” University of Strathclyde, 2011.
[11] C. T. Gaunt, R. Herman, M. Dekenah, R. L. Sellick, and S. W. Heunis, “Data collection, load modelling and probabilistic analysis for LV domestic electrification,” in 15th International Conference on Electricity Distribution, 1999.
[12] I. Richardson, M. Thomson, D. Infield, and C. Clifford, “Domestic electricity use: A high-resolution energy demand model,” Energy and
Buildings, vol. 42, no. 10, pp. 1878–1887, 2010.
[13] R. Sevlian and R. Rajagopal, “Short Term Electricity Load Forecasting on Varying Levels of Aggregation,” 2014.
[14] R. Sevlian and R. Rajagopal, “Short Term Electricity Load Forecasting on Varying Levels of Aggregation,” Transactions on Power Systems, pp. 1–8, 2014.
[15] C. Barteczko-Hibbert, “After Diversity Maximum Demand (ADMD) Report,” Durham, 2015.
[16] P. Boait, V. Advani, and R. Gammon, “Estimation of demand diversity and daily demand profile for off-grid electrification in developing countries,” Energy for Sustainable Development, vol. 29, pp. 135–141, Dec. 2015.
[17] I. A. Sajjad, G. Chicco, and R. Napoli, “Effect of aggregation level and sampling time on load variation profile - A statistical analysis,” in
Proceedings of the Mediterranean Electrotechnical Conference -
MELECON, 2014, no. April, pp. 208–212.
[18] I. A. Sajjad, G. Chicco, and R. Napoli, “A statistical analysis of sampling time and load variations for residential load aggregations,” in
2014 IEEE 11th International Multi-Conference on Systems, Signals and
Devices, SSD 2014, 2014, no. April, pp. 1–6.
[19] Z. Wang, B. Chen, J. Wang, and M. M. Begovic, “Stochastic DG Placement for Conservation Voltage Reduction Based on Multiple Replications Procedure,” IEEE Transactions on Power Delivery, vol. 30, no. 3, pp. 1039–1047, Jun. 2015.
[20] D. E. Olivares, J. D. Lara, C. A. Canizares, and M. Kazerani, “Stochastic-Predictive Energy Management System for Isolated Microgrids,” IEEE Transactions on Smart Grid, vol. 6, no. 6, pp. 2681– 2693, Nov. 2015.
[21] R. Shaw and D. Randles, “Dissemination Document ‘ Low Voltage Networks Models and Low Carbon Technology Profiles ,’” Manchester, 2015.
[22] S. Raychaudhuri, “Introduction to Monte Carlo simulation,” in 2008
Winter Simulation Conference, 2008, pp. 91–100.