JOURNAL OF
SOUND AND
VIBRATION
Journal of Sound and Vibration 297 (2006) 1082–1087
Short Communication
On the valid frequency range of Timoshenko beam theory
N.G. Stephen
a,, S. Puchegger
baSchool of Engineering Sciences, Mechanical Engineering, University of Southampton, Highfield, Southampton SO17 1BJ, UK bInstitute of Material Physics, University of Vienna, Boltzmanngasse 5, A-1090, Vienna, Austria
Received 21 February 2006; received in revised form 25 April 2006; accepted 26 April 2006 Available online 27 June 2006
Abstract
The frequency equation of Timoshenko beam theory factorises for hinged–hinged end conditions, leading to a first and second spectrum of natural frequencies; the latter is largely inaccurate and can be isolated and disregarded. For the majority of other end conditions, when the frequency equation does not factorise, one may think in terms of pseudo-second spectrum contributions arising when evanescent waves become propagating above the cut-off frequency
oco¼
ffiffiffiffiffiffiffiffiffiffiffiffiffiffiffiffiffiffi
kAG=rI
p
, and it is conjectured that these may have a corrupting effect on the frequency predictions. Comparisons with measured and simulated frequencies lead to the conclusion that Timoshenko predictions above the cut-off frequency should be disregarded for those end conditions for which the frequency equation does not factorise.
r2006 Elsevier Ltd. All rights reserved.
1. Introduction
It is well known[1]that the transcendental (or an equivalent algebraic) frequency equation of Timoshenko beam theory (TBT) factorises for hinged–hinged end conditions. This allows one to think in terms of a first and second spectrum of natural frequencies, or first and second branches of a wave propagation dispersion diagram. It has been shown recently [2] that the transcendental frequency equation also factorises for guided–guided and guided–hinged conditions; these new end combinations can be regarded as portions of a multi-span hinged–hinged beam. Below the second spectrum cut-off frequency given by oco¼
ffiffiffiffiffiffiffiffiffiffiffiffiffiffiffiffiffiffi
kAG=rI
p
, TBT predicts both propagating (TBT1) waves, and evanescent (TBT2) waves associated with the hyperbolic spatial functions. Above the cut-off frequency, these hyperbolic functions become trigonometric[3], implying propagation along the structure or, equivalently, the possibility of standing waves at these second spectrum frequencies.
For hinged–hinged end conditions, or equivalently a beam of infinite length, TBT predictions may be compared with those from exact elastodynamic theory, when the accuracy of the first spectrum is beyond reproach. In Ref.[2]comparison was made between ‘‘exact’’ plane stress predictions for a standing wave in a short hinged–hinged beam of thin rectangular cross-section. The agreement between the TBT1 predictions and the exact lower branch asymmetric mode was within the range0:4% to+0.54% for the first 20 modes of www.elsevier.com/locate/jsvi
0022-460X/$ - see front matterr2006 Elsevier Ltd. All rights reserved. doi:10.1016/j.jsv.2006.04.020
Corresponding author. Tel.: +442380 592 359; fax: +442380 593 230.
vibration when using the shear coefficient k¼5 1ð þnÞ=ð6þ5nÞ. Experimental support for this value of the coefficient at long wavelength has also been provided by Me´ndez-Sa´nchez et al.[4].
As wavelength tends to zero, exact elasticity theory predicts wave propagation at the Rayleigh surface wave velocity (RSWV),cR, which may be determined from the appropriate root of the equation
2c 2 R c2 s 2 ¼4 ffiffiffiffiffiffiffiffiffiffiffiffiffiffiffiffiffiffiffiffiffiffiffiffiffiffiffiffiffiffiffiffiffiffiffiffiffiffiffiffiffiffiffiffiffiffiffiffiffiffiffiffiffiffiffiffiffi 1c
2 R c2 s
1 12n
2 1ð nÞ c2 R c2 s s . (1)
TBT1 can be adapted to agree with this, by noting that as wavelength l-0, the TBT1 phase velocity prediction becomes cp¼cspffiffiffikand requiring that this be equal to the RSWV leads to the requirement [5]
2kR ð Þ2¼4
ffiffiffiffiffiffiffiffiffiffiffiffiffiffiffiffiffiffiffiffiffiffiffiffiffiffiffiffiffiffiffiffiffiffiffiffiffiffiffiffiffiffiffiffiffiffiffiffiffiffiffiffiffiffiffi 1kR
ð Þ 1 12n
2 1ð nÞkR
s
;0okRo1. (2)
If one employed a shear coefficient more appropriate for longer wavelength, such ask¼5 1ð þnÞ=ð6þ5nÞfor the plane stress rectangle, the error in the limit of zero wavelength can be expressed in terms of these long- and short-wavelength shear coefficients as ffiffiffiffiffiffiffiffiffiffiffik=kR
p
1
100%. For Poisson’s ratio n¼0.25, one has kR¼0.8453, andk¼0.8621 for the plane stress rectangle, and using the long-wavelength value would lead
to an overestimate of the RSWV by about 1%. Employing a shear coefficient more appropriate for plane strain conditions, k¼5/(6n), would give an overestimate of the RSWV of about 1.5%. Thus one may surmise that a TBT1 prediction can be within 2%, say, of the exact elastodynamic theory across the entire range of wavelengths.
In contrast, the validity of the second spectrum frequency predictions (TBT2) has been called into question on the basis of two studies. In Ref.[6]comparison was made between the phase velocity predictions from the exact Pochhammer–Chree (PC) theory for wave propagation in an infinite rod of circular cross-section, and the equivalent TBT predictions; excellent agreement was found for the lowest flexural mode and TBT1, using the shear coefficientk¼6(1+n)2/(7+12n+4n2). However, no consistent agreement could be found for TBT2; at long wavelength, the TBT2 prediction was close to the second flexural mode of PC theory, as one would wish, but at shorter wavelength TBT2 agreed more closely with the second extensional mode of PC theory. Similarly in Ref. [2], for the thin rectangular cross-section, the TBT2 prediction did not provide consistent agreement with any single mode of vibration; at long wavelength it was very close to the second exact asymmetric mode (as one would wish), but as wavelength shortens it became closer to the second symmetric (extensional) mode, then the third asymmetric mode. In both studies it was concluded that the second spectrum predictions of Timoshenko beam theory should be disregarded.
as unreliablefor those end conditions for which the transcendental frequency equation does not factorise. The purpose of the present work was to test this hypothesis.
For a short free–free beam of near-square cross-section, the Timoshenko frequency predictions are compared with experimental observations, commercial finite element (ANSYS) predictions and predictions from a resonant ultrasound spectroscopy (RUS) technique. RUS was proposed first by Demarest[8], and has become a standard method for the determination of elastic constants (see recent review by Leisure and Willis [9]). It is essentially a best-fit between measured and computed Rayleigh–Ritz upper bound natural frequencies of a specimen. For the free-cube (rectangular parallelepiped) the latter employs products of (orthogonal) Legendre polynomials in the three coordinate directions as basis functions. The experimental set-up consists of the beam specimen suspended and excited by two carbon-fibre loops, which are attached to two piezoelectric transducers, and is described fully in Ref. [10]. Resonant frequencies are found by sweeping the frequency range of interest with a network analyser. Even very weak resonances can be detected by this method, since the noise level of the network analyser is about140 dBm (1 mW reference level).
2. Specimen measurements, finite element analysis, and TBT predictions
A short aluminium alloy beam of near-square cross-section was machined, and found to have dimensions: length L¼40.0470.02 mm, breadth b¼10.0970.01 mm, depth d¼10.0470.02mm; the beam had mass
m¼11.43 g which implies a density r¼2817.9111 kg m3
[image:3.544.41.514.427.674.2]. The elastic moduli were found by a best-fit between the 16 lowest measured bending frequencies (Table 1)—eight in the more flexible (f) and eight in the more stiff (s) plane—and the RUS simulations, leading to Young’s modulus E¼72.66611 GPa, shear modulusG¼27.17481 GPa and hence Poisson’s ratio n¼E/(2G)1¼0.337012. These values of the elastic constants were used in the subsequent finite element analysis performed using ANSYS. The beam was modelled using 20-node brick elements (SOLID95) with the (approximate) element size defined as one-tenth that of the breadth; this leads to 1010 elements to define the cross-section, with the length of the beam divided into 40 elements. The TBT predictions were found using the frequency equation for a free–free beam, as given by Levinson and Cooke [1], with shear coefficient k¼5(1+n)/(6+5n); this was constructed as a
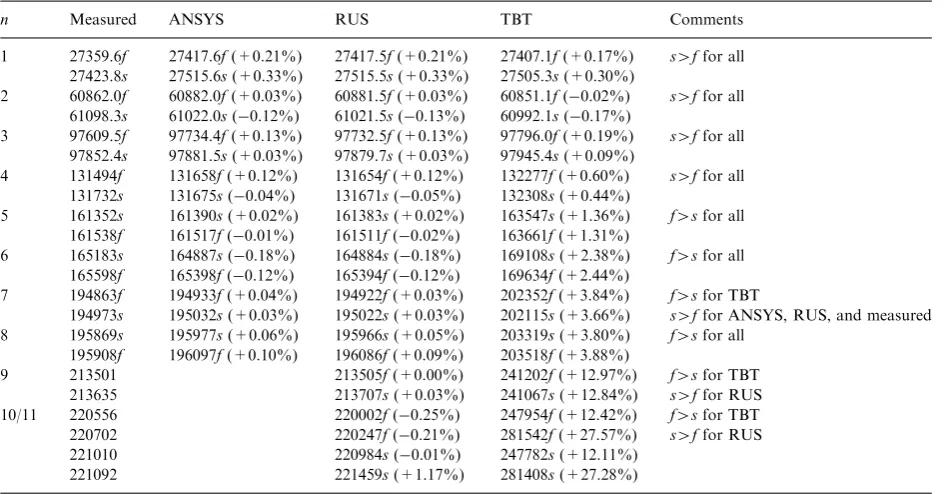
Table 1
Measured and predicted natural frequencies (Hz) for a short free–free aluminium beam
n Measured ANSYS RUS TBT Comments
1 27359.6f 27417.6f(+0.21%) 27417.5f(+0.21%) 27407.1f(+0.17%) s4ffor all 27423.8s 27515.6s(+0.33%) 27515.5s(+0.33%) 27505.3s(+0.30%)
2 60862.0f 60882.0f(+0.03%) 60881.5f(+0.03%) 60851.1f(0.02%) s4ffor all 61098.3s 61022.0s(0.12%) 61021.5s(0.13%) 60992.1s(0.17%)
3 97609.5f 97734.4f(+0.13%) 97732.5f(+0.13%) 97796.0f(+0.19%) s4ffor all 97852.4s 97881.5s(+0.03%) 97879.7s(+0.03%) 97945.4s(+0.09%)
4 131494f 131658f(+0.12%) 131654f(+0.12%) 132277f(+0.60%) s4ffor all 131732s 131675s(0.04%) 131671s(0.05%) 132308s(+0.44%)
5 161352s 161390s(+0.02%) 161383s(+0.02%) 163547s(+1.36%) f4sfor all 161538f 161517f(0.01%) 161511f(0.02%) 163661f(+1.31%)
6 165183s 164887s(0.18%) 164884s(0.18%) 169108s(+2.38%) f4sfor all 165598f 165398f(0.12%) 165394f(0.12%) 169634f(+2.44%)
7 194863f 194933f(+0.04%) 194922f(+0.03%) 202352f(+3.84%) f4sfor TBT
194973s 195032s(+0.03%) 195022s(+0.03%) 202115s(+3.66%) s4ffor ANSYS, RUS, and measured 8 195869s 195977s(+0.06%) 195966s(+0.05%) 203319s(+3.80%) f4sfor all
195908f 196097f(+0.10%) 196086f(+0.09%) 203518f(+3.88%)
9 213501 213505f(+0.00%) 241202f(+12.97%) f4sfor TBT
213635 213707s(+0.03%) 241067s(+12.84%) s4ffor RUS
10/11 220556 220002f(0.25%) 247954f(+12.42%) f4sfor TBT
220702 220247f(0.21%) 281542f(+27.57%) s4ffor RUS
221010 220984s(0.01%) 247782s(+12.11%)
221092 221459s(+1.17%) 281408s(+27.28%)
frequency function,y, using MATLAB. For frequencies below the cut-off, zero values ofywere found using the FZERO command within MATLAB; above the cut-off frequency, the function y is complex, and the FMINS command was used to find a minimum (zero) value of the absolute value ofy. The cut-off frequencies are calculated as fco,f¼159047 Hz for vibration in the more flexible plane, which is greater than
fco,s¼158259 Hz for vibration in the stiffer plane.
3. Results and discussion
The beam cross-section is almost square, so one expects natural frequencies to occur as near equal pairs; these are denoted in Table 1 by the same mode numbern, but qualified as sand f, according to whether vibration takes place within the stiff or flexible plane, respectively.
First note that the ANSYS prediction is always slightly greater than the RUS, but agreement is near perfect; typically, the difference (not shown inTable 1) is less than 0.006%. Thus one may regard the ANSYS and RUS predictions as a unity, and henceforth these are referred to as the simulated frequencies. These simulated frequencies are at times greater, and at times smaller than the measured frequencies, as one would expect from a best-fit analysis for the elastic constants. Best-fit will minimise the absolute differences between the measured and simulated frequencies, so it is no surprise that the largest percentage difference should occur for the fundamental (n¼1) modes. Overall, agreement between the measured and simulated frequencies is excellent for all of the modes shown in Table 1. It is clear that the simulated values are quite capable of providing excellent agreement above the cut-off frequencies; indeed, short beams or cubes are typical RUS samples and the simulated frequencies can be as accurate70.2% for the first fifty modes of vibration (see Fig. 3 of Ref.[9]). In contrast, agreement between the TBT predictions, and the measured and simulated frequencies, is excellent for frequencies below cut-off, that is, nr4 in Table 1. Above the cut-off frequencies, TBT predictions are increasingly greater than both the measured and simulated values. Thus forn¼8, the TBT prediction is nearly 4% greater than the measured value, which is approaching the limit of what might be considered acceptable as an engineering approximation (typically 5%, say), while the simulated values are just some 0.1% greater. For higher modes, n48, the TBT predictions greatly exceed the measured and simulated frequencies.
The question of when to disregard the TBT predictions is now answered according to the accuracy one requires. The results presented inTable 1are quite consistent with Hutchinson’s conclusion that the cut-off frequency is a reasonable choice. Thus for modesn¼1 to 5 (the latter slightly exceed the cut-off frequency) the TBT predictions are within about 0.2% and +1.4% of the measured and simulated frequencies, while fornZ6 the simulated frequencies are still in very good agreement with the measured, but the TBT predictions are increasingly inaccurate.
The following points are also noted:
1. For the first four mode pairs,n¼1 to 4 inTable 1, it is seen that the natural frequency in the stiff plane is slightly greater than in the flexible plane, as one would expect; this is so for the measured, simulated and TBT frequencies. However, this is not always the case for frequencies above the cut-off, that is forn45: all of the TBT, and some of the measured, RUS and ANSYS frequencies are now greater in the flexible plane. This counter-intuitive feature appears not to have been reported previously. Of course, our definition of
flexibleandstiffis based upon the magnitude of the bending stiffnessEIand in turn the second moment of area, I, in the two planes. This is consistent with the Euler–Bernoulli frequency predictions
fEB¼k2pEI=ffiffiffiffiffiffiffiffiffiffiffiffiffiffirA.ð2pÞ, with kL¼4.7300, 7.8532, etc. for free–free end conditions, and TBT regarded as an improvement for these predominantly bending frequencies. On the other hand, the second moment of area also appears in the denominator of the expression for the (pure shear) cut-off frequency
2. The 16 natural frequencies listed inTable 1are those for which the ANSYS animations confirm the flexural nature of the mode; not shown are a further 11 natural frequencies within the frequency range covered in Table 1. Five of these are torsional, three extensional (or longitudinal), and two are for warping modes. One of the warping modes is evanescent, and is characterised by large axial displacements (reminiscent of that produced by a bi-moment) at the ends of the beam, which decay rapidly in magnitude as one moves toward the centre; its frequency is 165 450 Hz, which is greater than the two cut-off frequencies of TBT. One mode has displacements that are largely independent of the axial coordinate, with a shearing (lozenging) of the near-square cross-section into a diamond. None of the mode shapes bears any resemblance to the thickness-shear (independent of axial coordinate) mode, which is the TBT cut-off mode. Indeed it may be shown that free–free end conditions for TBT (zero shearing force and moment) are not consistent with the thickness-shear mode, which has a finite thickness-shearing force that does not vary along the length of the beam. Moreover, the exact linear elastodynamic theory requires zero traction on both the surface generators and the ends of the beam, and the thickness-shear mode [11] satisfies only the former; thus one should not expect the ANSYS simulations to show such a mode for free–free end conditions.
3. ANSYS predictions are not shown for frequencies greater than 200 kHz, as it becomes increasingly difficult to justify describing any of the abundance of vibration modes as bending or flexural, at least from the ANSYS animations. In turn, it is reasonable to question whether the measured frequencies are indeed truly flexural in their character. The procedure adopted to discriminate flexural modes involved the axial rotation of the specimen beam within the carbon-fibre loops; flexural modes were identified as those for which the intensity of the resonance changed from the stiff to the more flexible plane, and vice versa. However, this becomes increasingly difficult for the higher modes, and the measured frequencies are labelled only for
nr8.
Last, the authors accept that the present investigation is limited in its scope, and would encourage other researchers to conduct similar investigations so that a definitive view on the valid range of Timoshenko beam theory can be agreed; to this end, the ANSYS and MATLAB files are available from the corresponding author for scrutiny, and possible development.
4. Conclusions
A comparison has been made of the natural frequencies of bending vibration of a short free–free aluminium alloy beam, in order to test the valid frequency range of Timoshenko beam theory (TBT). Below the cut-off frequency, there is excellent agreement between the measured frequencies, and those predicted by TBT, finite element analysis (ANSYS) and a resonant ultrasound spectroscopy (RUS) technique. Above the cut-off frequency, there continues to be good agreement between the measured and simulated (ANSYS and RUS) frequencies, but the TBT predictions becomes increasing inaccurate. This is consistent with Hutchinson’s conclusion[7]that ‘‘The cut-off frequencyyappears to be a reasonable choice for an upper boundyon the Timoshenko solution.’’ On the other hand, Stephen[2]has shown that first spectrum TBT predictions for a hinged–hinged beam are very accurate at frequencies well in excess of the cut-off frequency, while second spectrum predictions are accurate only at long wavelengths and, in general, should be disregarded. From the present work, it is concluded that TBT frequency predictions above the cut-off frequency should be disregarded as unreliable for all those end conditions for which the transcendental frequency equation does not factorise, as second spectrum contributions cannot be isolated and then disregarded.
References
[1] M. Levinson, D.W. Cooke, On the two frequency spectra of Timoshenko beams,Journal of Sound and Vibration84 (1982) 319–326. [2] N.G. Stephen, The second spectrum of Timoshenko beam theory—Further assessment,Journal of Sound and Vibration292 (2006)
372–389.
[4] R.A. Me´ndez-Sa´nchez, A. Morales, J. Flores, Experimental check on the accuracy of Timoshenko’s beam theory,Journal of Sound and Vibration279 (2005) 508–512.
[5] R.D. Mindlin, Influence of rotatory inertia and shear on the flexural motions of isotropic elastic plates,Journal of Applied Mechanics.
18 (1951) 31–38 (ASME Transactionsvol. 73)
[6] N.G. Stephen, The second frequency spectrum of Timoshenko beams,Journal of Sound and Vibration80 (1982) 578–582. [7] J.R. Hutchinson, Transverse vibrations of beams, exact versus approximate solutions, Journal of Applied Mechanics48 (1981)
923–928.
[8] H.H. Demarest, Cube-resonance method to determine the elastic constants of solids,Journal of the Acoustical Society of America49 (1971) 768–775.
[9] R.G. Leisure, F.A. Willis, Resonant ultrasound spectroscopy,Journal of Physics: Condensed Matter9 (1997) 6001–6029.
[10] W. Lins, G. Kaindl, H. Peterlik, K. Kromp, A novel resonant beam technique to determine the elastic moduli in dependence on orientation and temperature up to 20001C,Review of Scientific Instruments70 (1999) 3052–3058.