www.esri.ie
Working Paper No. 254
September 2008
Measuring International Inequality Aversion
Richard S.J. Tol*
Abstract: I measure the rate of aversion to inequality in consumption as expressed in the development aid given by rich countries to poor ones between 1965 and 2005. Over time, OECD countries have become less concerned about international inequity. Even for a fairly leaky bucket, the consumption rate of inequity aversion is less than the rate of risk aversion, which implies that the pure rate of inequity aversion is negative. That is, rich countries would prefer to see greater inequality between rich and poor countries.
Corresponding Author: [email protected]
Key words: Inequity aversion, risk aversion, income distribution, development aid
JEL Classification: D31, D63
*Economic and Social Research Institute, Dublin, Ireland
Institute for Environmental Studies, Vrije Universiteit, Amsterdam, The Netherlands Department of Spatial Economics, Vrije Universiteit, Amsterdam, The Netherlands Department of Engineering and Public Policy, Carnegie Mellon University, Pittsburgh, PA, USA
2
Measuring International Inequality Aversion
1. Introduction
As globalisation intensifies, so does the need for evaluating policies from the
perspective of a global planner. There is no global planner, but considering what she
would do provides a useful yardstick against which to measure more realistic policy
interventions. Policy analyses at the global scale are immediately confronted with
income differences that are greater than in any individual country, and with income
redistribution policies that are less effective. This paper focuses on the effect of
income distribution on policy evaluation. While many analysts consider a strictly
utilitarian welfare function with risk-averse agents, this implies that uncertainty and
inequality are evaluated with a single parameter – even though they are conceptually
and numerically different (Carlsson et al., 2005; Saelen et al., 2008). This spells
trouble for policies that are both risky and affect the income distribution. A
straightforward generalisation of the welfare function introduces a second parameter,
so that inequality aversion and risk aversion can assume different numerical values. In
this paper, I seek to measure the rate of inequality aversion.
The procedure for this is as follows. I assume that the global planner has the power to
redistribute income from the countries of the OECD to the rest of the world, and that
this is a measure of inequality aversion at the global scale. As OECD countries
voluntarily disburse development aid, the measured inequality aversion is that of “the
OECD”, not that of the world.1 However, a similar model is followed in problems
such as climate change, where it is proposed to spend money on reducing greenhouse
gas emissions in the OECD, primarily to the benefit of the poor (Schelling, 1995).
The measured rate of inequality aversion can be used to evaluate problems in which
rich countries are the donors and poor countries the beneficiaries. Applying the
measured inequality aversion in other contexts should be done with great care, if at
all.
1
The paper proceeds as follows. Section 2 defines inequity aversion, drawing on
previous research. Section 3 presents the exact method of measurement, combining
the literature in Section 2 with another literature on income redistribution. Section 4
presents the empirical findings. Section 5 concludes.
2. Defining inequity aversion
Consider a social welfare function in the sense of Bergson (1938) and Samuelson
(1975): (1) 1 1 1 2 1 1 1 ( , ,..., ) 1 I i i I I i i U
W U U U
U ω ω ω ω − = = ⎧ ≠ ⎪ − ⎪ = ⎨ ⎪ = ⎪⎩
∑
∏
where W is social welfare, Ui is utility of actors i=1,2,…,I, and ω is a parameter, that
can be interpreted as the pure rate of inequity aversion (see Boadway and Bruce,
1984). At the margin, an increase in utility for a relatively happy actor r compares to a
utility increase for relatively unhappy actor p (Ur>Up) as
(2)
1 0
1 for 0
1 0 p r r p W U U W U U ω ω ω ω > < ⎧ ∂ ⎛ ⎞ ∂ = ⎪= ⎨ ⎜ ⎟ ∂ ⎝ ⎠ ⎪
∂ ⎩< >
=
That is, for ω=0, the social planner is indifferent between the actors, regardless of
their initial utility. For ω>0 (ω<0), the social planner prefers an increase in the utility
of the relatively unhappy (happy) actor over an increase in the utility of the relatively
happy (unhappy) actor. The strength of this preference is larger for a larger absolute
value of ω, so that ω is indeed a measure of aversion against inequity in the
distribution of utility. This is underlined if one considers that
(3) limω↑∞W =mini
{ }
Ui ; limω↓−∞W =maxi{ }
UiThat is, in the limits, the welfare function equals either the Rawlsian maximin welfare
function or the Nietzschean maximax welfare function.
Now consider a CRRA utility function
(4)
1
1 1
ln 1
i i i C U C η η η η − ⎧ ≠ ⎪ =⎨ − ⎪ = ⎩
Then the social planner evaluates a relative shift in consumption as
(5)
(1 ) 1 (1
1 for (1 ) 0
1 (1 p r r p W C C W C C
η ω η η ω η
η ω η η ω η + − ⎧> + − ∂ ⎛ ⎞ ∂ = ⎪= + − ⎨ ⎜ ⎟ ∂ ⎝ ⎠ ⎪ ∂ ) 0 ) 0 < =
< + − >
⎩
Note that (5) introduces the consumption rate of inequity aversion: η+ω(1-η). For η
=0, the pure rate of inequity aversion (ω) equals the consumption rate of inequity
aversion (η+ω(1-η)). For ω=0, the (social) consumption rate of inequity aversion
equals the (individual) rate of risk aversion. For other values of η and ω, pure inequity
aversion, consumption inequity aversion, and risk aversion are numerically different.
3. Measuring international inequity aversion in the OECD
Okun’s (1975) “leaky bucket” is a frequently used method to estimate inequity
aversion within countries (e.g., Amiel et al., 1999). The basic thought is that an
inequity-averse social planner would take from the rich and give to the poor. If it were
costless to redistribute income, then everyone would have the same income (or the
social planner would be inequity-neutral). However, if only a fraction of the income
taken from the rich reaches the poor, then it is possible to have both an unequal
income distribution and an inequity-averse social planner. The metaphor arises
because the social planner uses a “leaky bucket” to transfer income. The leakier the
bucket, the more unequal is the optimal income distribution given a degree of inequity
aversion. Vice versa, the degree of inequity aversion, implied by the assumption that
the observed income distribution is optimal, increases as the bucket gets leakier.
I here measure the degree of inequity aversion of countries in the OECD, implied by
the official development aid given to developing countries. Note the leap of faith. I
assume that the OECD collectively acts as a global planner when deciding to aid
developing countries. I need one additional assumption, namely that the global
planner is only interested in distributional issues between countries, but not within
countries. Note that there are few data on how aid is distributed across the income
distribution in developing countries. Then, the global welfare function becomes:
(6)
( )
(
)(
)
1 1
1
1 1 1
where ci is average per capita consumption in country i and Pi is the number of people
in that country. Equation (6) follows from assuming that the global planner considers
each individual separately but evaluates each individual in a country at the country
average per capita income.
With this assumption, for any level and pattern of aid, for any degree of leakiness, and
for any degree of risk aversion, the degree of inequity aversion follows from
(7a)
( )
(1 )(1 )(
)
(1 )(1 )(
)
(1 )(1 )( )
(1 )(1 )i i i i i i i i i i
i OECD i OECD
P c −η −ω P c a −η −ω P c a −η −ω P c − −
∈ ∉
− + = + −
∑
∑
η ωwith
(7b) i i
i OECD i OECD
A A
λ
∈ ∉
=
∑
∑
where a is per capita aid received, A is total aid received, and λ is the degree of
leakiness. Note that a and A are negative in donor countries.2 That is, aid is given up
to the point that the welfare loss of the OECD exactly equals the welfare gain of the
non-OECD.
4. Results
I solved in Equation (7) for λ=0.05, 0.1, 0.2, …, 0.9, 0.95, and consider results for
various values of η. I took data on population, GNI, and ODA received for 1965-2005
from the World Resources Institute (http://earthtrends.wri.org/). I took data for ODA
given from the OECD Development Assistance Committee
(http://www.oecd.org/dac/stats). I rescaled aid received per country so that total aid
received equals total aid given for each year, time the leakage rate λ.3
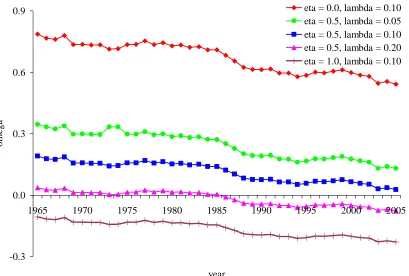
Figure 1 shows selected results per year. Table A1 has the full results. The top line is
the consumption rate of inequity aversion, which equals either parameter if the other
2
Note that (1-ω)-1 and (1-η)-(1-ω) drop out of (6).
3
6
equals zero. In 1965, ω=0.79 (for η=0) and it steadily falls by 0.0060 (s.d. 0.0003) per
year to ω=0.54 in 2005. That is, OECD countries have grown less averse to income
differences with other countries.
The numerical value of 1-(1-η)(1-ω) is also telling. It is lower than commonly
assumed values for η – which is typically set at unity or higher (Evans, 2005). This
implies that, for a reasonable choice of η, ω must be negative – that is, OECD
countries display equity aversion rather than inequity aversion. This is shown in
Figure 1 as well. For η=1.0, ω<0. For η=0.5, ω>0, but only barely so in recent years.
Figure 1 also shows the sensitivity to the leakiness of the bucket. The leakier the
bucket, the greater the implied rate of inequity aversion.
5. Conclusion
I measure the pure rate of inequity aversion as expressed in development aid flows
from the OECD to developing countries, parameterised on the effectiveness of such
aid. The consumption rate of inequity aversion is smaller than the rate of risk
aversion, even if only a small fraction of aid given reaches its target. This implies that
the pure rate of inequity aversion is negative, as result that contrasts with other results
based on surveys and experiments (Amiel et al. 1999; Saelen et al., 2008). Note,
however, that I measure the rate of global risk aversion of the rich countries. An
alternative interpretation is therefore that the people at the top end of the global
income distribution consider the gap between rich and poor to be fair or indeed not
wide enough.
Acknowledgements
I had useful discussions on this subject with David Anthoff. The CEC DG Research
References
Amiel, Y., J.Creedy, and S.Hurn (1999), 'Measuring attitudes towards inequality',
Scandinavian Journal of Economics, 101, (1), pp. 83-96.
Bergson, A. (1938), 'A Reformulation of Certain Aspects of Welfare Economics',
Quarterly Journal of Economics, 52, (2), 310-334.
Boadway, R. and N.Bruce (1984), Welfare Economics Basil Blackwell, Cambridge.
Carlsson, F., D.Daruvala, and O.Johansson-Stenman (2005), 'Are People
Inequality-Averse, or Just Risk-Averse?', Economica, 72, (287), pp. 375-396.
Evans, D.J. (2005), 'The Elasticity of Marginal Utility of Consumption: Estimates for
20 OECD Countries', Fiscal Studies, 26, (2), 197-224.
Johansson-Stenman, O. (2005), 'Global environmental problems, efficiency and
limited altruism', Economics Letters, 86, (1), pp. 101-106.
Okun, A.M. (1975), Equality and Efficiency: The Big Trade-off Brookings Institution
Press, Washington, DC.
Saelen, H., G.Atkinson, S.Dietz, J.Helgeson, and C.J.Hepburn (2008), Risk, Inequality
and Time in the Welfare Economics of Climate Change: Is the Workhorse Model Underspecified?, Discussion Paper 400 ,Department of Economics, Oxford
University, Oxford.
Samuelson, P.A. (1975), Foundations of Economic Analysis (enlarged edition)
Harvard University Press, Cambridge.
Schelling, T.C. (1995), 'Intergenerational Discounting', Energy Policy, 23, (4/5),
-0.3 0.0 0.3 0.6 0.9
1965 1970 1975 1980 1985 1990 1995 2000 2005
year
om
e
g
a
[image:8.595.107.516.98.374.2]eta = 0.0, lambda = 0.10 eta = 0.5, lambda = 0.05 eta = 0.5, lambda = 0.10 eta = 0.5, lambda = 0.20 eta = 1.0, lambda = 0.10
Figure 1. The pure rate of inequity aversion (ω) between 1965 and 2005 for different
values of risk aversion (η) and leakiness (λ).
Table A1. The value of 1-(1-η)(1-ω) for different leakage rates and different years.
Year\ λ 1.00 0.95 0.90 0.80 0.70 0.60 0.50 0.40 0.30 0.20 0.10 0.05
1965 1.000 0.982 0.963 0.922 0.875 0.822 0.759 0.682 0.584 0.446 0.213 -0.019
1966 1.000 0.982 0.964 0.924 0.879 0.827 0.766 0.691 0.595 0.461 0.234 0.000
1967 1.000 0.983 0.964 0.925 0.880 0.828 0.767 0.693 0.598 0.465 0.239 0.014
1968 1.000 0.982 0.963 0.922 0.875 0.822 0.759 0.683 0.585 0.449 0.220 -0.007
1969 1.000 0.983 0.965 0.926 0.882 0.832 0.773 0.701 0.609 0.481 0.265 0.053
1970 1.000 0.983 0.965 0.926 0.881 0.831 0.771 0.699 0.607 0.479 0.263 0.052
1971 1.000 0.983 0.965 0.926 0.882 0.832 0.773 0.701 0.610 0.482 0.267 0.056
1972 1.000 0.983 0.965 0.925 0.881 0.831 0.771 0.699 0.608 0.480 0.266 0.057
1973 1.000 0.983 0.966 0.928 0.885 0.836 0.778 0.708 0.619 0.495 0.287 0.000
1974 1.000 0.983 0.966 0.928 0.885 0.836 0.779 0.709 0.619 0.494 0.285 0.000
1975 1.000 0.983 0.964 0.925 0.881 0.830 0.770 0.698 0.606 0.479 0.264 0.054
1976 1.000 0.983 0.964 0.924 0.880 0.829 0.769 0.697 0.605 0.477 0.264 0.054
1977 1.000 0.982 0.963 0.922 0.876 0.823 0.762 0.688 0.594 0.463 0.247 0.035
1978 1.000 0.982 0.964 0.924 0.879 0.828 0.768 0.696 0.604 0.477 0.265 0.059
1979 1.000 0.982 0.963 0.922 0.876 0.823 0.762 0.689 0.596 0.468 0.256 0.051
1980 1.000 0.982 0.964 0.924 0.879 0.827 0.768 0.696 0.605 0.479 0.272 0.071
1981 1.000 0.982 0.964 0.923 0.878 0.827 0.767 0.694 0.603 0.476 0.267 0.065
1983 1.000 0.982 0.964 0.924 0.879 0.828 0.768 0.697 0.606 0.481 0.274 0.073
1984 1.000 0.983 0.965 0.926 0.882 0.832 0.774 0.705 0.616 0.494 0.290 0.092
1985 1.000 0.983 0.965 0.926 0.882 0.832 0.774 0.704 0.616 0.494 0.291 0.093
1986 1.000 0.984 0.966 0.929 0.887 0.840 0.784 0.717 0.632 0.514 0.317 0.124
1987 1.000 0.984 0.968 0.933 0.893 0.848 0.795 0.730 0.649 0.535 0.345 0.159
1988 1.000 0.985 0.970 0.937 0.899 0.856 0.806 0.745 0.667 0.559 0.376 0.198
1989 1.000 0.986 0.970 0.938 0.901 0.859 0.809 0.749 0.672 0.565 0.386 0.210
1990 1.000 0.986 0.971 0.938 0.901 0.859 0.809 0.749 0.672 0.566 0.388 0.213
1991 1.000 0.985 0.970 0.937 0.900 0.857 0.807 0.747 0.670 0.563 0.384 0.209
1992 1.000 0.986 0.971 0.939 0.903 0.861 0.813 0.754 0.680 0.576 0.404 0.236
1993 1.000 0.986 0.971 0.938 0.902 0.861 0.812 0.753 0.679 0.576 0.404 0.236
1994 1.000 0.986 0.972 0.940 0.905 0.865 0.818 0.761 0.689 0.589 0.422 0.260
1995 1.000 0.986 0.971 0.940 0.904 0.863 0.816 0.758 0.685 0.583 0.414 0.250
1996 1.000 0.985 0.970 0.937 0.900 0.858 0.809 0.750 0.675 0.572 0.400 0.233
1997 1.000 0.986 0.971 0.938 0.902 0.860 0.811 0.752 0.678 0.574 0.403 0.236
1998 1.000 0.986 0.970 0.937 0.900 0.858 0.809 0.749 0.673 0.569 0.395 0.226
1999 1.000 0.985 0.970 0.937 0.899 0.857 0.807 0.746 0.670 0.564 0.388 0.217
2000 1.000 0.986 0.971 0.938 0.902 0.860 0.811 0.752 0.677 0.574 0.402 0.236
2001 1.000 0.986 0.972 0.940 0.905 0.864 0.817 0.759 0.686 0.584 0.414 0.249
2002 1.000 0.986 0.972 0.941 0.906 0.865 0.818 0.761 0.688 0.587 0.420 0.258
2003 1.000 0.987 0.974 0.944 0.911 0.873 0.828 0.775 0.706 0.611 0.455 0.303
2004 1.000 0.987 0.973 0.943 0.909 0.871 0.825 0.771 0.701 0.605 0.445 0.291
Year Number Title/Author(s) ESRI Authors/Co-authors Italicised
2008
253 Using a Census to Assess the Reliability of a
National Household Survey for Migration Research: The Case of Ireland
Alan Barrett and Elish Kelly
252 Risk Aversion, Time Preference, and the Social
Cost of Carbon
David Anthoff, Richard S.J. Tol andGary W. Yohe
251 The Impact of a Carbon Tax on Economic Growth
and Carbon Dioxide Emissions in Ireland
Thomas Conefrey, John D. Fitz Gerald, Laura
Malaguzzi Valeri and Richard S.J. Tol
250 The Distributional Implications of a Carbon Tax in
Ireland
Tim Callan, Sean Lyons, Susan Scott, Richard S.J. Tol and Stefano Verde
249 Measuring Material Deprivation in the Enlarged EU
Christopher T. Whelan, Brian Nolan and Bertrand
Maître
248 Marginal Abatement Costs on Carbon-Dioxide
Emissions: A Meta-Analysis
Onno Kuik, Luke Brander and Richard S.J. Tol
247 Incorporating GHG Emission Costs in the Economic
Appraisal of Projects Supported by State Development Agencies
Richard S.J. Tol and Seán Lyons
246 A Carton Tax for Ireland
Richard S.J. Tol, Tim Callan, Thomas Conefrey, John D. Fitz Gerald, Seán Lyons, Laura Malaguzzi Valeri and Susan Scott
245 Non-cash Benefits and the Distribution of
Economic Welfare
Tim Callan and Claire Keane
244 Scenarios of Carbon Dioxide Emissions from
Aviation
Karen Mayor and Richard S.J. Tol
243 The Effect of the Euro on Export Patterns: Empirical Evidence from Industry Data
Gavin Murphy and Iulia Siedschlag
242 The Economic Returns to Field of Study and
Competencies Among Higher Education Graduates in Ireland
Elish Kelly, Philip O’Connell and Emer Smyth
241 European Climate Policy and Aviation Emissions
Karen Mayor and Richard S.J. Tol
240 Aviation and the Environment in the Context of the
EU-US Open Skies Agreement
Karen Mayor and Richard S.J. Tol
239 Yuppie Kvetch? Work-life Conflict and Social Class
in Western Europe
Frances McGinnity and Emma Calvert
238 Immigrants and Welfare Programmes: Exploring
the Interactions between Immigrant
Characteristics, Immigrant Welfare Dependence and Welfare Policy
Alan Barrett and Yvonne McCarthy
237 How Local is Hospital Treatment? An Exploratory
Analysis of Public/Private Variation in Location of Treatment in Irish Acute Public Hospitals
Jacqueline O’Reilly and Miriam M. Wiley
236 The Immigrant Earnings Disadvantage Across the
Earnings and Skills Distributions: The Case of Immigrants from the EU’s New Member States in Ireland
Alan Barrett, Seamus McGuinness and Martin
O’Brien
235 Europeanisation of Inequality and European
Reference Groups
Christopher T. Whelan and Bertrand Maître
234 Managing Capital Flows: Experiences from Central
and Eastern Europe
233 ICT Diffusion, Innovation Systems, Globalisation and Regional Economic Dynamics: Theory and Empirical Evidence
Charlie Karlsson, Gunther Maier, Michaela Trippl,
Iulia Siedschlag, Robert Owen and Gavin Murphy
232 Welfare and Competition Effects of Electricity
Interconnection between Great Britain and Ireland
Laura Malaguzzi Valeri
231 Is FDI into China Crowding Out the FDI into the
European Union?
Laura Resmini and Iulia Siedschlag
230 Estimating the Economic Cost of Disability in
Ireland
John Cullinan, Brenda Gannon and Seán Lyons
229 Controlling the Cost of Controlling the Climate: The
Irish Government’s Climate Change Strategy
Colm McCarthy, Sue Scott
228 The Impact of Climate Change on the
Balanced-Growth-Equivalent: An Application of FUND
David Anthoff, Richard S.J. Tol
227 Changing Returns to Education During a Boom?
The Case of Ireland
Seamus McGuinness, Frances McGinnity, Philip
O’Connell
226 ‘New’ and ‘Old’ Social Risks: Life Cycle and Social
Class Perspectives on Social Exclusion in Ireland
Christopher T. Whelan and Bertrand Maître
225 The Climate Preferences of Irish Tourists by
Purpose of Travel
Seán Lyons, Karen Mayor and Richard S.J. Tol
224 A Hirsch Measure for the Quality of Research
Supervision, and an Illustration with Trade Economists
Frances P. Ruane and Richard S.J. Tol
223 Environmental Accounts for the Republic of
Ireland: 1990-2005
Seán Lyons, Karen Mayor and Richard S.J. Tol
2007 222 Assessing Vulnerability of Selected Sectors under Environmental Tax Reform: The issue of pricing power
J. Fitz Gerald, M. Keeney and S. Scott
221 Climate Policy Versus Development Aid
Richard S.J. Tol
220 Exports and Productivity – Comparable Evidence
for 14 Countries
The International Study Group on Exports and Productivity
219 Energy-Using Appliances and Energy-Saving
Features: Determinants of Ownership in Ireland
Joe O’Doherty, Seán Lyons and Richard S.J. Tol
218 The Public/Private Mix in Irish Acute Public
Hospitals: Trends and Implications
Jacqueline O’Reilly and Miriam M. Wiley
217 Regret About the Timing of First Sexual
Intercourse: The Role of Age and Context
Richard Layte, Hannah McGee
216 Determinants of Water Connection Type and
Ownership of Water-Using Appliances in Ireland
Joe O’Doherty, Seán Lyons and Richard S.J. Tol
215 Unemployment – Stage or Stigma?
Being Unemployed During an Economic Boom
Emer Smyth
214 The Value of Lost Load
Richard S.J. Tol
213 Adolescents’ Educational Attainment and School
Experiences in Contemporary Ireland
Merike Darmody, Selina McCoy, Emer Smyth
212 Acting Up or Opting Out? Truancy in Irish
Secondary Schools
Merike Darmody, Emer Smyth and Selina McCoy
211 Where do MNEs Expand Production: Location
16
Frances P. Ruane, Xiaoheng Zhang
210 Holiday Destinations: Understanding the Travel
Choices of Irish Tourists
Seán Lyons, Karen Mayor and Richard S.J. Tol
209 The Effectiveness of Competition Policy and the
Price-Cost Margin: Evidence from Panel Data
Patrick McCloughan, Seán Lyons and William Batt
208 Tax Structure and Female Labour Market
Participation: Evidence from Ireland
Tim Callan, A. Van Soest, J.R. Walsh
207 Distributional Effects of Public Education Transfers
in Seven European Countries