www.esri.ie
Working Paper No. 359
October 2010
From Data to Policy Analysis: Tax-Benefit Modelling
using SILC 2008
Tim Callan, Claire Keane, John R. Walsh and Marguerita Lane
Subsequently published in "From Data to Policy Analysis: Tax-benefit Modelling Using SILC 2008", Statistical and Social Inquiry Society of Ireland, Vol. 40, 2010-11, pp.1-10
Corresponding Author: [email protected]
Paper presented at the Statistical and Social Inquiry Society of Ireland, Central Statistics Office, Cork, 30 September 2010
1
From Data to Policy Analysis: Tax-Benefit Modelling
using SILC 2008
1. Introduction
Policy makers and the body politic have a strong interest in ensuring that the tax
transfer system functions well. This common interest in policies that are efficient in
achieving their objectives – including economic efficiency and fairness – is
heightened by the scarcity of resources during the current crisis. The effects of tax and
welfare policy changes are wide-ranging and complex, varying with the
characteristics of individuals and their family and household situation. Changes in
income tax and social welfare can alter the distribution of income and the incidence of
poverty (whether measured in terms of income alone (“risk of poverty”) or in terms of
income and material deprivation (consistent poverty)). Tax and welfare changes can
also have significant impacts on financial incentives to work, potentially affecting
decisions about labour market participation and hours of work.
Tax-benefit models have been widely used as tools for the analysis of potential policy
reforms - for a recent review see Bourguignon and Spadaro, 2009. Microsimulation
modelling has been widely used in the UK and the US for many years in order to
explore policy choices and the impact of potential or actual policy changes. In Ireland,
a tax-benefit model was developed at the ESRI to undertake a similar role. The
SWITCH model (Simulating Welfare and Income Tax CHanges) was initially based
on the ESRI’s 1987 Survey of Income Distribution, Poverty and Usage of State
Services, and later was re-based to use data from the Living in Ireland Surveys. In
more recent years, the model has been redeveloped to use data from the CSO’s
Survey on Income and Living Conditions (SILC) – first based on data for the year
2005, and now based on the most recent year currently available, 2008.
This paper looks more closely at the technical issues which arise in using SILC data
as the basis for the SWITCH tax-benefit model. Some specific applications are used
to illustrate particular points, but the main focus of the paper is a more technical one.
2
model and the contribution it makes to policy evaluation. Section 3 discusses the
broad data requirements of a tax benefit model. Section 4 documents the procedures
and issues involved in creating a database for the model based on data from the
CSO’s Survey on Income and Living Conditions (SILC). Section 5 considers issues
regarding the degree to which the database represents the income tax base and social
welfare client population. The potential role of weights designed specifically to
address this issue is considered. Adjustment of the survey database to represent the
next budgetary year is also discussed. Some key issues are then drawn together in the
concluding section.
2. Modelling Tax and Welfare Policy Options
Very often policy changes are considered in terms of their effects on a number of
“hypothetical families”. This approach has severe limitations. For example, less than
one family in 20 falls into the category of “one-earner couple with 2 children” which
attracts so much attention at budget time. Furthermore families within this category
differ in terms of income, housing tenure, and other characteristics that affect their
tax-benefit position. More fundamentally, analysis of hypothetical families - no matter
how well chosen - simply cannot give an overall picture of the impact of a policy
change on incomes and work incentives.
Up until 2007 SWITCH was based on data from the Living in Ireland (LII)
Surveys. In 2007 the model was rebased using data from the 2005 wave of the CSO’s
Survey on Income and Living Conditions (SILC). One advantage of the SILC data
over that of the LII is the size of the sample interviewed, with the SILC sample size
being about 50% greater than that for the earlier surveys. By the final year of the LII
Survey (2001) the sample size stood at 2,865 households with 6,518 individuals. The
2005 wave of SILC consisted of 6,085 households with 15,539 individuals. The
current model has been rebased using data from the 2008 SILC containing households
with 12,551 individuals.
It is not currently feasible to update the model with the most recent data available
each year due to time and financial constraints. Therefore, for the purpose of
3
current budgetary year. Even if it were possible to update the data in the model
annually there would always be a need to adjust and uprate the data as data is never
available for the current year. As the model is based on a large-scale nationally
representative sample of households this ensures that the model represents as fully as
possible the great diversity of household circumstances relevant to tax and social
welfare.
At the heart of the SWITCH package is a suite of programs that simulate the
disposable income each family would obtain under the current set of income tax and
social welfare policies, and under an alternative policy of interest. The results are
tabulated to show the patterns of gains and losses over the income distribution, or by
family type, and to give an indication of the incidence of relative income poverty. The
policy change under consideration could be a simple change in one tax rate; or a
complex programme of tax and welfare reform. The model is used each year to assess
the impact of the budget. The model can be used to explore long-term packages of
reforms, and then examine alternative paths towards the selected long-term objective.
As well as evaluating possible and actual policy changes SWITCH can be used to
examine counterfactual situations, specifically the computation of replacement rates
and marginal tax rates.
3. Data Requirements
Simulating the welfare entitlements and income tax liabilities of a given
individual or family requires quite detailed information on a wide range of variables,
including
• ages of family members
• marital status
• family and household composition
• labour force status of the individual
• detailed information on the components of income received by the
individual and his or her spouse/partner
4
Much of the required information is gathered by SILC as part of the process of
measuring disposable income, for the purposes of measuring indicators of poverty and
social exclusion.
Most tax and welfare policies operate do not operate at the level of the household,
though household income and household welfare are of key concern to policy.
Instead, tax and welfare policies tend to operate at either individual level (e.g,
contributions to social insurance, and some social insurance benefits) or at a family
unit level. Detailed information on family and household composition is needed to
ensure that it is possible to group individuals into family units, defined as an
individual, together with his or her spouse, and dependent children. Further
information on how this is done for SWITCH is given in the next section.
The CSO’s SILC forms part of a set of harmonized surveys used by Eurostat to
analyse issues relating to poverty, social inclusion and other issues. The income
concept adopted at European level is measured in annual terms. e.g., total employee
and self employed income received during the last year etc. As a result, annual
incomes are the core concern of the Irish implementation of SILC. While there are
good reasons to be interested in this measure of income, it is not a suitable measure
for the purpose of simulating welfare entitlement. In order to be able to analyse policy
changes, it is essential to be able to simulate welfare entitlements both under the
current system and under the proposed reforms. Welfare entitlements depend in the
main on current income and labour market status. In the transition from the use of the
Living in Ireland surveys to SILC for purposes of monitoring poverty in Ireland, CSO
included a number of questions designed to ensure that the Irish version of SILC
would capture key elements of the current income measure as well as annual income.
Further detail on specific issues related to current income will be given in the next
section: in what follows here we give a flavour of some of the issues involved.
Given the need to simulate current entitlements, it is clear that annual income
measures would not suffice. Think, for example, of a person who was in employment,
became unemployed and received Jobseeker’s Benefit. The individual might then
5
returning to work. But when simulating the individual’s welfare entitlement, we
would need to take into account his or her current situation and income. In order to do
this, we construct variables relating to current employment, current income and
current receipt of social welfare benefits, based on the additional detail now available
in SILC 2008.
Therefore, we need to construct variables such as the current wage and current
receipt of each of the social welfare schemes. This proved difficult to do with the data
gathered in SILC 2005, but some key additional variables are included in the
Research Microdata File for SILC 2008.1
More generally, the value of the SILC strategy for collection of information on
receipt of social welfare benefits must be acknowledged. Respondents to the survey –
which is entirely voluntary and dependent on public cooperation – are offered a
choice of how to provide information on their receipt of social welfare benefits. They
can, in the traditional way, respond directly to a series of questions on welfare
benefits. But the vast majority of respondents take up the other option, which is to
provide the interviewer with their PPSN (personal public services number) and
permission for CSO to use this to obtain the relevant information via the records of
the Department of Social Protection.
This strategy has a number of benefits:
• For respondents, it reduces the time-cost of cooperating with the survey – and
the fact that upwards of 80 per cent of respondents chose this option indicates
that this was preferred by most.
• It is an efficient method of data collection, using a pre-existing source
• It provides high quality information, not distorted by problems of recall or
misclassification of benefits.
In our earlier experience with the direct collection of information on welfare receipt
(for example, in the Living in Ireland surveys), it was clear that while many
individuals gave accurate information, there were some particular benefits where
respondents tended to be unclear as to which benefit was received. For example, some
1 We are grateful to CSO for the inclusion of a small number of key variables which have greatly
6
widows might claim to be in receipt of an old age pension when in fact they received
a widow’s pension. Similarly there could be confusion as between State Contributory
and Non-Contributory Pensions. When the information is provided via the
administrative database, such problems are minimised.
4. Constructing a Model Database from SILC
As mentioned in Section 2 family units are created based on the information
contained in the SILC survey. The basic unit of analysis in the model is either a tax
unit or an income-sharing unit. A tax unit represents a married couple or single
person, together with all children aged under 15, and children aged less than 18 who
are in full time education. An income sharing unit is a broader family-based concept
which also includes students of any age living with their parents. The difference
between income-sharing units and tax-sharing units is that third-level students living
with their parents are counted as separate tax units, but are included part of the same
income-sharing unit as their parents.
While tax and welfare policies tend to operate, in the main, at either individual
or family unit level, policy also has a keen interest in the outcomes at household level.
For example, analysis of those falling below relative income poverty lines or “at risk
of poverty” is based on income per adult equivalent at household level, but with each
individual (adult or child) counting separately. This is the procedure most often
adopted in, for example, the EU Joint Social Inclusion Report and the monitoring
poverty reports produced by the ESRI for the DSFA. Similarly the national measure
of “consistent poverty” is one which is defined at household level.
Once tax and income sharing units have been created the model then goes on to
simulate tax liabilities and social welfare receipt. For social insurance (contributory)
benefits, we model the amount of the payment, which depends on family
circumstances including the earnings of a spouse. For social assistance
(non-contributory) benefits, the model uses information from the survey to establish
whether the individual falls into a category covered by a particular scheme; and then
whether the individual is entitled to any payment, based on the means test applicable
to that scheme or broad group of schemes. Similarly, information gathered in the
7
individual and/or tax unit. As well as simulating income tax and PRSI under existing
rules, the model allows for policy reforms, such as the introduction of a Universal
Social Charge, to be analysed. (See Callan et. al., 2010)
5. Calibration and Validation
The CSO weighting procedure2 used to create household cross-sectional weights
begins with household design weights, which are in inverse proportion to the
probability of selection. A further adjustment is made to take account of non-response
among longitudinal households, but no such adjustment is made for cross-sectional or
“wave 1” households, as substitutions were made for non-responding households.
Benchmark information or “control totals” are then used to estimate weights which
gross up the data to population estimates. This approach is a well known one
internationally, and is part of EUROSTAT’s specification for SILC. Broadly
speaking, the weighting estimates are derived finding the smallest adjustment to the
weights which ensures that the weighted estimates reproduce the control totals or
“benchmarks”.
The control totals or benchmarks used by CSO are:
• population estimates by sex and age group (0-14, 15-34, 35-64, 65 and over).
These are based on population projections, which draw on Census data.
• Household population estimates at regional level using the eight NUTS3
regions. These are generated from the Quarterly National Household Survey
(QNHS)
• Household composition controls (6 categories, depending on numbers of
adults and numbers of children) which are also drawn from the QNHS.
These controls help to ensure that SILC is broadly representative of the Irish
household population in terms of key demographics (age group, sex, household
composition and region). There is, however, no guarantee that this set of controls will
ensure that the survey data represent the social welfare client population and/or the
income tax base. These are key requirements for a tax-benefit model: the value added
2 The description given here is a summary of the information in Appendix 2, Background Notes, of
8
by the model will be greatly enhanced if the input database provides a good
representation of the welfare client population and the income tax base. In what
follows we explore this issue.
We begin by considering the estimates of the social welfare client population based
on SILC with the official statistics on numbers of recipients of social welfare
schemes.Table 1 shows the estimated numbers of social welfare recipients by scheme
type for 2008. The first column of figures shows the number of recipients by scheme
as documented by the Department of Social Protections annual statistical report,
Statistical Information on Social Welfare Services (SISWS) for 2008. These figures
are based on the numbers in receipt of benefit as at 31 December 2008 (and the same
end-December date is used for each year of the report). Thus, they provide a snapshot
picture of the welfare population. In order to provide a comparable picture, the
second column of figures shows the (grossed-up) number of persons currently in
receipt of social welfare benefits as of the date of interview for the SILC.. As noted
earlier, this involves specially constructed variables for current receipt of benefit;
figures on the numbers receiving benefits at some time during the year would not be
comparable with the snapshot picture provided by the administratives statistics,
though they are of course of interest for other purposes.
The SILC ‘current’ figures refer to the number of people who state that they
are currently in receipt under a particular scheme at the date of interview. The figures
are not directly comparable with the end-December figures from SISWS, as the SILC
interviews take place throughout the year. Data collection for SILC 2008 began in
November 2007 and continued until December 2008. While there are some payments
with a seasonal element (e.g., back to school, Christmas bonus and fuel allowance)
these do not have a major impact on the comparison. Trends in unemployment have
the potential to make a more serious impact, and the differences between
unemployment averaged over November 2007 to December 2008, and the
9
Table 1: Numbers of recipients by social welfare scheme: Estimates based on SILC 2008 compared with administrative statistics at 31 December 2008.
Scheme type1:
Statistical Information on Social Welfare Services, 2008
SILC 2008, Current2 Retired/Older people State Contributory Pension3 211.4 186.4
Retirement Pension 6.8 *
State Non-Contributory
Pension3 97.7 88.7
315.9 275.1
Family
Widow(er)'s Contributory
Pension 112.2 115.7
Widow(er)'s Non-Contributory
Pension 2.0 *
Deserted Wife's Benefit 9.1 10.7 One-parent Family Benefit 87.8 100.2
Maternity Benefit 23.4 *
234.6 226.6
Illness/Disability/ Carer's
Illness Benefit (Disability
Benefit) 73.6 83.4
Invalidity Pension 53.7 64.9
Injury Benefit 0.8 *
Disablement Benefit 13.2 *
Carer's Benefit 2.2 *
Disability Allowance 95.8 107.2
Carer's Allowance 43.6 38.9
282.9 294.3
Jobseeker Supports Jobseeker's Benefit 121.8 89.5 Jobseeker's Allowance4 122.5 145.3
244.2 234.7
Employment Support Back to Work 3.6 * Family Income Supplement 27.8 36.0
Farm Assist 7.5 15.7
38.9 51.7
Supplementary Welfare Allowance
Regular Supplementary Welfare
Allowance 35.5 13.9
1 Figures for Deserted Wife's Allowance, Blind Pension, Health and Safety Benefit, Adoptive Benefit, Guardians Payment Contributory, Guardians Payment Non-Contributory Pension, Part-time Job Incentive Scheme, Back to Enterprise and Back to Education schemes are excluded due to low numbers in the population and hence low or zero numbers in the sample.
2 The weight used in this analysis is the one described in CSO (2009) Survey on Income and Living Conditions (SILC) 2008 i.e, it is based on demographics (4 age groups by sex), household location (8 NUTS3 regions) and household composition.
3 SISWS 2008 figures adjusted to exclude recipients living outside the state, who would be outside the scope of the SILC. (See Table B8 of Statistical Information on Social Welfare Services 2008, category 'other').
4 Includes Pre-Retirement Allowance, now discontinued. *Fewer than 30 cases in sample, estimates not reported
10
• SILC coverage of each of the groups of schemes is excellent
• Major schemes within each group of schemes are also well represented. For
schemes with more than 40,000 recipients, the coverage ratio (numbers
estimated from SILC as a proportion of numbers reported in SISWS) ranges
from 87 per cent to 121 per cent.
• For schemes relating to old age, we should note also that about 10 per cent of
those aged 65 and over are living in non-private households – mainly nursing
homes and hospitals.3 When this is taken into account the coverage ratio for
the State Contributory and Non-Contributory Pensions is close to 100 per cent.
• For smaller schemes, the sample size is sometimes insufficient to allow an
estimate to be published, and coverage is more variable in the cases where an
estimate can be provided.
• The total in receipt of unemployment compensation is close to that recorded at
December 2008 by SISWS, but the composition is rather different. At
December 2008 there were more persons in receipt of Jobseeker’s Benefit, and
fewer in receipt of Jobseeker’s Allowance. This reflects the fact that the onset
of the recession brought new inflows onto the Live Register who had
previously been in employment, and had an entitlement to the insurance-based
Jobseeker’s Benefit.
Overall then, SILC can be seen as providing a very good representation of the social
welfare client population, making it a good base from which to conduct policy
analysis and modelling.
We now turn to a comparison of the SILC survey with the income tax base, as
measured by the Revenue Commissioners. Table 2 below shows that about a quarter
of income tax payments come from tax units with incomes below €60,000 per annum.
Over 40 per cent comes from those with incomes between €60,000 and €150,000, and
a further 30 per cent from the small number of tax units with incomes above
€150,000. When we compare the SILC-based estimate of numbers of tax units in
these income ranges with the numbers reported by Revenue, we find that SILC has
somewhat higher numbers in the lowest income band. This is not unexpected as
11
Revenue coverage of the lowest incomes is unlikely to be complete. However, at
higher income levels this consideration does not apply, and SILC appears to
underrepresent the population of those with incomes above €60,000 and in particular,
those with the highest incomes, above €150,000.
Table 2: Distribution of Aggregate Income Tax Payments and SILC Coverage of Taxpayers by Income Range, 2008
Gross annual income range
% of aggregate income tax payments
Ratio between SILC-based estimate of no. of tax units and Revenue estimate
From To
0 60,000 26 107%
60,000 150,000 44 81%
Over 150,000 30 71%
It would be unrealistic to expect a perfect match between SILC-based estimates and
Revenue figures. First, this comparison is based on annualised current income, as
used in the SWITCH model. Revenue statistics, on the other hand, use income in the
calendar year. Second, married couples opting for separate assessment may appear as
two separate tax units in the Revenue figures, but as a single tax unit in the SILC
based figures. Nevertheless, we expect that the underrepresentation of higher
incomes, and in particular of the highest incomes, would be robust to corrections for
these factors. Indeed, underrepresentation of higher incomes in surveys is not an
uncommon finding in the international literature. There have been similar problems in
surveys in other countries, and in previous surveys of income in Ireland – including
the predecessors of the SILC, the ESRI’s Living in Ireland Surveys (1994-2001) and
the Survey of Income Distribution, Poverty and Usage of State Services (1987).
The most important factor contributing to this phenomenon is not, as is
sometimes thought, the underreporting of incomes. (This tends to be more of a
problem where a single income question or a small number of questions are used.
SILC looks for a great deal of detail on income components – thereby prompting
respondents to recall items that might be forgotten if asked a single question).
12
from lower response rates from those with higher incomes – which may be linked,
among other things, to a higher value placed on time.
Given that this is so, a strategy which can be used to correct for differential response
rates is to calibrate the weights using external information, such as that from the
Revenue statistics. As tax-benefit models seek to represent both the income tax base
and the social welfare client population, this is an important issue to which we now
turn.
Essentially the procedure used is the same as that employed by CSO in
constructing the benchmark weights. The difference is that some additional control
totals are used, chief among these being control totals or benchmarks relating to the
distribution of income taxpayers by income band.4 Similar approaches have been
employed for many years in UK tax-benefit models (Atkinson et al., 1988) and in
Germany (Merz). The CSO benchmark weights are treated as the initial weights in our
procedure, and new weights are estimated using the CALMAR software5, which gross
up the population both to the new control totals, and to the controls applied by CSO.
While these weights, by design, differ as little as possible from the input weights, the
differences are substantial. Part of the price for the inclusion of additonal controls is
that the dispersion of the weights is increased. In our application to 2008, 80 per cent
of the cases receive a weight which is between 37% and 230% of the initial weight.
This means that two cases which started out with the same weight could see their final
weights differ by a factor of 6; and greater differences are found for the remaining 20
per cent of cases.
Given that our procedure involves re-applying the control totals from the CSO
benchmarks, results on these domains tend to be similar. However there are
substantiala differences in terms of the implications of the alternative weighting
4
There is also one additional demographic control, giving further detail on the numbers above and
below 18. Without this it is possible that the numbers in the key age group for labour market
participation may not be fully captured.
5 CALMAR was developed by INSEE and is widely used by national statistical agencies in Europe and
13
choices for the analysis of tax policy. Table 3 reports costings of tax policy changes
from the Department of Finance/Revenue pre-Budget 2008 “Ready Reckoner”. These
are compared with two costings based on SWITCH: one using SILC with the CSO’s
benchmark weights, and the other using SILC with the adjusted weights involving
calibration to the income distribution among taxpayers. It is clear that when the
CSO’s benchmark weights are used, the costs of tax policy changes are substantially
underestimated – “coverage” of the cost ranging from about 60 per cent (for a top rate
tax cut) to 80 per cent (for a change in the personal tax credit). This is to be expected
given the comparison of income distributions in Table 2. Using the adjusted weights,
on the other hand, the costs are well represented, with the “coverage ratio” varying
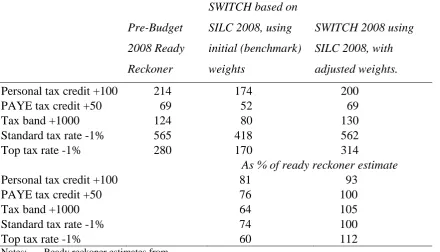
[image:14.595.89.530.336.588.2]between 93 and 112 per cent.
Table 3: Costing of tax policy changes, 2008.
Pre-Budget
2008 Ready
Reckoner
SWITCH based on
SILC 2008, using
initial (benchmark)
weights
SWITCH 2008 using
SILC 2008, with
adjusted weights.
Personal tax credit +100 214 174 200
PAYE tax credit +50 69 52 69
Tax band +1000 124 80 130
Standard tax rate -1% 565 418 562
Top tax rate -1% 280 170 314
As % of ready reckoner estimate
Personal tax credit +100 81 93
PAYE tax credit +50 76 100
Tax band +1000 64 105
Standard tax rate -1% 74 100
Top tax rate -1% 60 112
Notes: Ready reckoner estimates from
http://www.finance.gov.ie/documents/publications/taxation/Ready_Reckonerpre2008.pdf
What implication do the adjusted weights have, if any, for the estimates of
“risk of poverty” based on SILC? This depends on two conflicting influences. On the
one hand, the additional income captured by this method tends to raise the poverty
line. Of itself, this would tend to raise the numbers falling below the income line. But
the adjusted figures also imply that a smaller proportion of the population falls into
low income categories, and more into the higher income categories. This works in the
14
be determined a priori. A full simulation of the alternative scenario, with adjusted
weights, is needed. to resolve the issue of whether this will raise or lower the head
count of poverty. This has been done using SWITCH.
Before we turn to these results, we must not that SILC 2008 reports an “at risk
of poverty” rate of 14.4 per cent in 2008. Simulation using the SWITCH model, with
the benchmark weight provided by CSO, arrives at a slightly lower figure, 13.3 per
cent. Of necessity, simulation is based on the premise that all individuals obtain their
maximum welfare entitlements. Simulated poverty measures tend, therefore, to be
somewhat lower than the actual – but provide a good basis for simulating the impact
of policy changes on risks of poverty.
What happens to the at risk of poverty measure when using the adjusted
weight, taking into account the distribution of income among taxpayers as measured
by the Revenue? Our results indicate that the head count would fall slightly, to 12.4
per cent. Thus, the impact of the reweighting on the composition of the population as
between low and high incomes dominates the impact of the reweighting on the level
15 6. Conclusion
Tax-benefit modelling is now part of the infrastructure for policy making and
policy debate in Ireland, as in many other countries (see for example the work of the
Institute for Fiscal Studies in the UK, and of the Tax Policy Center in the US). The
use of the model to analyse current tax and welfare policy issues means there is a need
for data to represent both the social welfare client base and the income tax base. SILC
data provides a key input in this regard. The SILC database for tax benefit modelling
has been improved by a small number of additional or more detailed questions, and by
linkages to administrative data – which fully respect the requirements of anonymized
data in the Research Microdata File (RMF). There are, however, issues surrounding
the coverage of the income tax base; in our view, re-calibration of the data is needed
to deal with this, when analysing tax-benefit policies using a microsimulation model.
What sorts of developments could help to further improve the data infrastructure
for policy analysis of taxes and benefits? From our perspective, two areas could offer
considerable potential. The first is the possibility of linkages on the income tax side
parallel to those on the social welfare side. If income information could be provided
conveniently and accurately via linkages to income tax records, this could help to
impove both accuracy and perhaps coverage. Sample size is the other major area
where improvements might be sought. Much larger sample sizes, such as are found in
the UK’s Family Resource Survey, could also improve the accuracy and quality of the
database; but the costs involved are similar no matter what the size of country,
16
References
A.B. Atkinson, J. Gomulka, H. Sutherland (1988), "Grossing-up FES data for tax-benefit models", in A.B. Atkinson, H. Sutherland (Eds) Tax-Benefit Models, London: STICERD Occasional Paper No. 10.
Bourguignon, F. and A. Spadaro (2006) “Microsimulation as a tool for evaluating redistribution policies” Journal of Economic Inequality (2006) 4: 77–106
DOI: 10.1007/s10888-005-9012-6
Central Statistics Office, 2009. Survey on Income and Living Conditions (SILC) 2008, Cork: Central Statistics Office
Constance F. Citro and Eric A. Hanushek (eds), Improving Information for Social Policy Decisions: The Uses of Microsimulation Modelling Vol. I: Review and Recommendations and Vol. II: Technical Papers, National Research Council,
National Academy Press, Washington DC, 1991. Vol. I xiv + 346 pp, Vol. 2 vii + 351 pp. paper, £30.00 and £33.95..
Immervoll, H., Kleven, H. J., Kreiner, C. T. and Saez, E. (2007), Welfare reform in European countries: a microsimulation analysis. The Economic Journal, 117: 1–44. doi: 10.1111/j.1468-0297.2007.02000.x
Merz, J., (1991) “Microsimulation -- A survey of principles, developments and applications”, International Journal of Forecasting, Volume 7, Issue 1, May, pp.77-104, ISSN 0169-2070, DOI: 10.1016/0169-2070(91)90035-T.
17
Year Number Title/Author(s) ESRI Authors/Co-authors Italicised 2010
358 Towards a Better and Sustainable Health Care System –
Resource Allocation and Financing Issues for Ireland
Frances Ruane
357 An Estimate of the Value of Lost Load for Ireland
Eimear Leahy and Richard S.J. Tol
356 Public Policy Towards the Sale of State Assets in
Troubled Times: Lessons from the Irish Experience
Paul K Gorecki, Sean Lyons and Richard S. J. Tol
355 The Impact of Ireland’s Recession on the Labour Market
Outcomes of its Immigrants
Alan Barrett and Elish Kelly
354 Research and Policy Making
Frances Ruane
353 Market Regulation and Competition; Law in Conflict: A
View from Ireland, Implications of the Panda Judgment Philip Andrews and Paul K Gorecki
352 Designing a property tax without property values:
Analysis in the case of Ireland
Karen Mayor, Seán Lyons and Richard S.J. Tol
351 Civil War, Climate Change and Development: A Scenario
Study for Sub-Saharan Africa
Conor Devitt and Richard S.J. Tol
350 Regulating Knowledge Monopolies: The Case of the IPCC
Richard S.J. Tol
349 The Impact of Tax Reform on New Car Purchases in
Ireland
Hugh Hennessy and Richard S.J. Tol
348 Climate Policy under Fat-Tailed Risk:
An Application of FUND
David Anthoff and Richard S.J. Tol
347 Corporate Expenditure on Environmental Protection
Stefanie A. Haller and Liam Murphy
346 Female Labour Supply and Divorce: New Evidence from
Ireland
18
Berkay Özcan
345 A Statistical Profiling Model of Long-Term Unemployment
Risk in Ireland
Philip J. O’Connell, Seamus McGuinness, Elish Kelly
344 The Economic Crisis, Public Sector Pay, and the Income
Distribution
Tim Callan, Brian Nolan (UCD) and John Walsh
343 Estimating the Impact of Access Conditions on
Service Quality in Post
Gregory Swinand, Conor O’Toole and Seán Lyons
342 The Impact of Climate Policy on Private Car Ownership in
Ireland
Hugh Hennessy and Richard S.J. Tol
341 National Determinants of Vegetarianism
Eimear Leahy, Seán Lyons and Richard S.J. Tol
340 An Estimate of the Number of Vegetarians in the World
Eimear Leahy, Seán Lyons and Richard S.J. Tol
339 International Migration in Ireland, 2009
Philip J O’Connell and Corona Joyce
338 The Euro Through the Looking-Glass:
Perceived Inflation Following the 2002 Currency Changeover
Pete Lunn and David Duffy
337 Returning to the Question of a Wage Premium for
Returning Migrants
Alan Barrett and Jean Goggin
2009 336 What Determines the Location Choice of Multinational
Firms in the ICT Sector?
Iulia Siedschlag, Xiaoheng Zhang, Donal Smith
335 Cost-benefit analysis of the introduction of weight-based
charges for domestic waste – West Cork’s experience
Sue Scott and Dorothy Watson
334 The Likely Economic Impact of Increasing Investment in
Wind on the Island of Ireland
Conor Devitt, Seán Diffney, John Fitz Gerald, Seán Lyons
and Laura Malaguzzi Valeri
333 Estimating Historical Landfill Quantities to Predict
Methane Emissions
19
332 International Climate Policy and Regional Welfare
Weights
Daiju Narita, Richard S. J. Tol, and David Anthoff
331 A Hedonic Analysis of the Value of Parks and
Green Spaces in the Dublin Area
Karen Mayor, Seán Lyons, David Duffy and Richard S.J.
Tol
330 Measuring International Technology Spillovers and
Progress Towards the European Research Area
Iulia Siedschlag
329 Climate Policy and Corporate Behaviour
Nicola Commins, Seán Lyons, Marc Schiffbauer,and
Richard S.J. Tol
328 The Association Between Income Inequality and Mental
Health: Social Cohesion or Social Infrastructure
Richard Layte and Bertrand Maître
327 A Computational Theory of Exchange:
Willingness to pay, willingness to accept and the endowment effect
Pete Lunn and Mary Lunn
326 Fiscal Policy for Recovery
John Fitz Gerald
325 The EU 20/20/2020 Targets: An Overview of the EMF22
Assessment
Christoph Böhringer, Thomas F. Rutherford, and Richard S.J. Tol
324 Counting Only the Hits? The Risk of Underestimating the
Costs of Stringent Climate Policy Massimo Tavoni, Richard S.J. Tol
323 International Cooperation on Climate Change Adaptation
from an Economic Perspective
Kelly C. de Bruin, Rob B. Dellink and Richard S.J. Tol
322 What Role for Property Taxes in Ireland?
T. Callan, C. Keane and J.R. Walsh
321 The Public-Private Sector Pay Gap in Ireland: What Lies
Beneath?
Elish Kelly, Seamus McGuinness, Philip O’Connell
320 A Code of Practice for Grocery Goods Undertakings and
20
Do a Little Good
Paul K Gorecki
319 Negative Equity in the Irish Housing Market
David Duffy
318 Estimating the Impact of Immigration on Wages in
Ireland
Alan Barrett, Adele Bergin and Elish Kelly
317 Assessing the Impact of Wage Bargaining and Worker
Preferences on the Gender Pay Gap in Ireland Using the National Employment Survey 2003
Seamus McGuinness, Elish Kelly, Philip O’Connell, Tim Callan
316 Mismatch in the Graduate Labour Market Among
Immigrants and Second-Generation Ethnic Minority Groups
Delma Byrne and Seamus McGuinness
315 Managing Housing Bubbles in Regional Economies under
EMU: Ireland and Spain
Thomas Conefrey and John Fitz Gerald
314 Job Mismatches and Labour Market Outcomes
Kostas Mavromaras, Seamus McGuinness, Nigel O’Leary, Peter Sloane and Yin King Fok
313 Immigrants and Employer-provided Training
Alan Barrett, Séamus McGuinness, Martin O’Brien
and Philip O’Connell
312 Did the Celtic Tiger Decrease Socio-Economic
Differentials in Perinatal Mortality in Ireland?
Richard Layte and Barbara Clyne
311 Exploring International Differences in Rates of Return to
Education: Evidence from EU SILC
Maria A. Davia, Seamus McGuinness and Philip, J. O’Connell
310 Car Ownership and Mode of Transport to Work in Ireland
Nicola Commins and Anne Nolan
309 Recent Trends in the Caesarean Section Rate in Ireland
1999-2006
Aoife Brick and Richard Layte
308 Price Inflation and Income Distribution
21
307 Overskilling Dynamics and Education Pathways
Kostas Mavromaras, Seamus McGuinness, Yin King Fok
306 What Determines the Attractiveness of the European
Union to the Location of R&D Multinational Firms?
Iulia Siedschlag, Donal Smith, Camelia Turcu, Xiaoheng Zhang
305 Do Foreign Mergers and Acquisitions Boost Firm
Productivity?
Marc Schiffbauer, Iulia Siedschlag, Frances Ruane
304 Inclusion or Diversion in Higher Education in the
Republic of Ireland?
Delma Byrne
303 Welfare Regime and Social Class Variation in Poverty and
Economic Vulnerability in Europe: An Analysis of EU-SILC Christopher T. Whelan and Bertrand Maître
302 Understanding the Socio-Economic Distribution and
Consequences of Patterns of Multiple Deprivation: An Application of Self-Organising Maps
Christopher T. Whelan, Mario Lucchini, Maurizio Pisati
and Bertrand Maître
301 Estimating the Impact of Metro North
Edgar Morgenroth
300 Explaining Structural Change in Cardiovascular Mortality
in Ireland 1995-2005: A Time Series Analysis
Richard Layte, Sinead O’Hara and Kathleen Bennett
299 EU Climate Change Policy 2013-2020: Using the Clean
Development Mechanism More Effectively
Paul K Gorecki, Seán Lyons and Richard S.J. Tol
298 Irish Public Capital Spending in a Recession
Edgar Morgenroth
297 Exporting and Ownership Contributions to Irish
Manufacturing Productivity Growth Anne Marie Gleeson, Frances Ruane
296 Eligibility for Free Primary Care and Avoidable
Hospitalisations in Ireland
Anne Nolan
295 Managing Household Waste in Ireland:
Behavioural Parameters and Policy Options
22
294 Labour Market Mismatch Among UK Graduates;
An Analysis Using REFLEX Data
Seamus McGuinness and Peter J. Sloane
293 Towards Regional Environmental Accounts for Ireland
Richard S.J. Tol , Nicola Commins, Niamh Crilly, Sean
Lyons and Edgar Morgenroth
292 EU Climate Change Policy 2013-2020: Thoughts on
Property Rights and Market Choices
Paul K. Gorecki, Sean Lyons and Richard S.J. Tol
291 Measuring House Price Change
David Duffy
290 Intra-and Extra-Union Flexibility in Meeting the European
Union’s Emission Reduction Targets
Richard S.J. Tol
289 The Determinants and Effects of Training at Work:
Bringing the Workplace Back In
Philip J. O’Connell and Delma Byrne
288 Climate Feedbacks on the Terrestrial Biosphere and the
Economics of Climate Policy: An Application of FUND Richard S.J. Tol
287 The Behaviour of the Irish Economy: Insights from the
HERMES macro-economic model
Adele Bergin, Thomas Conefrey, John FitzGerald and Ide
Kearney
286 Mapping Patterns of Multiple Deprivation Using
Self-Organising Maps: An Application to EU-SILC Data for Ireland
Maurizio Pisati, Christopher T. Whelan, Mario Lucchini
and Bertrand Maître
285 The Feasibility of Low Concentration Targets:
An Application of FUND
Richard S.J. Tol
284 Policy Options to Reduce Ireland’s GHG Emissions
Instrument choice: the pros and cons of alternative policy instruments
Thomas Legge and Sue Scott
283 Accounting for Taste: An Examination of Socioeconomic
Gradients in Attendance at Arts Events
Pete Lunn and Elish Kelly
23
Reefs
Luke M. Brander, Katrin Rehdanz, Richard S.J. Tol, and Pieter J.H. van Beukering
281 Assessing the impact of biodiversity on tourism flows: A
model for tourist behaviour and its policy implications Giulia Macagno, Maria Loureiro, Paulo A.L.D. Nunes and
Richard S.J. Tol
280 Advertising to boost energy efficiency: the Power of One
campaign and natural gas consumption
Seán Diffney, Seán Lyons and Laura Malaguzzi Valeri
279 International Transmission of Business Cycles Between
Ireland and its Trading Partners
Jean Goggin and Iulia Siedschlag
278 Optimal Global Dynamic Carbon Taxation
David Anthoff
277 Energy Use and Appliance Ownership in Ireland
Eimear Leahy and Seán Lyons
276 Discounting for Climate Change
David Anthoff, Richard S.J. Tol and Gary W. Yohe
275 Projecting the Future Numbers of Migrant Workers in the
Health and Social Care Sectors in Ireland
Alan Barrett and Anna Rust
274 Economic Costs of Extratropical Storms under Climate
Change: An application of FUND
Daiju Narita, Richard S.J. Tol, David Anthoff
273 The Macro-Economic Impact of Changing the Rate of
Corporation Tax
Thomas Conefrey and John D. Fitz Gerald
272 The Games We Used to Play
An Application of Survival Analysis to the Sporting Life-course
Pete Lunn 2008
271 Exploring the Economic Geography of Ireland
Edgar Morgenroth
270 Benchmarking, Social Partnership and Higher
Remuneration: Wage Settling Institutions and the Public-Private Sector Wage Gap in Ireland
24
269 A Dynamic Analysis of Household Car Ownership in
Ireland
Anne Nolan
268 The Determinants of Mode of Transport to Work in the
Greater Dublin Area
Nicola Commins and Anne Nolan
267 Resonances from Economic Development for Current
Economic Policymaking
Frances Ruane
266 The Impact of Wage Bargaining Regime on Firm-Level
Competitiveness and Wage Inequality: The Case of Ireland
Seamus McGuinness, Elish Kelly and Philip O’Connell
265 Poverty in Ireland in Comparative European Perspective
Christopher T. Whelan and Bertrand Maître
264 A Hedonic Analysis of the Value of Rail Transport in the
Greater Dublin Area
Karen Mayor, Seán Lyons, David Duffy and Richard S.J.
Tol
263 Comparing Poverty Indicators in an Enlarged EU
Christopher T. Whelan and Bertrand Maître
262 Fuel Poverty in Ireland: Extent,
Affected Groups and Policy Issues
Sue Scott, Seán Lyons, Claire Keane, Donal McCarthy
and Richard S.J. Tol
261 The Misperception of Inflation by Irish Consumers
David Duffy and Pete Lunn
260 The Direct Impact of Climate Change on Regional Labour
Productivity
Tord Kjellstrom, R Sari Kovats, Simon J. Lloyd, Tom Holt,
Richard S.J. Tol
259 Damage Costs of Climate Change through Intensification
of Tropical Cyclone Activities: An Application of FUND
Daiju Narita, Richard S. J. Tol and David Anthoff
258 Are Over-educated People Insiders or Outsiders?
A Case of Job Search Methods and Over-education in UK Aleksander Kucel, Delma Byrne
257 Metrics for Aggregating the Climate Effect of Different
25
Richard S.J. Tol, Terje K. Berntsen, Brian C. O’Neill, Jan
S. Fuglestvedt, Keith P. Shine, Yves Balkanski and Laszlo Makra
256 Intra-Union Flexibility of Non-ETS Emission Reduction
Obligations in the European Union
Richard S.J. Tol
255 The Economic Impact of Climate Change
Richard S.J. Tol
254 Measuring International Inequity Aversion
Richard S.J. Tol
253 Using a Census to Assess the Reliability of a National
Household Survey for Migration Research: The Case of Ireland
Alan Barrett and Elish Kelly
252 Risk Aversion, Time Preference, and the Social Cost of
Carbon
David Anthoff, Richard S.J. Tol andGary W. Yohe
251 The Impact of a Carbon Tax on Economic Growth and
Carbon Dioxide Emissions in Ireland
Thomas Conefrey, John D. Fitz Gerald, Laura Malaguzzi
Valeri and Richard S.J. Tol
250 The Distributional Implications of a Carbon Tax in
Ireland
Tim Callan, Sean Lyons, Susan Scott, Richard S.J. Tol
and Stefano Verde
249 Measuring Material Deprivation in the Enlarged EU
Christopher T. Whelan, Brian Nolan and Bertrand Maître
248 Marginal Abatement Costs on Carbon-Dioxide Emissions:
A Meta-Analysis
Onno Kuik, Luke Brander and Richard S.J. Tol
247 Incorporating GHG Emission Costs in the Economic
Appraisal of Projects Supported by State Development Agencies
Richard S.J. Tol and Seán Lyons
246 A Carton Tax for Ireland
Richard S.J. Tol, Tim Callan, Thomas Conefrey, John D.
Fitz Gerald, Seán Lyons, Laura Malaguzzi Valeri and
Susan Scott
245 Non-cash Benefits and the Distribution of Economic
26
Tim Callan and Claire Keane
244 Scenarios of Carbon Dioxide Emissions from Aviation
Karen Mayor and Richard S.J. Tol
243 The Effect of the Euro on Export Patterns: Empirical
Evidence from Industry Data
Gavin Murphy and Iulia Siedschlag
242 The Economic Returns to Field of Study and
Competencies Among Higher Education Graduates in Ireland
Elish Kelly, Philip O’Connell and Emer Smyth
241 European Climate Policy and Aviation Emissions
Karen Mayor and Richard S.J. Tol
240 Aviation and the Environment in the Context of the
EU-US Open Skies Agreement
Karen Mayor and Richard S.J. Tol
239 Yuppie Kvetch? Work-life Conflict and Social Class in
Western Europe
Frances McGinnity and Emma Calvert
238 Immigrants and Welfare Programmes: Exploring the
Interactions between Immigrant Characteristics, Immigrant Welfare Dependence and Welfare Policy
Alan Barrett and Yvonne McCarthy
237 How Local is Hospital Treatment? An Exploratory
Analysis of Public/Private Variation in Location of Treatment in Irish Acute Public Hospitals
Jacqueline O’Reilly and Miriam M. Wiley
236 The Immigrant Earnings Disadvantage Across the
Earnings and Skills Distributions: The Case of
Immigrants from the EU’s New Member States in Ireland
Alan Barrett, Seamus McGuinness and Martin O’Brien
235 Europeanisation of Inequality and European Reference
Groups
Christopher T. Whelan and Bertrand Maître
234 Managing Capital Flows: Experiences from Central and
Eastern Europe
Jürgen von Hagen and Iulia Siedschlag
233 ICT Diffusion, Innovation Systems, Globalisation and
Regional Economic Dynamics: Theory and Empirical Evidence
27
Siedschlag, Robert Owen and Gavin Murphy
232 Welfare and Competition Effects of Electricity
Interconnection between Great Britain and Ireland
Laura Malaguzzi Valeri
231 Is FDI into China Crowding Out the FDI into the
European Union?
Laura Resmini and Iulia Siedschlag
230 Estimating the Economic Cost of Disability in Ireland
John Cullinan, Brenda Gannon and Seán Lyons
229 Controlling the Cost of Controlling the Climate: The Irish
Government’s Climate Change Strategy Colm McCarthy, Sue Scott
228 The Impact of Climate Change on the
Balanced-Growth-Equivalent: An Application of FUND
David Anthoff, Richard S.J. Tol
227 Changing Returns to Education During a Boom? The
Case of Ireland
Seamus McGuinness, Frances McGinnity, Philip O’Connell
226 ‘New’ and ‘Old’ Social Risks: Life Cycle and Social Class
Perspectives on Social Exclusion in Ireland
Christopher T. Whelan and Bertrand Maître
225 The Climate Preferences of Irish Tourists by Purpose of
Travel
Seán Lyons, Karen Mayor and Richard S.J. Tol
224 A Hirsch Measure for the Quality of Research
Supervision, and an Illustration with Trade Economists
Frances P. Ruane and Richard S.J. Tol
223 Environmental Accounts for the Republic of Ireland:
1990-2005
Seán Lyons, Karen Mayor and Richard S.J. Tol
2007 222 Assessing Vulnerability of Selected Sectors under
Environmental Tax Reform: The issue of pricing power
J. Fitz Gerald, M. Keeney and S. Scott
221 Climate Policy Versus Development Aid
Richard S.J. Tol
220 Exports and Productivity – Comparable Evidence for 14
28
The International Study Group on Exports and Productivity
219 Energy-Using Appliances and Energy-Saving Features:
Determinants of Ownership in Ireland
Joe O’Doherty, Seán Lyons and Richard S.J. Tol
218 The Public/Private Mix in Irish Acute Public Hospitals:
Trends and Implications
Jacqueline O’Reilly and Miriam M. Wiley
217 Regret About the Timing of First Sexual Intercourse: The
Role of Age and Context
Richard Layte, Hannah McGee
216 Determinants of Water Connection Type and Ownership
of Water-Using Appliances in Ireland
Joe O’Doherty, Seán Lyons and Richard S.J. Tol
215 Unemployment – Stage or Stigma?
Being Unemployed During an Economic Boom
Emer Smyth
214 The Value of Lost Load
Richard S.J. Tol
213 Adolescents’ Educational Attainment and School
Experiences in Contemporary Ireland
Merike Darmody, Selina McCoy, Emer Smyth
212 Acting Up or Opting Out? Truancy in Irish Secondary
Schools
Merike Darmody, Emer Smyth and Selina McCoy
211 Where do MNEs Expand Production: Location Choices of
the Pharmaceutical Industry in Europe after 1992
Frances P. Ruane, Xiaoheng Zhang
210 Holiday Destinations: Understanding the Travel Choices
of Irish Tourists
Seán Lyons, Karen Mayor and Richard S.J. Tol
209 The Effectiveness of Competition Policy and the
Price-Cost Margin: Evidence from Panel Data
Patrick McCloughan, Seán Lyons and William Batt
208 Tax Structure and Female Labour Market Participation:
Evidence from Ireland