The role of vitamin D in metabolism and bone health : a thesis presented in partial fulfillment of the requirements for the degree of Doctor of Philosophy in Nutritional Science at Massey University, Albany, New Zealand
213
0
0
Full text
(2) The role of vitamin D in metabolism and bone health. A thesis presented in partial fulfillment of the requirements for the degree of Doctor of Philosophy in Nutritional Science at Massey University, Albany New Zealand. Pamela Ruth von Hurst 2009.
(3) Abstract Background Hypovitaminosis D is becoming recognised as an emerging threat to health, even in countries like New Zealand which enjoy plentiful sunshine. The evidence for a role for vitamin D deficiency in the aetiology of a plethora of diseases continues to accumulate, including type 2 diabetes, and the preceding insulin resistance.. Objectives The primary objective of the Surya Study was to investigate the effect of improved vitamin D status (through supplementation) on insulin resistance. The secondary objectives were to investigate the vitamin D status and bone mineral density of South Asian women living in New Zealand, and to investigate the effect of vitamin D supplementation on bone turnover as measured by biochemical markers of bone resorption and formation.. Method Women of South Asian origin, ≥20 years old, living in Auckland (n = 235) were recruited for the study. All were asked to complete a 4-day food diary, invited to have a bone scan, and were screened for entry into the intervention phase which required insulin resistance (HOMA-IR >1.93) and serum 25(OH)D < 50 nmol/L. Eighty-one completed a 6-month randomised controlled trial with 4000 IU vitamin D3 (n = 42) or placebo (n = 39). Primary endpoint measures included insulin resistance, insulin sensitivity (HOMA2%S), fasting C-peptide and markers of bone turnover, osteocalcin (OC) and collagen C-telopeptide (CTX). Ninety-one of the 239 had a bone scan and bone mineral density (BMD) was measured in the proximal femur and lumbar spine.. Results Adequate serum 25(OH)D concentrations (>50 nmol/L) were observed in only 16% of subjects screened. Median (25th, 75th percentile) serum 25(OH)D increased significantly from 21 (11,40) to 75 (55,84) nmol/L with supplementation. Significant improvements were seen in insulin sensitivity and insulin resistance (P = 0·003, P = 0·02 respectively), and circulating serum insulin decreased (P = 0·02) with supplementation compared to placebo. There was no change in C-peptide with supplementation. Insulin resistance was most improved when endpoint serum. ii.
(4) 25(OH)D ≥80 nmol/L. In post-menopausal women OC and CTX levels increased in the placebo arm but CTX decreased from 0.39±0.15 to 0.36±0.17 (P = 0.012) with supplementation.. Osteoporosis. (T. score. <-2.5). was. present. in. 32%. of. postmenopausal, and 3% of premenopausal women. Women 20 – 29 years (n=10) had very low BMD, calcium intake and serum 25(OH)D. Conclusions Improving vitamin D status in insulin resistant women resulted in improved insulin resistance and sensitivity but no change in insulin secretion. Optimal 25(OH)D concentrations for reducing insulin resistance were shown to be ≥80 nmol/L. The prevalence of low 25(OH)D concentrations in this population was alarmingly high, especially. in. younger. women.. In. post-menopausal. women,. vitamin. D. supplementation appeared to ameliorate increased bone turnover attributed to oestrogen deficiency.. iii.
(5) Acknowledgements. They say that no man is an island, and never is that saying more applicable than to any woman (or man) pursuing a PhD. I have received so much physical, emotional and moral support whilst making this journey that mere words of thanks seem inadequate, but are at least a token of my appreciation. Firstly I would like to thank my wonderful family: my ever-supportive husband, Dr Eric von Hurst who has cooked, cleaned, listened to rambling tirades and made sure that every triumph, no matter how small, was celebrated. My Mum, Margaret Jones and my Aunt, Joan Williams, who came to Mount Roskill every Saturday morning and made breakfast for participants, or made the first run back to the lab with the blood samples – I couldn’t have done it without them. I will be eternally grateful to my supervision team for guiding me through this process: Associate Professor Jane Coad, supervisor extraordinaire, who went along with my research idea, sat up with me till all hours of the night writing funding applications, and then had the faith in me to get the job done; My co-supervisors Professor Marlena Kruger and Associate Professor Welma Stonehouse for being such great exemplars of academic excellence and never losing their sense of humour. I am also very grateful for the support of the Nutrition Team at Massey University’s Albany campus – working with such great people makes every task just a little bit easier. A big thank you to the women of the Auckland South Asian community for their participation, encouragement and enthusiasm for the study. Also to Dr R Sood and staff of the Mount Roskill Medical Centre who so generously provided us with clinical space on Saturday mornings for nearly a year. Thanks to Blackmores Pty Ltd, Australia, who supplied the vitamin D supplement and the placebo at no cost, and to Philip Duffy and Chris Oliver from Blackmores for having faith in the project, and for providing such undemanding support. The Surya Study was made possible by the New Zealand Lottery Board (Lottery Health Grant), New Zealand Department of Internal Affairs.. iv.
(6) Table of contents Abstract. .............................................................................................................. i. Acknowledgements ..................................................................................................iii Table of contents ...................................................................................................... v List of tables ............................................................................................................ vi List of figures ...........................................................................................................vii Abbreviations..........................................................................................................viii Chapter 1. Introduction and justification for study.................................................. 1 Study objectives................................................................................... 5. Chapter 2. Review of the Literature ....................................................................... 9 Vitamin D ........................................................................................... 10 Insulin resistance and type 2 diabetes............................................... 17 Hypovitaminosis D and type 2 diabetes............................................. 33 Vitamin D and bone ........................................................................... 44 The South Asian population in New Zealand..................................... 59 References ........................................................................................ 64. Chapter 3. Study Protocol ................................................................................... 83. Chapter 4. Vitamin D status and attitudes towards sun exposure ..................... 100. Chapter 5. Vitamin D supplementation and insulin resistance .......................... 114. Chapter 6. Vitamin D supplementation and markers of bone turnover.............. 133. Chapter 7. Bone density, calcium intake and vitamin D status.......................... 148. Chapter 8. Discussion ....................................................................................... 165 Conclusions ..................................................................................... 171 Recommendations for future research............................................. 172. Appendices Papers (published or submitted) ...................................................... 175 Conference presentations................................................................ 176 Participants’ information sheet......................................................... 177 Medical History questionnaire.......................................................... 182 Osteoporosis knowledge and sun exposure questionnaire ............. 185. v.
(7) List of tables Chapter 2 1 2 3 4 5 6 7 8 9. Vitamin D content of food sources in the New Zealand diet ....................14 Examples of supplemental forms of vitamin D 3 in New Zealand .............14 Criteria for diagnosis of diabetes .............................................................24 Rate of progression from prediabetes to diabetes...................................25 Stages of glycaemic status ......................................................................26 The 2005 IDF definition of the metabolic syndrome ................................30 Vitamin D intervention studies with metabolic disease outcomes ...........37 Biochemical markers of bone turnover ....................................................56 Studies of bone health in South Asian people .........................................62. Chapter 3 1 Outcome measures and testing methods - screening phase ..................91 2 Outcome measures and testing methods - phase 2 (intervention) ..........92. Chapter 4 1 Sun exposure attitudes and behaviours ................................................107 2 Health motivation questionnaire results.................................................107. Chapter 5 1 Baseline characteristics of trial participants...........................................121 2 Changes from baseline to endpoint in primary outcome measures.......122 3 Changes from baseline to endpoint in secondary outcome measures ..123. Chapter 6 1 Correlations between serum 25(OH)D, PTH and serum calcium ..........139 2 Change in serum 25(OH)D, PTH and bone markers .............................140. Chapter 7 1 Characteristics of participants................................................................153 2 Bone scan results by menopausal status ..............................................154 3 Characteristics of 20 -29 year olds ........................................................155. vi.
(8) List of figures Chapter 2 1 Vitamin D structure ..................................................................................11 2 Metabolic activation of vitamin D .............................................................12 3 Glucose homeostasis ..............................................................................17 4 Insulin receptor and downstream signalling proteins ...............................18 5 Glucose stimulated insulin secretion .......................................................20 6 Responses to oral glucose tolerance test................................................27 7 Genetic predisposition for -cell dysfunction ...........................................31 8 Calcium absorption vs serum 25(OH)D concentrations...........................45 9 Transcellular transport of calcium............................................................46 10 Bone remodelling cycle............................................................................48 11 Overview of calcium homeostasis ...........................................................49 12 Role of calcitriol and PTH in bone resorption ..........................................51 13 Rickets in children....................................................................................53. Chapter 3 1 Study design flow chart............................................................................89. Chapter 4 1 Levels of vitamin D deficiency and adequacy........................................106. Chapter 5 1 Participant status through duration of study ..........................................120 2 Change in HOMA%2S in total study population ....................................124 3 Serum 25(OH)D and HOMA2%S relationship .......................................124. vii.
(9) Abbreviations 1OHase. 1a-hydroxylase. 1,25(OH) 2 D 3. 1,25-dihydroxyvitamin D 3 or calcitriol. 24OHase. 24-hydroxylase. 25(OH)D 3. 25-hydroxyvitamin D 3. 25OHase. 25-hydroxylase. ALP. Alkaline phosphatase. ATP. Adult Treatment Panel. BMD. Bone mineral density. BMI. Body mass index. BTM. Bone turnover markers. CaSR. Calcium sensing receptors. CMDHB. Counties Manukau District Health Board. CRP. C-reactive protein. CTX. Cross-linked telopeptide. CVD. Cardiovascular disease. DBP. Vitamin D-binding protein. DXA. Dual energy x-ray absorptiometry. EDTA. Ethylene diamine tetraacetic acid. ER. Endoplasmic reticulum. FPG. Fasting plasma glucose. FPI. Fasting plasma insulin. HDL. High-density lipoprotein. HGO. Hepatic Glucose Output. HOMA. Homeostasis assessment model. HOMA2-IR. HOMA2-Insulin Resistance. IDF. International Diabetes Institute. IFG. Impaired fasting glucose. IGT. Impaired glucose tolerance. IL-6. Interleukin 6. IR. Insulin receptor. IRS-proteins. Insulin receptor substrate proteins. IVGTT. Intra-venous glucose tolerance test. viii.
(10) K ATP. Potassium channels. KO. Knock out. MED. Minimal erythemal dose. MoH. Ministry of Health. NCEP. National Cholesterol Education Programme. NCX-1. Na+/Ca2+ exchanger. NEFAs. Non-esterified fatty acids. NGT. Normal glucose tolerance. NHANES. National health and Nutrition Examination Survey. NIDDM. Non-insulin dependant diabetes. OC. Osteocalcin. OGIS. Oral glucose insulin sensitivity. OGTT. Oral glucose tolerance test. OPG. Osteoprotegerin. PI3-kinase. Phosphatidylinositol 3-kinase. PICP. Procollagen type 1 C-terminal. PMCA. Plasma membrane calcium ATPase. PTH. Parathyroid hormone. PTHR. PTH receptor. PTHrP. PTH related protein. RANK. Receptor activator nuclear factor-B. RANKL. Receptor activator nuclear factor-B ligand. RCT. Randomised controlled trial. RDI. Recommended daily intake. RXR. Retinoid X receptor. TNF. Tumour necrosis factor. TRP. Transient receptor potential. UV. Ultraviolet. UVB. Ultraviolet beta radiation. UVR. Ultraviolet radiation. VDR. Vitamin D receptor. VDRE. Vitamin D response element. WHO. World Health Organization. ix.
(11) CHAPTER 1. Introduction Justification for study Study objectives. 1.
(12) Introduction. The sun is the source of life on Earth. It provides us with heat, light, and food via photosynthesis of energy in plants. It is also the source of vitamin D, an essential hormone, the production of which begins when ultra violet- radiation from the sun penetrates our skin. The migration of early man from the equatorial regions of his origin to the cooler climes of Northern Europe resulted in the devolution of melanin, the dark pigment in the skin which acts as a natural sunscreen. Those with lighter skin were better able to synthesise vitamin D in conditions of lower ultraviolet radiation (UVR), thus avoiding the pelvic deformities associated with vitamin D deficiency and the subsequent poor birth outcomes (Jablonski et al. 2000; Hollis 2005). Meanwhile, the high concentration of melanin in the dark skin of humans at low latitudes provided protection against the strong UVR in that environment. This reduced the risk of cutaneous damage and prevented the photo-degradation of important micronutrients such as folate, low levels of which are implicated in neural tube defects (Jablonski et al. 2000). In recent centuries, as mankind has become more transient, these well-tuned evolutionary adjustments have become less advantageous. The slave trade initiated the relocation of dark-skinned Africans from an environment of high UVR, warm temperatures and few clothes to the higher latitudes of North America with lower UVR, cooler temperatures and a requirement for modesty of dress. Now black Americans are exhibiting serum 25(OH)D levels 40 – 50% lower than their white countrymen in both winter and summer (Harris et al. 1998; Bodnar et al. 2007). Meanwhile, recent immigration from Sub-Saharan Africa and the Middle East is resulting in populations of people with very dark skins or covering for religious reasons in Europe (Carling 2007), Britain and Australia (Pettifor 2008). It has been estimated that to achieve optimum vitamin D levels through sun exposure, a deeplypigmented African can take up to 10 times longer than a Caucasian (Hollis 2005). European colonialism began a continuing trend of fair-skinned families from Britain and northern Europe immigrating to southern hemisphere countries such as New. 2.
(13) Zealand and Australia. Their fair skin has little in-built protection from the high summer UVR and now these two countries have the highest rates of skin cancer in the world (Salmon et al. 2007). Nearly 100 years ago Australian dermatologist Norman Paul noted that, “the common occurrence of these cancerous diseases . . . is to be regarded as one of the penalties to be paid for inhabiting a country normally destined (in geographical location) to be occupied by a coloured race” (Albert et al. 2002). The modern response has been the development, over the past 2 decades, of public education campaigns which advocate avoidance of sun exposure altogether (Albert et al. 2003). As the public pays more attention to these messages, so the potential for population-wide hypovitaminosis D increases. Concurrent with the increasing incidence of hypovitaminosis D has been an exponential growth in our knowledge of the importance of vitamin D in many aspects of health including its traditional role in bone health. Recent research has shown relationships between vitamin D status and cancer (Grant 2002), auto-immune diseases including type 1 diabetes (Harris 2005), cardiovascular disease (Wang et al. 2008) and type 2 diabetes (Scragg et al. 1995b). In New Zealand the Maori and Pacific people with their light to medium brown skin are exhibiting a greater incidence of vitamin D deficiency than the Caucasian population (Rockell et al. 2006), and the rapidly expanding populations of migrants from Asia and the Indian subcontinent (Statistics New Zealand 2006) are also likely to be at risk due in part to their skin colour, and also to sun-avoidance behaviours. To date there is no evidence of this, apart from anecdotal descriptions from Indian General Practitioners in Auckland of vitamin D deficiency in their patients and an over-representation of South Asian children being diagnosed with rickets (Blok et al. 2000). In 2006 the New Zealand Ministry of Health (MoH) published a study reporting the health status of Asian and South Asian people living in New Zealand (Ministry of Health 2006). The incidence of type 2 diabetes and cardiovascular disease in South Asian Indians was markedly higher (3 times and 2 times respectively) than the general population. Nine percent of South Asian people who were surveyed reported having been diagnosed with type 2 diabetes. The MoH predicts that only half of the total number of cases of type 2 diabetes in the New Zealand population. 3.
(14) have been diagnosed (Ministry of Health 2009). If this is true, it is possible that 18% of the South Asian adult population in New Zealand has the disease. Since the identification of the vitamin D receptor in chick pancreatic tissue (Christakos et al. 1979 ) and subsequently in human pancreatic -cells (Johnson et al. 1994), the role of vitamin D in the development of type 2 diabetes has stimulated scientific interest. One of the earlier studies to find a relationship between glucose intolerance and vitamin D deficiency was conducted in South Asian populations in Britain (Boucher et al. 1995). Meanwhile, in New Zealand, Scragg et al (1995b) found that cases of newly diagnosed type 2 diabetes and impaired glucose tolerance had significantly lower serum 25(OH)D than matched controls. Subsequently evidence has continued to accumulate and is discussed in greater depth in the following chapter. Immigration from the Indian sub-continent and Sri Lanka almost doubled between the 2001 and 2006 censuses, and numbered 113,000 in 2006. Unless there is a major change in New Zealand’s immigration policy in the near future, the number of New Zealand residents of South Asian origin will probably continue to increase at a similar rate to that which we have seen over the past 5 years. These new residents are already demonstrating a tendency toward health problems which are going to impose high costs on the New Zealand health budget. Sufficient evidence now exists to justify investigations into both the vitamin D status of this group, and the possibility that poor vitamin D status is increasing the risk of diseases to which they are already genetically predisposed. If an improvement in vitamin D status can be shown to ameliorate the risk of diabetes, cardiovascular disease or osteoporosis in this population, even to a small degree, it is important that this be investigated. When compared to the cost of treating diabetes or osteoporosis, supplementation with vitamin D is a very cost-effective prophylactic.. 4.
(15) Study objectives. The Surya Study commenced in Auckland, New Zealand in February 2007. The name, Surya, is the Sanskrit and Hindu name for the Sun Goddess. The primary objective of this study was to conduct a double-blind, randomised controlled trial (RCT) with vitamin D supplementation in South Asian women who are vitamin D deficient and insulin resistant. We aimed to assess the effect of improved vitamin D status on insulin resistance and other markers of metabolic syndrome which are associated with increased risk of type 2 diabetes and CVD. At the time of conception of this study, there had been no trials of this nature reported. Subsequently one RCT with supplemental vitamin D has been published. Coincidentally the subject group were Indian men, but they were not insulin resistant and vitamin D deficiency was not an inclusion criteria (Nagpal et al. 2009). Therefore, the Surya Study remains the first RCT with vitamin D supplementation in subjects who are insulin resistant and vitamin D deficient. Because vitamin D plays such an important role in bone health and the maintenance of bone mineral density, secondary objectives were developed to a) investigate the bone mineral density of the group of women recruited for the study, and b) to investigate the effect of vitamin D supplementation on markers for bone formation and resorption. To date only one other RCT has supplemented with vitamin D alone and measured bone markers – the subjects were 11 year-old girls. The screening phase of the study provided the opportunity to investigate the vitamin D status, as well as a number of other health and lifestyle factors, in a group of 235 South Asian women living in Auckland. This was the first descriptive study of this nature to be conducted in this relatively new migrant population and although participants were self-selected the study has provided some important insights.. 5.
(16) Primary Outcome . Changes in vitamin D status, insulin resistance (homeostasis model assessment), lipid profiles including total cholesterol, high-density lipoprotein (HDL) cholesterol and triglycerides, in response to vitamin D supplementation. Chapter 5.. Secondary outcomes . Investigation of the screening population including vitamin D status, lipid profiles, diet and physical activity, attitudes and behaviours around sun exposure. Chapter 4.. . Changes in markers of bone turnover (osteocalcin and c-telopeptide), parathyroid hormone and serum calcium in response to vitamin D supplementation. Chapter 6.. . Investigation of the bone mineral density (BMD) of the study population, together with vitamin D status and calcium intake as assessed by dietary analysis. Chapter 7.. Hypotheses Hypothesis 1:. That women of South Asian origin living in Auckland, New Zealand will have low vitamin D status. Hypothesis 2:. That supplemental vitamin D will improve the vitamin D status, and subsequently reduce insulin resistance, in women who are insulin resistant and have low vitamin D. Hypothesis 3:. That increasing serum 25(OH)D will reduce bone turnover and bone resorption, and increase bone formation in women who have low vitamin D status. 6.
(17) References Albert, M. R. and K. G. Ostheimer (2002). The evolution of current medical and popular attitudes toward ultraviolet light exposure: Part 1. Journal of the American Academy of Dermatology 47: 930-7. Albert, M. R. and K. G. Ostheimer (2003). The evolution of current medical and popular attitudes toward ultraviolet light exposure: Part 3. Journal of the American Academy of Dermatology 49: 1096-106. Blok, B. H., C. C. Grant, A. R. McNeil and I. R. Reid (2000). Characteristics of children with florid vitamin D deficient rickets in the Auckland region in 1998. New Zealand Medical Journal 113(1117): 374-6. Bodnar, L. M., H. N. Simhan, R. W. Powers, M. P. Frank, E. Cooperstein and J. M. Roberts (2007). High prevalence of vitamin D insufficiency in black and white pregnant women residing in the northern United States and their neonates. The Journal of Nutrition 137: 447-452. Boucher, B., N. Mannan, K. Noonan, C. Hales and S. Evans (1995). Glucose intolerance and impairment of insulin secretion in relation to vitamin D deficiency in East London Asians. Diabetologia 38: 1239–1245. Carling, J. (2007). Unauthorized Migration from Africa to Spain. International Migration 45(4): 3-37. Christakos, S., E. Friedlander, B. Frandsen and A. Norman (1979 ). Studies on the mode of action of calciferol. XIII. Development of a radioimmunoassay for vitamin Ddependent chick intestinal calcium-binding protein and tissue distribution. Endocrinology 104(5): 1495-503. Grant, W. B. (2002). An estimate of premature cancer mortality in the U.S. due to inadequate doses of solar ultraviolet-B radiation. Cancer 94(6): 1867-1875. Harris, S. and B. Dawson-Hughes (1998). Seasonal changes in plasma 25-hydroxyvitamin D concentrations of young American black and white women American Journal of Clinical Nutrition 67: 1232-1236. Harris, S. S. (2005). Vitamin D in Type 1 Diabetes Prevention. Journal of Nutrition 135: 323325. Hollis, B. W. (2005). Circulating 25-hydroxyvitamin D levels indicative of vitamin D sufficiency: Implications for establishing a new effective dietary intake recommendation for vitamin D. Journal of Nutrition 135: 332-337. Jablonski, N. G. and G. Chaplin (2000). The evolution of human skin coloration. Journal of Human Evolution 39: 57-106. Johnson, J., J. Grande, P. Roche and R. Kumar (1994). Immunohistochemical localization of the 1,25(OH)2D3 receptor and calbindin D28k in human and rat pancreas. American Journal of Physiology 267: E356 - E360. Ministry of Health. (2009). "Diabetes in New Zealand." Retrieved 30 May 2009, from www.moh.govt.nz/diabetes.. 7.
(18) Ministry of Health, N. Z. (2006). Asian Health Chart Book 2006 Public Health Intelligence: Monitoring Report No.4. Wellington, Ministry of Health: 47. Nagpal, J., J. N. Pande and A. Bhartia (2009). A double-blind, randomized, placebocontrolled trial of the short-term effect of vitamin D3 supplementation on insulin sensitivity in apparently healthy, middle-aged, centrally obese men. Diabetic Medicine 26(1): 19-27. Pettifor, J. M. (2008). Vitamin D and/or calcium deficiency rickets in infants and children: a global perspective. Indian Journal of Medical Research 127(3): 245-249. Rockell, J., C. Skeaff, S. Williams and T. Green (2006). Serum 25-hydroxyvitamin D concentrations of New Zealanders aged 15 years and older. Osteoporosis International 17: 1382-1389. Salmon, P. J., W. C. Chan, J. Griffin, R. McKenzie and M. Rademaker (2007). Extremely high levels of melanoma in Tauranga, New Zealand: Possible causes and comparisons with Australia and the Northern hemisphere. Australasian Journal of Dermatology 48: 208-216. Scragg, R., I. Holdaway, V. Singh, P. Metcalf, J. Baker and E. Dryson (1995b). Serum 25hydroxyvitamin D3 levels decreased in impaired glucose tolerance and diabetes mellitus. Diabetes Research and Clinical Practice 27: 181-188. Statistics New Zealand (2006). 2006 Census of population and dwellings - Asian people, New Zealand Government. Wang, T. J., M. J. Pencina, S. L. Booth, P. F. Jacques, E. Ingelsson, K. Lanier, E. J. Bengamin, R. B. DAgostino, M. Wolf and R. S. Vasan (2008). Vitamin D deficiency and risk of cardiovascular disease. Circulation 117(4): 503-11.. 8.
(19) CHAPTER 2. Review of the Literature. 9.
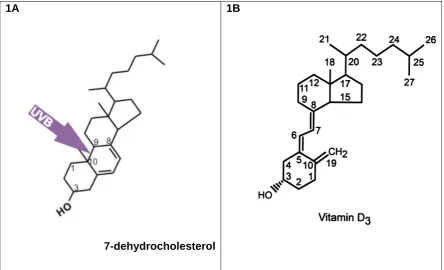
(20) Vitamin D. History of vitamin D We have known for over 100 years that sunlight is required for bone health. In 1822, Sniadecki hypothesised that the devastating childhood bone disease, rickets, was associated with deprivation of sunlight following observations that urban children in Warsaw developed the disease but children living in rural areas did not (Holick 2004). In the early 20th century, Sir Edward Mellanby cured rickets in dogs by giving them cod liver oil (Oxbury 1985). In 1919, Huldschinski demonstrated that exposing children to a mercury arc lamp for one hour 3 times a week was an effective treatment for rickets (Holick 2006 ). Around the same time, in New York, Hess and Unger (1922) exposed children and experimental rats with rickets to sunshine and demonstrated a cure. Eventually, vitamin D was isolated and identified as an essential micronutrient, but it was not until 1963 that the most biologically active metabolite of vitamin D, 1,25dihydroxyvitamin D 3 (calcitriol or 1,25(OH) 2 D 3 ) was discovered (Brown et al. 1999), and vitamin D was subsequently established as a secosteroid with the classic role of regulating bone metabolism and calcium homeostasis.. Metabolism of vitamin D Calcitriol is generated from sequential hydroxylations of vitamin D 3 (fig. 1B), a micronutrient which is synthesised when unprotected skin is exposed to sunlight (Holick et al. 1980). The ultraviolet- (UVB) radiation in sunlight penetrates the skin and causes the conversion of 7-dehydrocholesterol to pre-vitamin D (fig. 1A). The sterol 7-dehydrocholesterol is always present in the skin and is found throughout the layers of the epidermis and, to a lesser extent, in the dermis as well (Holick et al. 1980). Once formed, pre-vitamin D immediately begins to isomerise into vitamin D 3 in a temperature-dependent manner which can continue for up to three days following one exposure of UVB (Holick et al. 1980). The newly formed vitamin D 3 diffuses into the circulatory system and is bound to vitamin-D binding protein (DBP).. 10.
(21) 1B. 1A. 7-dehydrocholesterol Figure 1A: Ultra violet- radiation cleaves 7-dehydrocholesterol between carbon 9 and 10, forming previtamin D 3 . Heat-induced isomerisation occurs almost immediately, and vitamin D3 is formed. Figure 1B: The structure of vitamin D 3 and its numbering system (DeLuca 2004) The first hydroxylation takes place in the liver (fig. 2), catalysed by vitamin D-25hydroxylase, producing the major circulating form, 25-hydroxyvitamin D 3 (25(OH)D 3 ) (DeLuca 2004). The second hydroxylation was originally thought to take place only in the kidney. Here the activity of the second hydroxylase, renal 25(OH)D 3 -1hydroxylase (1OHase), is stimulated by parathyroid hormone (PTH) resulting in the production of the active metabolite 1,25(OH) 2 D 3 or calcitriol. Serum levels of calcitriol are controlled by a negative feedback system which reduces the expression of 1OHase, in response to high local levels of calcitriol. At the same time, the high calcitriol levels promote the expression of the hydroxylase enzyme 1,24-hydroxylase which is responsible for commencing the degradation of calcitriol. Thus the hormone has the intrinsic ability to programme its own destruction via a positive feedback loop which results in increased transcription of 1,24-hydroxylase, as well as a negative feedback system (Jones et al. 1998).. 11.
(22) Calcitriol is so tightly regulated that measurement of circulating calcitriol is not a good measure of vitamin D status. Rather 25(OH)D (includes 25(OH)D 3 and 25(OH)D 2 as most assays do not differentiate between the two) which is the major circulating form and is more subject to variability of sun exposure or dietary intake, is a better indicator of vitamin D status.. Figure 2: The metabolic activation of vitamin D 3 to the bioactive metabolite 1,25dihydroxyvitamin D 3 .or calcitriol involves the hydroxylation of carbon 25, then carbon 1 (see fig.1B for numbering) (adapted from DeLuca (2004)) Endogenous synthesis of pre-vitamin D and vitamin D 3 in response to UVB exposure does have in-built controls. There appears to be an equilibrium reaction in the conversion of pre-vitamin D to vitamin D 3 , allowing the skin to act as a storage facility for up to 3 days following exposure to sunlight (Holick et al. 1980). Excessive exposure to UVB radiation results in the conversion of pre-vitamin D to biologically inactive lumesterol or tachysterol, reducing the amount of vitamin D 3 produced (Hollis 2005), and excess sunlight also results in the photodegradation of vitamin D 3 into inert photoproducts (Holick 2007). Thus a number of mechanisms exist to ensure the prevention of 25(OH)D 3 toxicity as a result of sun exposure. It is well recognised that a number of variables are involved in determining the amount of vitamin D 3 that will be generated in human skin due to sun exposure. Skin pigmentation, age, season, latitude and protection from clothes or sun screen all play a role, making a determination of a level of required exposure very difficult. The concept of the minimal erythemal dose or MED is a useful guide (Clemens et al. 1982). This is the least amount of exposure required to cause an erythemal response (slight pinkening of the skin). A whole-body MED has been shown to. 12.
(23) release 10,000 to 20,000 IU of vitamin D 3 into the circulation within 24 hours of exposure, and circulating levels of 25(OH)D in people receiving unlimited sun exposure range from 165 nmol/L to 225 nmol/L (Hollis 2005). When considered in light of the above, the currently accepted level of adequacy in New Zealand of 50 nmol/L (Working Group of the Australian and New Zealand Bone and Mineral Society et al. 2005), and even the 75-80 nmol/L minimum advocated by a number of scientists working in vitamin D research (Vieth et al. 2007; Melamed et al. 2008) could be considered potentially inadequate. In the absence of sun exposure and endogenous synthesis of vitamin D, humans rely on dietary sources or supplementation. In New Zealand the recommended daily intake (RDI) for vitamin D is 200 IU from infancy through to adulthood, 400 IU for 51 – 70 year olds, and 600 IU for 70+ years (Commonwealth Department of Health and Ageing et al. 2006). It has been clearly demonstrated that this level of supplementation, if not augmented by sun exposure, will have little if any effect on circulating 25(OH)D concentrations (Heaney et al. 2003). Whilst there had been historical concerns about safe upper levels of supplementation, and although there is some evidence in mice that vitamin D toxicity can occur with high doses of calcitriol (>0.25 g/kg/day) (Zittermann et al. 2008), strong evidence now exists to support supplemental doses of vitamin D, 2000 – 4000 IU/day, in the absence of adequate endogenous synthesis (Hollis 2005; Hathcock et al. 2007). There are very few sources of dietary vitamin D 3 , and none which provide other than minimal amounts (table 1). A second dietary form is ergocalciferol or vitamin D 2 which originates from plants and yeast and has been used in vitamin supplements and food fortification for a number of years (Holick et al. 2008). As with vitamin D 3 , vitamin D 2 is metabolised first in the liver then in the kidneys to the active form. In North America, vitamin D 2 is available as a pharmaceutical preparation, but is not commonly used in New Zealand, where only vitamin D 3 is used in pharmaceutical preparations (Medsafe New Zealand 2006), and there is little or no food fortification. A range of supplements containing vitamin D 3 are available in New Zealand either by prescription or “over the counter” (table 2).. 13.
(24) Table 1: Vitamin D content of the main food sources in the New Zealand diet (New Zealand Foods database Version 8, Foodworks 2007; Xyris Software). vitamin D 3 g/100gm 1.65. vitamin D 3 IU/100gm 66. Canned red salmon. 4.00. 160. Fresh King salmon. 5.83. 233. Butter. 0.93. 37. Sardines. 11.00. 440. Canned tuna. 5.80. 232. Kahawai. 5.00. 200. Food Eggs. Table 2: Examples of the dose and form of vitamin D supplements available in New Zealand. Supplemental form – vitamin D 3 (cholecalciferol) Prescription only. Dose 1.25 mg (50,000 IU). Cal D Forte - 1/month for 3 months* (PSM Healthcare) (Medsafe New Zealand 2006) “Over the counter” supplements. 12.5 g (500 IU). Elevit – Pregnancy multi-vitamin - Baxters Healthcare (Medsafe New Zealand 2006) Vitamin D and fish oil - Thompsons (www.thompsons.co.nz). 25 g (1000 IU). Women’s Multi Advantage – Thompsons (www.thompsons.co.nz). 2.5 g (100 IU). Vitamin D3 – Blackmores (www.Blackmores.co.nz). 25 g (1000 IU). Cod Liver Oil 1000mg capsules - Blackmores (www.Blackmores.co.nz). 2.5 g (100 IU). Calcium and Vitamin D3 - Healtheries (www.healtheries.co.nz). 2.5 g (100 IU). *In cases of moderate/Severe Vitamin D insufficiency (< 25 nmol/L of serum 25 hydroxy Vitamin D concentration) Dosage = 1 x Cholecalciferol tablet a day for 10 days (loading). It has been a common convention in nutritional science to link a nutrient to a disease (when a deficiency disease has been identified) in terms of defining deficiency vitamin C and scurvy, iodine and goitre for example. In this way, vitamin D has been linked to rickets as its index disease, and deficiency levels are still defined as those which fail to prevent the occurrence of rickets. However, over recent years calcitriol. 14.
(25) has been shown to be involved in a diverse range of physiological processes, both genomic and non-genomic. Vitamin D is now the subject of intense research interest, and long-held beliefs about recommended daily intake and levels of adequacy are being questioned.. The vitamin D receptor - VDR The actions of calcitriol are mediated through a nuclear receptor called the Vitamin D Receptor (VDR) (reviewed in Jones et al, 1998). The discovery of this receptor in the cells of many different tissues supported the earlier hypothesis which emerged from epidemiological studies that vitamin D might have roles other than calcium homeostasis (Garland et al. 1990; Lefkowitz et al. 1994). Subsequently, such hypotheses have been further reinforced by the discovery of 1OHase in tissues other than renal cell mitochondria. During the past decade, a multitude of epidemiological and observational studies have emerged linking vitamin D deficiency with a range of disease conditions including age-related muscle loss and the development of sarcopenia (Visser et al. 2003; Inderjeeth et al. 2007), cancer (Grant 2002; Krishnan et al. 2003; Harris et al. 2004; Valrance et al. 2004), cardiovascular disease (Wang et al. 2008), auto-immune conditions (Hyppönen et al. 2001; Munger et al. 2004; Harris 2005), metabolic syndrome and type 2 diabetes (Boucher et al. 1995; Scragg et al. 1995b; Boucher 1998; Borissova et al. 2003; Scragg et al. 2004). As a lipid-soluble hormone, calcitriol is able to cross the cell membrane and enter the cytoplasm where it encounters the VDR. The human VDR is a 427-amino acid peptide with a DNA-binding domain that acts through vitamin D-response elements (VDREs) which are located near the start site of the target gene (DeLuca 2004). Once calcitriol binds to the VDR, the conformation of the receptor changes and the heterodimerisation with retinoid X receptor (RXR) is promoted. The heterodimer of VDR/RXR binds with high affinity to the VDREs in the promoter sections of the target genes (Sutton et al. 2003).. 15.
(26) It would appear that other proteins also bind with this complex as co-activators. To date at least four of these have been identified (Sutton et al. 2003), and it is thought that these co-activators may confer selectivity to which gene is expressed, as there appears to be only one VDR (Kimmel-Jehan et al. 1999). However, one receptor is responsible for the activation or suppression of a number of gene transcription events and, as a consequence, is involved in ensuring homeostasis in a number of physiological systems. In the epithelial cells of the small intestine, increased concentrations of calcitriol have been demonstrated to have an immediate and positive effect on the rate of Ca2+ transcellular transport. It has been shown that this up regulation is modulated by VDR content in the cell, and results in increased transcription of the influx and efflux channel proteins, and calbindins (DeLuca 2004). The discovery of the VDR and VDREs in the cells of the immune system suggest that vitamin D plays a direct role in the regulation of immune defence (Wang et al. 2004) and immune tolerance (Meehan et al. 2002; Harris 2005; Mathieu et al. 2005). Meanwhile, evidence mounts for a multifactorial role for vitamin D in the pathogenesis of type 2 diabetes. A role for vitamin D in insulin secretion was first suggested by Norman et al (1980) from results of studies in vitamin D deficient rats. Following that, the presence of the VDR in the pancreatic -cells established that calcitriol can influence insulin secretion (Gedik et al. 1986; Kumar et al. 1994; Ogunkolande et al. 2002) and more recently, a VDRE has been found on the insulin receptor gene (Maestro et al. 2003) suggesting a mechanism for the effect of vitamin D deficiency on insulin sensitivity.. 16.
(27) Insulin resistance and type 2 diabetes. Glucose Homeostasis The task of maintaining glucose homeostasis is often seen as the responsibility of the endocrine pancreas, and the appropriate, efficient secretion of insulin from the pancreatic islet cells. In reality, the regulation of blood glucose levels is the work of a complex interaction between organs, hormonal and neuronal control systems and intra-cellular signalling, although there is no doubt that insulin has the leading role (fig. 3).. Figure 3. Diagram of the complex interaction of organs, hormones, metabolites and tissues involved in the maintenance of glucose homeostasis. In response to increases in plasma glucose, insulin is secreted from the pancreatic -cells. Glucagon secretion is suppressed, as is hepatic glucose output. Glucose uptake is stimulated in the muscle and adipose tissue, and glycogen synthesis and glycolysis increase in the liver. Diagram from Marieb (2004). In the normoglycaemic individual, blood glucose levels vary within a narrow range (4 – 7 mmol/L) during periods of fasting and feeding. During fasting periods, when. 17.
(28) blood glucose would otherwise drop to dangerously low levels, glucagon is released from the pancreas, stimulating glycogenolysis and gluconeogenesis in the liver. The subsequent release of glucose into circulation ensures maintenance of plasma glucose levels between feeds, and provision of adequate glucose for the central nervous system which uses approximately two-thirds, and the skeletal muscle (Home et al. 2008) . Following feeding, insulin release is stimulated by glucose together with other nutrients (Marieb 2004). Uptake of glucose into the muscle and adipose cells is dependent on the insulin-stimulated translocation of GLUT4 glucose transporters (fig. 4) from the cytosol to the plasma membrane (Klip et al. 1990). Approximately 75% of insulin-dependent glucose disposal occurs in the muscle cells, with a small amount of uptake in the adipose tissue (Klip et al. 1990). The liver is not dependent on insulin for glucose uptake. Glucose transport in hepatocytes is mainly via the GLUT2 glucose transporters, although a small sub-set of perivenular hepatocytes express GLUT1 transporters (Weinstein et al. 1994). Insulin suppresses hepatic glucose output (HGO) and stimulates glycogen synthesis. Insulin suppresses lipolysis in adipose tissue, thereby also reducing HGO indirectly by influencing substrate availability (Saltiel et al. 2001).. GLUT4. Figure 4. The insulin receptor is a tyrosine kinase which, on binding of its ligand, undergoes autophosphorylation and catalyses a number of diverse downstream. 18.
(29) signalling pathways. These pathways regulate and coordinate vesicle trafficking, including the translocation of the GLUT4 transporter proteins (Saltiel et al. 2001). Factors influencing the production, secretion and clearance of insulin The primary translation product of the insulin gene (INS) is an inactive protein, 110 amino acids in length, called preproinsulin. A signal peptide, 24 amino acids in length, is cleaved off in the endoplasmic reticulum (ER), creating proinsulin which consists of an amino-terminal B chain, a connecting peptide (C-peptide) and a carboxyl-terminal A chain. The proinsulin is packaged into secretory granules where C-peptide is cleaved, resulting in equimolar amounts of insulin and C-peptide (Trout et al. 2007). The vesicles are stored in the cytoplasm of the -cell ready for secretion by exocytosis (Rutter 2004). The secretion of insulin is biphasic. There are essentially two pools of insulin-filled vesicles; one pool is closely related to, or even docked to, the cell membrane and is ready for immediate release which occurs within seconds of glucose entering the cell (first phase) (Rutter 2004). A reserve pool which needs to be mobilised to the cell membrane to be available for secretion forms the second phase, releasing insulin within 5 – 10 minutes (Rutter 2004). As glucose stimulation continues, new secretory vesicles are formed and moved to the cell membrane for docking and exocytosis as a continuation of the second phase (Cobelli et al. 2007). Glucose is the primary secretagogue for insulin, although other regulating factors such as amino acids, peptides, fatty acids and integrins are involved (Tengholm et al. 2009). Glucose enters the -cell via GLUT2 glucose transporters and its metabolism results in the production of ATP in the mitochondria (fig. 5). The increase in ATP/ADP ratio closes ATP-gated potassium channels, causing depolarisation and opening voltage-gated calcium channels. The subsequent increase in intracellular calcium concentration triggers the first phase release of insulin by exocytosis of the docked vesicles, and stimulates the movement of the stored vesicles toward the plasma membrane (Rutter 2004). This oscillatory pattern of insulin secretion requires less insulin to maintain glucose homeostasis than insulin infused at a constant rate, and the better efficiency is probably due to a higher expression of insulin receptors (Tengholm et al. 2009). Approximately 50% of insulin is taken up by the liver during first-pass transit and consequently, mean insulin concentrations in the portal vein are around twice those. 19.
(30) in the periphery (Home et al. 2008). Most of this uptake is receptor-mediated, and insulin clearance and sensitivity have been shown to be well correlated, with timing which suggests that the clearance is predominantly via the liver (Ahren et al. 2003). Therefore, it is likely that in the initial stages of insulin resistance it is reduced hepatic sensitivity, rather than peripheral resistance, which is responsible for increased concentrations of circulating insulin.. Figure 5. Glucose enters the cell via GLUT2 transport proteins (1). Metabolism of glucose results in elevated ATP (2). The ATP-sensitive potassium channels (K ATP ) close (3), the cell depolarises (4) calcium floods in (5) and insulin vesicles are released (6). Diagram from Dean et al (2004).. 20.
(31) Insulin resistance Insulin resistance occurs when the cells of the body fail to respond appropriately to a given dose of insulin. At a whole body level, glucose oxidation and glycogen synthesis are reduced, whilst hepatic glucose output continues unsuppressed (Ferrannini 2006). The cells exhibit decreased responsiveness or sensitivity to the actions of insulin and glucose homeostasis becomes dysregulated, with increased insulin secretion compensating for hyperglycaemia (Muniyappa et al. 2007). Insulin resistance heralds the potential development not only of type 2 diabetes, but also cardiovascular disease, dyslipidaemia, hypertension and a cluster of other metabolic abnormalities (Ferrannini 2006) and therefore diagnosis and progression of insulin resistance is of importance to clinicians and researchers. A number of tools have been developed to assess insulin resistance in a variety of settings, and some of the more commonly used are described below. Most widely used for diagnosis of diabetes and glucose intolerance in clinical practice is the oral glucose tolerance test / meal tolerance test (OGTT). The OGTT involves the administration of a standard oral glucose load (75g) following an over night fast. If the glucose is administered intravenously, the test is called the intravenous glucose tolerance test (IVGTT). Blood samples are taken at 0, 30, 60, and 120 minutes and glucose levels monitored. With normal glucose tolerance, glucose concentrations should be < 7.8 mmol/L at the end of 2 hours. The meal tolerance test follows the same pattern, and is possibly superior to the OGTT as it contains a mix of macro-nutrients and therefore mirrors more closely the normal physiological response to feeding (Cobelli et al. 2007). The standard OGTT or meal can provide useful information about glucose tolerance, but cannot accurately describe -cell function or insulin sensitivity. However mathematical models have been developed to allow the derivation of further information from the OGTT. The recently developed and validated Oral Minimal Model using an OGTT or meal can simultaneously and quantitatively provide predictions of -cell function, insulin sensitivity and hepatic extraction over a 2 hour test with 7 samples (Cobelli et al. 2007). Similarly, the oral glucose sensitivity index (OGIS) utilises the 2-hour OGTT measurements to predict insulin sensitivity which correlate well with the glucose clamp (Mari et al. 2001). The original Homeostasis model assessment (HOMA1) model was developed in 1985, and utilises a simple linear equation based on pairing fasting serum glucose. 21.
(32) (FSG) and fasting serum insulin (FSI) to establish a measure for insulin resistance: HOMA1-IR = (FSI x FSG)/22·5 (Matthews et al. 1985). The revised HOMA2 model is a computer model consisting of nonlinear empirical equations which, when solved, allow the determination of insulin sensitivity (HOMA2%S) from FSG and FSI, and beta cell function (HOMA2%B) from paired FSG and C-peptide. C-peptide is a reliable marker for insulin secretion as, unlike insulin, it is unaffected by first pass hepatic uptake (Wallace et al. 2004). Both -cell function and insulin sensitivity are reported as a percentage, where 100% is normal (Levy et al. 1998).. Insulin. resistance (IR) is the reciprocal of % sensitivity, and 1·0 is normal with values >1.0 indicating increasing insulin resistance. The technique is simple and inexpensive with relatively low subject burden and, as such, is often suitable for use in large studies (Wallace et al. 2004). HOMA1 has been shown to correlate well with the euglycaemic clamp in predicting insulin resistance but does have certain limitations (Bonora et al. 2000). HOMA is a measure of basal state insulin secretion and insulin sensitivity, whereas OGTT measures the dynamic state and clamp techniques (below) measure the maximally stimulated states (Wallace et al. 2004). Quantitative insulin sensitivity check index (QUICKI) is another simple model based on FSG and FSI and assesses insulin sensitivity. It has been shown to correlate well with the glucose clamp in lean and obese adults, and adults with diabetes (Katz et al. 2000). Like HOMA, QUICKI requires just one fasting blood sample and is very practical for use in large studies, but shares the same limitations. The euglycaemic hyperinsulaemic clamp involves the infusion of insulin to maintain a steady-state insulin level above fasting and a glucose analyser which monitors blood glucose levels at 5 – 10 minute intervals over a number of hours (2 – 4) (Trout et al. 2007). Dextrose is infused to keep the subject euglycaemic and whole body glucose disposal can be determined at a certain level of hyperinsulinaemia (Muniyappa et al. 2007). Whilst the euglycaemic clamp technique can measure whole body glucose disposal, it cannot assess -cell function (Cobelli et al. 2007). It is also time consuming, expensive, and labour intensive requiring highly skilled personnel to ensure subject safety (Muniyappa et al. 2007), and thus is not appropriate for use in large clinical studies or routine clinical investigations.. 22.
(33) The frequently sampled intra-venous glucose tolerance test (FSIVGTT) minimal model is a mathematical model which, when applied to the intravenous glucose tolerance test, allows the derivation of an insulin sensitivity index, an acute response to glucose (AIR) which assesses insulin secretion, and a disposition index (DI) (Bergman et al. 1987). The model was developed by Richard Bergman in 1979 and is often referred to as the “Bergman Minimal Model”. It is less labour-intensive than the euglycaemic clamp as it does not require continuous intravenous infusions, but does require continuous blood sampling for three hours. Subjects are given an intravenous glucose load following an overnight fast and blood samples to establish fasting status of glucose and insulin. Blood samples are then taken every minute for the first ten minutes, then every two minutes up to 30 minutes, and every ten minutes up to 180 minutes, for glucose and insulin measurements (Muniyappa et al. 2007). The minimal model correlates well with the clamp for estimates of insulin sensitivity (Steil et al. 1994).. 23.
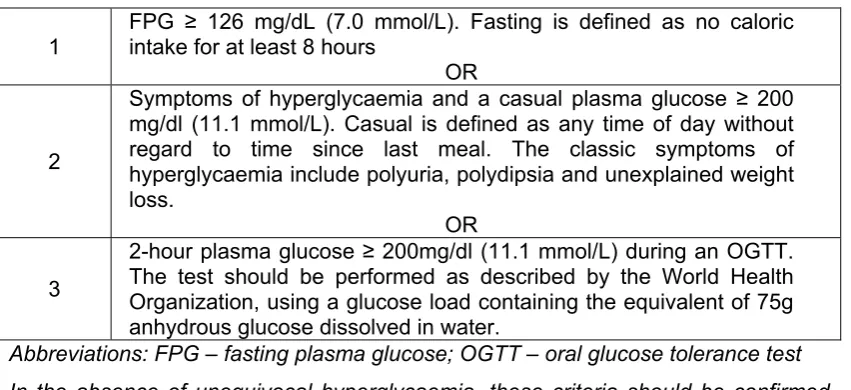
(34) Type 2 diabetes Type 2 diabetes (previously referred to as non-insulin dependant diabetes, NIDDM or adult-onset diabetes) is a slow onset disease. It appears to be strongly linked to visceral fat mass or obesity and now accounts for 90 – 95% of all of those with some type of diabetes (Expert Committee on the Diagnosis and Classification of Diabetes 2008). A diagnosis of type 2 diabetes (see table 3 for diagnostic criteria) is usually preceded by a long period during which underlying changes are taking place in glycaemic control but of which there are no overt symptoms. Table 3 Criteria for the diagnosis of diabetes (Expert Committee on the Diagnosis and Classification of Diabetes 2008) FPG ≥ 126 mg/dL (7.0 mmol/L). Fasting is defined as no caloric intake for at least 8 hours OR Symptoms of hyperglycaemia and a casual plasma glucose ≥ 200 mg/dl (11.1 mmol/L). Casual is defined as any time of day without regard to time since last meal. The classic symptoms of 2 hyperglycaemia include polyuria, polydipsia and unexplained weight loss. OR 2-hour plasma glucose ≥ 200mg/dl (11.1 mmol/L) during an OGTT. The test should be performed as described by the World Health 3 Organization, using a glucose load containing the equivalent of 75g anhydrous glucose dissolved in water. Abbreviations: FPG – fasting plasma glucose; OGTT – oral glucose tolerance test 1. In the absence of unequivocal hyperglycaemia, these criteria should be confirmed by repeat testing on a different day. Diagnosis criteria for type 2 diabetes does not currently include measurement of HBA1c although there is increasing international discussion about the advantages and disadvantages of doing so (Zimmet 2009) This period of glycaemic abnormalities up to the time of fulfilment of the diagnostic criteria for diabetes can be usefully called “prediabetes” indicating that there is a relatively high risk of the patient developing diabetes (Expert Committee on the Diagnosis and Classification of Diabetes 2008). The degree of such risk and the time period involved appears to vary widely and will be influenced by the presence of other metabolic abnormalities such as obesity (Depres 2006). The proportion of total cases that progress to diabetes varies from as few as 2.7% with impaired fasting glucose (IFG) over a period of 30 months, to as many at 66% with previous IFG and/or impaired glucose tolerance (IGT) over 5 years (see table 4). Nichols et al. 24.
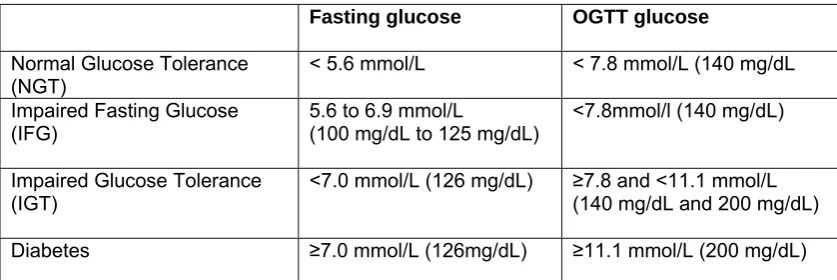
(35) (2007) concluded that patients were progressing from newly identified IFG to diabetes in less than 3 years. Impaired fasting glucose and impaired glucose tolerance are separable conditions with different clinical diagnostic criteria. They provide cut-off points which can be used diagnostically in a clinical or research setting, but they are really points on the continuum towards fully developed diabetes. IFG can be present without IGT but the two usually co-exist in the period preceding the diagnosis of diabetes. Table 4. The rate of progression from prediabetes (IFG or IFG and IGT) to diabetes Subjects and setting Men and women, 25 – 74 years. Mixed race incl. South Asian Indians, Chinese, African/Creole Mauritius Italian men and women, 40 – 59 years at baseline Naples Pima Indians, men and women > 15 years Arizona, USA Caucasian men, 44-55 years Paris. 5 years. Men 24% Women 26%. Proportion of progression from IFG and IGT Men 37% Women 66%. 11.5 years. 9.1%. 44.4%. (Vaccaro et al. 1999). 41.2%. (Gabir et al. 2000). Duration of study. 5 years 30 months. Proportion of progression from IFG. 14% 2.7% (129 from 4744 with NGT or IFG) 11.3%. Reference (Shaw et al. 1999). (Eschwege et al. 2001). Men and women, mean 3 years (Nichols et age at follow up 57.9 al. 2007) years Portland, Oregon Abbreviations: IFG – impaired fasting glucose; IGT – impaired glucose tolerance; NGT – normal glucose tolerance. The pathophysiology of prediabetes is characterised by impaired fasting glucose (IFG) and impaired glucose tolerance (IGT) (Nathan et al. 2007). IFG is defined as an elevated fasting plasma glucose but normal 2-hour glucose following an OGTT (table 5). In this early stage, glucose is elevated in the fasting state probably because endogenous glucose production from the liver is occurring at a faster rate than glucose is being cleared from the blood (Bock et al. 2006). This indicates. 25.
(36) reduced insulin sensitivity in the liver resulting in poor control of hepatic glucose release (Abdul-Ghani et al. 2006).. Table 5. Definition of stages of glycaemic status Fasting glucose. OGTT glucose. Normal Glucose Tolerance (NGT) Impaired Fasting Glucose (IFG). < 5.6 mmol/L. < 7.8 mmol/L (140 mg/dL. 5.6 to 6.9 mmol/L (100 mg/dL to 125 mg/dL). <7.8mmol/l (140 mg/dL). Impaired Glucose Tolerance (IGT). <7.0 mmol/L (126 mg/dL). ≥7.8 and <11.1 mmol/L (140 mg/dL and 200 mg/dL). Diabetes. ≥7.0 mmol/L (126mg/dL). ≥11.1 mmol/L (200 mg/dL). Diagnostic criteria for stages of glucose tolerance through to diagnosis of type 2 diabetes (Expert Committee on the Diagnosis and Classification of Diabetes 2008). Note that WHO defines IFG as 6.1 – 6.9 mmol/L, and does not provide a definition for NGT other than: “Since there are insufficient data to accurately define normal glucose levels, the term ‘normoglycaemia’ should be used for glucose levels associated with low risk of developing diabetes or cardiovascular disease, that is levels below those used to define intermediate hyperglycaemia.” (World Health Organization 2006) During a 2-hour oral glucose tolerance test (OGTT), people with IFG show a rise in blood glucose which is only slightly higher than that in NGT because they have little or no insulin resistance in the muscle cells (Abdul-Ghani et al. 2006). Insulin secretion is only mildly impaired if at all, and seemingly it is the early-phase (first 30 minutes) response which is most affected. The late phase response during an OGTT is close to normal, resulting in a return of blood glucose concentration to normal levels by the end of a 2-hour test (fig. 6) (Abdul-Ghani et al. 2006). Faerch et al (2009) found a stationary reduced insulin secretion in subjects with NGT who then later developed IFG, suggesting that IFG is primarily caused by an inherent dysfunction in insulin secretion followed by hepatic insulin resistance. The subjects in this study did not show any further deterioration in insulin secretion as they progressed to IFG which suggests that the -cell impairment is not a major feature in IFG (Faerch et al. 2009). However, fasting hyperinsulinaemia has been well. 26.
(37) documented in individuals with IFG (Weyer et al. 1999; Tripathy et al. 2000; AbdulGhani et al. 2006).. Figure 6. Glucose and insulin response during an OGTT in subjects with NGT, IFG, IGT and combined IFG and IGT (CGI). (Abdul-Ghani et al. 2006) Conversely, IGT appears to be characterised by moderate to severe peripheral insulin resistance, normal to mild hepatic insulin resistance, followed by a decline in -cell function (Nathan et al. 2007; Faerch et al. 2009) seen in both reduced early phase response and deficient late-phase insulin secretion (Festa et al. 2004). By the time fasting hyperglycaemia is present, is it estimated that -cell function is reduced by 75% (Kahn et al. 2006), which would explain the much higher rate of progression to diabetes from IGT, because -cell function must be impaired for type 2 diabetes to develop (Kahn 2001). IGT will often co-exist with IFG, but sometimes does not, indicating different pathophysiological mechanisms contributing to the disturbed glucose homeostasis (Shaw et al. 1999; Nichols et al. 2007; Faerch et al. 2009). It is becoming apparent that although both conditions represent a state of insulin resistance, the site of the resistance differs and there is also a different pattern in the impairment of insulin secretion (Nathan et al. 2007). Where both conditions exist, naturally there will be insulin resistance in both the liver and muscle (Abdul-Ghani et al. 2006), together with reduced -cell function which increases in its severity until blood glucose levels can no longer be controlled by endogenous insulin secretion (Weyer et al. 1999). If diagnosed in the early stages, the progression from prediabetes to diabetes can be potentially halted or even reversed with lifestyle changes or medication. Physical. 27.
(38) activity and weight loss programmes have been shown to be especially effective, demonstrating reduction in the development of diabetes of 25 – 60% (Tuomilehto et al. 2001; Diabetes Prevention Program Research Group 2002; Payne et al. 2008; Shaw et al. 2009). These programmes primarily targeted weight loss, as their subjects were obese or overweight, and even with very modest weight loss they saw marked improvements in insulin sensitivity (Schäfer et al. 2007; Payne et al. 2008; Thompson et al. 2008; Shaw et al. 2009). There does not appear to be any evidence for lifestyle changes having any effect on insulin secretion or impaired -cell function. Metformin, a drug which improves insulin action at peripheral sites (MedSafe New Zealand 1999), was the first of the pharmacological interventions to prove effective. It is inexpensive and has minimal side effects (Nathan et al. 2007). However, its effectiveness, at least in the short term, has been shown to be only half that of successful lifestyle interventions (Knowler et al. 2002).. 28.
(39) Metabolic syndrome The metabolic syndrome is a collection of metabolic abnormalities which, together or in part, are associated with increased risk of diabetes and cardiovascular disease. (Hanson et al. 2002; Bonora 2006). These abnormalities include abdominal obesity, impaired glucose regulation, raised triglycerides, decreased high-density lipoprotein (HDL) cholesterol, elevated blood pressure and hyperinsulinaemia with underlying insulin resistance (Magliano et al. 2006). The presence of 3 or more of the metabolic syndrome abnormalities, in particular hyperinsulinaemia, dyslipidaemia and body size, are associated with a greatly increased risk of the eventual development of type 2 diabetes (Wannamethee et al. 2005). Meanwhile, hypertension, hyperinsulinaemia and dyslipidaemia are important risk factors for cardiovascular disease, increasing the risk of developing CVD 2 – 4 fold compared to individuals without any metabolic syndrome abnormalities (Bonora 2006). Definitions of the syndrome have varied over the past 3 decades, sometimes with more emphasis on risk factors for diabetes, sometimes more on cardiovascular disease. In 1988, Reaven coined the name “Syndrome X” but also called the collection of symptoms “insulin resistance syndrome” (Reaven 2005). Reaven’s definition however, did not include central adiposity and this omission was corrected in 1999 in a definition proposed by the World Health Organization (WHO) Diabetes Group (Alberti et al. 1998). In 2001 the National Cholesterol Education Program (NCEP): Adult Treatment Panel III (ATP III) produced a definition more focused on diagnosis of cardiovascular disease risk. It required the presence of any three of five components: central obesity, raised blood pressure, raised triglycerides, low HDLcholesterol, and fasting hyperglycaemia (Adult Treatment Panel III 2001). In 2005 the International Diabetes Federation (IDF) proposed a new definition which places abdominal obesity in a central position, and allows for different cut-off points for abdominal obesity in different population groups. The IDF definition (table 6) (Zimmet et al. 2005), also allows for the further recognition of other components as yet not included in the definition due to lack of sufficient evidence. These include aspects of body composition, inflammatory markers, thrombotic markers, additional lipid-based factors, insulin resistance and others (Alberti et al. 2005; International Diabetes Federation 2005).. 29.
(40) Table 6. The 2005 International Diabetes Federation definition of the metabolic syndrome (International Diabetes Federation 2005) According to the International Diabetes Federation definition, for a person to be defined as having the metabolic syndrome, they must have: Central obesity (defined as waist circumference > 94 cm for Europid men and >80 cm for Europid women, with ethnicity specific values for other groups*) Plus any two of the following four factors: Raised serum triglyceride level (>1.7 mmol/L) Reduced serum HDL-cholesterol level (<1.03 mmol/L in males and <1.29 mmol/L in females), or specific treatment for these abnormalities. Raised blood pressure (systolic blood pressure >130mmHg or diastolic blood pressure >85mmHg) or treatment of previously diagnosed hypertension. Impaired fasting glycaemia (fasting plasma glucose >5.6mmol/L) or previously diagnosed type 2 diabetes. *South Asian and South-East Asian men ≥90cm, women ≥80cm; Japanese men ≥85cm, women≥90cm. Putting central obesity in a priority position in the list of diagnostic criteria for metabolic syndrome seems appropriate. The secretions of adipose tissue, especially the more metabolically active visceral adipocytes, induce insulin resistance along with other metabolic abnormalities such as inflammation, atherosclerosis and even cancer (Scherer 2006). However, in a joint interim statement issued weeks prior to this thesis being submitted, the International Diabetes Federation Task Force on Epidemiology and prevention, The National Heart, Lung and Blood Institute, The American Heart Association, The World Heart Federation, The International Atherosclerosis Society, and the International Association for the Study of Obesity, changes were made to the above definition. Central obesity is no longer an obligatory component, although it is suggested that waist measurement be used as a screening tool. Three abnormal findings out of the five listed above would qualify a person for metabolic syndrome (Alberti et al. 2009).. 30.
(41) Genetic susceptibility to -cell dysfunction and insulin resistance The healthy -cell responds to increased plasma glucose, which reflects insulin resistance, by increasing both insulin secretion and -cell mass to ensure that glucose homeostasis is maintained (fig. 7). Thus an individual with insulin resistance might exhibit hyperinsulinaemia, but plasma glucose will be normal (Kahn 2001). However, if the -cell is genetically susceptible to dysfunction, it is unable to increase insulin secretion, and impaired glucose tolerance and, ultimately, type 2 diabetes will develop (Kahn 2001).. Figure 7. Genetic predisposition for -cell dysfunction, plus obesity, plus environmental factors progress to impaired glucose tolerance and type 2 diabetes. Diagram from Kahn et al. (2006). Along with lifestyle factors (McAuley et al. 2002; Corpeneijn et al. 2007) and increased adiposity (Hotamisligil et al. 1993; Hu et al. 2004; Scherer 2006), family history is one of the main risk factors for the development of type 2 diabetes (Pontiroli et al. 2000; Jensen et al. 2002; Knowles et al. 2002).. 31.
(42) Genetic susceptibility to -cell dysfunction and the development of type 1 diabetes has been identified in people carrying certain VDR haplotypes (Ramos-Lopez et al. 2006 ; Mimbacas et al. 2007; Garcia et al. 2007 ). One VDR polymorphism has been identified in both Indian and Bangladeshi populations and correlates with increased risk of type 1 diabetes (McDermott et al. 1997). A connection between genetic susceptibility for type 2 diabetes and vitamin D has also been seen in polymorphisms in the vitamin D receptor which are thought to modify susceptibility to insulin resistance (Filus et al. 2008 ).. 32.
(43) Hypovitaminosis D and type 2 diabetes. Correlation not causation The identification of the VDR in the pancreas of chickens provided the first clue that calcitriol may play a role in the regulation of pancreatic endocrine function, including the secretion of insulin (Christakos et al. 1979 ; Norman et al. 1980). Studies in rat pancreatic cells in vitro and in vivo indicated that vitamin D or its metabolites were essential for the efficient secretion of insulin and control of glucose homeostasis (Kadowaki et al. 1984; Cade et al. 1986). The presence of the VDR was then confirmed in human pancreatic islet -cells (Johnson et al. 1994). Subsequently, the links between vitamin D insufficiency and aspects of diabetes risk have been demonstrated in a number of epidemiological studies. Analysis of the Third National Health and Nutrition Examination Survey (NHANES III) data by Scragg et al (2004) found an inverse relationship between serum 25(OH)D concentration, and diabetes risk and insulin resistance (HOMA-IR) but not in -cell function. In New Zealand, a case control comparison nested within a crosssectional study which compared newly detected cases of IGT or type 2 diabetes with matched controls, found that the controls had higher serum 25(OH)D levels than the cases (Scragg et al. 1995b). The mean difference was only 7 nmol/L (2.8 ng/mL), but was highly significant (P = 0.0016). Serum 25(OH)D levels were also significantly lower in elderly Italian women with type 2 diabetes compared to controls (11 ± 9.8 vs 9 ± 11.3 ng/mL, P<0.008) (Isaia et al. 2001). More recently, a prospective study from Finland followed two cohorts for 17 and 24 years and found that high serum 25(OH)D at baseline was protective against future development of type 2 diabetes, with men in the highest quartile of 25(OH)D (mean 75, range 58-148 nmol/L) having an 82% lower risk compared to the lowest quartile (mean 24, range 11-32 nmol/L) (Knekt et al. 2008). Another 10-year prospective study in the United Kingdom had similar findings, with baseline 25(OH)D inversely correlated with risk of hyperglycaemia, insulin resistance and metabolic syndrome (Forouhi et al. 2008). Hypponen et al (2008) reported an inverse association between 25(OH)D levels and metabolic syndrome prevalence, levels of glycosylated. 33.
(44) haemoglobin, blood pressure and triglycerides in the 1958 birth cohort of 6,810 white British adults at the age of 45 years.. Vitamin D supplementation There have been a number of intervention trials assessing the effect of improved vitamin D status on glucose handling and various components of metabolic syndrome (table 7). In general, these studies have been small intervention studies administering varying doses of either vitamin D or calcitriol, and measuring different outcomes. The most commonly measured outcome has been -cell function as measured by change in insulin secretion. Gedik et al (1986) supplemented 4 severely vitamin D deficient women with 2000 IU vitamin D 3 for 6 months and compared them with healthy controls. Mean serum 25(OH)D levels prior to supplementation were 29.7 ± 3.3 pg/mL increasing to 70.0 ± 10.3 pg/mL post treatment. Insulin secretion, which had been significantly lower than in the healthy controls, increased to a slightly higher. level. than. the. normal. subjects,. and. the. insulinogenic. index. (Insulin/Glucose) increased from 1.71 ± 0.4 pre-treatment to 2.48 ± 0.3 post treatment. Changes in glucagon did not change significantly, and levels were not significantly different to those in the control group, thus indicating that glucagon secretion is not affected by vitamin D status. A similar observation was made in a single vitamin D deficient patient who was given 2000 IU vitamin D 3 per day for one month (Kumar et al. 1994) and in 44 vitamin D deficient adults following a single 100,000 IU intra-muscular injection of vitamin D 3 (Boucher et al. 1995). Improving vitamin D status with 1332 IU vitamin D 3 per day for one month was shown to improve first-phase insulin secretion in 10 women with type 2 diabetes compared to healthy controls (Borissova et al. 2003). The subjects in these studies were all vitamin D deficient, but did not share baseline glycaemic status, neither was there any commonality in the amount, duration or method of administration of the vitamin D. Despite the wide variation in study methodology, supplementation with vitamin D has mostly shown some kind of improvement in either insulin secretion or, in fewer cases, glucose tolerance. Even in the Pittas (2007) study, with vitamin D replete subjects (baseline 25(OH)D 71.2 ± 5.2 nmol/L) and vitamin D 3 supplementation of. 34.
(45) 700 IU/day, there was an ameliorating effect of the supplementation compared with placebo on subjects with IFG. Over the three years of the study, serum 25(OH)D levels increased in the supplemented group by 31.2 ± 4.4 nmol/L. Meanwhile, HOMA-IR and FPG both increased significantly more in the placebo group compared to the supplemented group. There have, however, been two studies where no improvement was observed in the pre-existing condition: Taylor (1998) administered a single intra-muscular (IM) dose of 300,000 IU vitamin D 2 to three Asian subjects with type 2 diabetes and observed increased insulin resistance, glycosylated haemoglobin and triglycerides. The authors report measuring serum 25(OH)D 3 at baseline and 3 months after treatment and serum levels increased from 13, 13 and 8 nmol/L to 51, 47 and 33 nmol/L. Fasting insulin increased, suggesting that -cell function could have been improved by supplementation, but FPG also increased. Meanwhile Tai et al (2008) gave two oral doses of 100,000 IU each, two weeks apart to 33 non-diabetic adults and failed to see any change in measures of glucose tolerance or insulin sensitivity. Mean serum 25-hydroxyvitamin D increased from 39.9 ± 1.5 (SEM) at baseline to 90.3 ± 4.3 nmol/L 4 weeks later, but there were no changes in FPG or FPI or 2-hour assessments following an OGTT. Only very recently has there been a randomised placebo-controlled trial to test the effect of vitamin D 3 supplementation on measures of glucose tolerance and insulin secretion. Nagpal et al (2009) gave three doses of 120,000IU vitamin D 3 (n = 35) or placebo (n = 36), 2 weeks apart to Indian men. These subjects were centrally obese, but were otherwise healthy and not selected for vitamin D deficiency although mean baseline 25(OH)D concentration was 36.5 ± 14.6 nmol/L, increasing by 35.1 ± 27.3 nmol/L in the supplemented group. There was a small improvement in oral glucose insulin sensitivity (OGIS), but not insulin secretion or HOMA2IR. Greater central adiposity and lower baseline vitamin D levels were significant predictors of a greater improvement in OGIS in response to supplementation. In both this study and the Tai (2008) study samples for endpoint measures were taken two weeks after administration of the final dose, therefore times from baseline to endpoint measures were 6 and 4 weeks respectively. The administration of large doses either orally or by IM injection features throughout vitamin D supplementation trials, but very little research has been done on the. 35.
Figure


+7


Related documents
The paper is discussed for various techniques for sensor localization and various interpolation methods for variety of prediction methods used by various applications
According to the US National Institutes of Health’s registry of clinical trials, there are five clinical trials recruiting, active, or completed for the treatment of
19% serve a county. Fourteen per cent of the centers provide service for adjoining states in addition to the states in which they are located; usually these adjoining states have
In the present work, chitosan decorated copper nanoparticles catalysts were synthesized through green methods [34,35] and its application as an efficient catalyst in
It was decided that with the presence of such significant red flag signs that she should undergo advanced imaging, in this case an MRI, that revealed an underlying malignancy, which
Also, both diabetic groups there were a positive immunoreactivity of the photoreceptor inner segment, and this was also seen among control ani- mals treated with a
homelessness. Data was managed and themed with the assistance of Nvivo software. RESULTS: Four themes were generated from the data related to the experience of family
