This is a repository copy of
Shear wave velocity measurement of Kaolin during undrained
unconsolidated triaxial compression
.
White Rose Research Online URL for this paper:
http://eprints.whiterose.ac.uk/75934/
Version: Published Version
Proceedings Paper:
Black, JA, Stanier, SA and Clarke, SD (2009) Shear wave velocity measurement of Kaolin
during undrained unconsolidated triaxial compression. In: Proceedings of the 62nd
Canadian Geotechnical Conference. 62nd Canadian Geotechnical Conference, 20-23
September 2009, Halifax, Canada. .
eprints@whiterose.ac.uk
https://eprints.whiterose.ac.uk/
Reuse
Unless indicated otherwise, fulltext items are protected by copyright with all rights reserved. The copyright
exception in section 29 of the Copyright, Designs and Patents Act 1988 allows the making of a single copy
solely for the purpose of non-commercial research or private study within the limits of fair dealing. The
publisher or other rights-holder may allow further reproduction and re-use of this version - refer to the White
Rose Research Online record for this item. Where records identify the publisher as the copyright holder,
users can verify any specific terms of use on the publisher’s website.
Takedown
If you consider content in White Rose Research Online to be in breach of UK law, please notify us by
SHEAR WAVE VELOCITY MEASUREMENT OF
KAOLIN DURING UNDRAINED
UNCONSOLIDATED TRIAXIAL COMPRESSION
Dr Jonathan A. Black
University of Sheffield, Civil and Structural Engineering, Sheffield, UK Samuel A. Stanier and Sam Clarke
University of Sheffield, Civil and Structural Engineering, Sheffield, UK
ABSTRACT
Undrained shear strength of cohesive soils is traditionally evaluated in the laboratory through the use of undrained unconsolidated triaxial compression tests. More recently the measurement of shear wave velocity using bender elements has become increasingly popular for the assessment of soil properties due to its simplicity. In the present research shear wave velocity is used to examine the undrained shear strength of 100mm diameter kaolin clay specimens manufactured
by compaction at various moisture contents. The results indicate a correlation between undrained shear strength and
shear wave velocity which is responsive to axial strain, which is likely a phenomena caused by the sample generation process utilised in the presented preliminary results.
RÉSUMÉ
Undrained shear strength of cohesive soils is traditionally evaluated in the laboratory through the use of undrained unconsolidated triaxial compression tests. More recently the measurement of shear wave velocity using bender elements has become increasingly popular for the assessment of soil properties due to its simplicity. In the present research shear wave velocity is used to examine the undrained shear strength of 100mm diameter kaolin clay specimens manufactured
by compaction at various moisture contents. The results indicate a correlation between undrained shear strength and
shear wave velocity which is responsive to axial strain, which is likely a phenomena caused by the sample generation process utilised in the presented preliminary results. (TRANSLATE TO FRENCH)
1 INTRODUCTION
The measurement of soil properties is an intrinsic component in the study of soil mechanics and its application to geotechnical design. Routine estimations of soil properties such as stiffness, strength and compressibility are traditionally made using conventional laboratory triaxial compression and oedometer consolidation tests. However, recent research has brought about the development of dynamic methods for the measurement and assessment of soil properties using shear wave velocity generated by piezo-ceramic plate transducers known as ‘bender elements’.
Shear wave velocity measurement within soil specimens was first evaluated by Lawerence (1963, 1965) using shear plates. Shirley and Hampton (1977) and Shirley (1978) introduced piezo-electric ceramics transducers in place of shear plates and noted the generation of stronger signals with lower electrical excitation that traditional shear plates. This approach was later refined by Dyvik and Madshus (1985) into the ‘bender element’ technique that is commonly adopted in soil testing today.
The assessment of soil properties using shear wave velocity has been successfully applied to in-situ testing methods (Bodare and Massarch, 1984 and Hiraide et al. 1996) through the use of cross hole measurement. In addition, the latter investigation considered shear wave measurements on undisturbed triaxial tests extracted during site investigation. The authors determined correlation existed between shear wave velocity and
measured strengths in the field and lab. This investigation highlighted the possibilities of using shear wave velocity within the laboratory environment to assess soil properties.
Recent innovations in laboratory testing has seen the integration of bender element probes in standard laboratory apparatus such as triaxial and oedometer systems. In this respect Bates (1989), Viggiani and Atkinson, (1995), Brignoli et al. (1996), Pennington et al. (2001) and Clayton et al. (2004) have measured shear wave velocity in triaxial specimens while Dyvik and Madshus (1985), Fam and Santamarina (1995) and Chan (2006) incorporated the transducers into oedometer cells.
Substantial information from previous research is available on the relationship of wave velocity with
maximum shear modulus (G0). However, fewer studies
have considered the relationship with soil compressibility and shear strength. Yesiller et al. (2000) and Porbaha et al (2005) investigated the correlation of shear wave velocity with unconfined compressive strength. These studies have indicated that an approximate linear relationship existed for the test conditions/material tested.
Bender elements provide a reliable, cost effective alternative to undertaking locally instrumented stress path triaxial tests. For this reason their has been a significant increase in their use within standard laboratory tests and as such there is a need for greater understanding of relationships between shear wave velocity and various soil properties.
the evaluation of shear wave velocity with stress/strain response of unconsolidated undrained 100mm diameter triaxial specimens.
2 BENDER ELEMENT PRINCIPLE
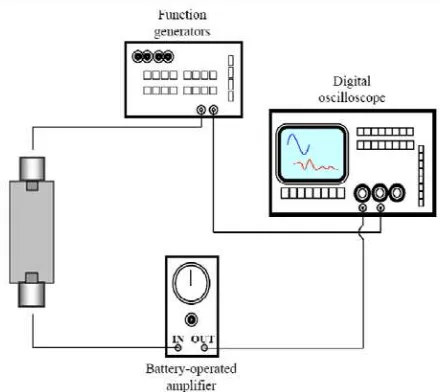
A bender element is a two layer piezoelectric transducer that consists of two conductive outer electrodes, two piezo-ceramic sheets and a conductive metal shim at the centre. The ability of the transducer to send and receive signals depends on the wiring configuration adopted. Leong et al. (2005) demonstrated that the quality of the transmitted and received signals is improved when a parallel connection is adopted and a series connection for the receiver bender element. When excited with a small voltage created using a function generator the ‘transmitter’ distorts and generates a bending motion. The ‘receiver’ detects the vibration propagated through the medium and produces a voltage output. The transmitted and received electrical signals are recorded as waveforms on an oscilloscope for further examination. A schematic diagram of the test system used in the present investigation is shown in Figure 1.
By recording the time required for the wave motion to travel from the transmitter to the receiver, the shear wave
velocity (Vs) can be determined:
Vs= Ltt/ t [1]
where Ltt is the tip to tip distance between the transmitter
and the receiver bender element and t is the wave travel
time. One of the most common interpretations from the
shear wave velocity is the maximum shear modulus (G0)
which is determined from the elastic wave propagation theory:
G0 = Vs
2
[2]
where is the total mass density of the soil.
2.1 Signal interpretation
While the setup and operation of bender element transducers is relatively simple, ambiguity still remains in the detection and assessment of the shear wave arrival time. Figure 2 shows typical set of transmitted and received oscilloscope signals obtained as part of this investigation. A sine wave is typically used for the transmitted signal as this ensures that the output wave was of the same form and reduces difficulties of signal interpretation often associated with square wave forms
Jovičić et al. (1996). The most universal method adopted
for bender element interpretation involves visually picking the arrival position from the received trace within the time domain record directly from an oscilloscope. While this approach has been shown to work successfully (Viggiani and Atkinson, 1995; Arulnathan et al. 1998; Lings and Greening, 2001; Clayton et al. 2004; Porbaha et al. 2005) several difficulties have been reported surrounding the identification of the true received wave arrival positional. It is evident from the received trace (Figure 2) that the first deflection of the signal occurs at Point 1 and gradually increases until the first point of inflection (Point 2) and onto the first major peak (Point 3).
[image:3.595.74.294.358.554.2] [image:3.595.315.541.410.608.2]Viggiani and Atkinson (1995) state that it is common practice to locate the first arrival of the shear wave at the point of first detection of the received signal, Point 1. In contrast, other researchers (Sanchez-Salinero et al. 1986) propose that the first deflection (Point 1) may not correspond to the shear wave arrival but to the arrival of near field components and cited sample size, boundary Figure 1. Bender element test setup from Chan, 2006.
effects and wave frequency as contributing factors. To
eliminate near field effects the authors defined a term Rd
such that:
Rd = L / [3]
where L is the shear wave travel distance (tip to tip) and is the wavelength. Sanchez-Salinero et al. (1986)
recognised that the Rd ratio controls the shape of the
received signal through observation of the degree of attenuation that occurs as the wave propagates through
the soil specimen. Rd depends not only on the frequency
of the signal, but also on the shear wave velocity. It was
recommended that Rd should lie between 4 and 8 to avoid
near-field effects (Sanchez-Salinero et al. 1986 and
Jovičić et al. 1996). Nevertheless, using a high input
frequency to attain a sufficiently high Rd ratio is not always
applicable. At high frequencies, as often required in testing stiffer material, ‘overshooting’ of the transmitter BE
can occur (Jovičić et al. 1996). The limiting frequency at
which overshooting begins depends on the relative impedances of the soil and bender element, making it a more serious problem in stiffer material. It is also worse for square waveforms, due to the rise time of the wave which is ideally zero corresponding to an infinite frequency.
Early work by Brignoli et al. (1996) also reported difficulties arising from near field effects. The authors determined that the shear wave arrival time was significantly masked when the distance between the source and receiver was approximately ¼ wavelengths hence confirming the previous postulation by Sanchez-Salinero et al. (1986).
Jovicic et al. (1996) reported two techniques to overcome the difficulties associated with signal interpretation arising from near field effects and overshooting. The first is to distort the shape of the input wave using a function generator whereby the amplitude of the first upward cycle may be reduced to cancel out the near field effect. Alternatively the frequency of the input wave may be adjusted to give forced oscillation of the receiver at one of its natural resonant frequency. The latter approach was also adopted by Lee and Santamarina (2005); however, it was noted that the resonant frequency was highly variable due to the soil stiffness.
Alternative signal processing procedures have been explored within the frequency domain to avoid ‘visually picking’ a travel time. Frequency domain methods involve analyzing the spectral breakdown of the signal into a group of harmonic waves of known frequency and amplitude allowing comparison of the components. A convenient algorithm for this purpose is the Fast Fourier Transform (FFT), examples of which are described by Bodare and Massarsch (1984), Mancuso and Vinale, (1988), Viggiani and Atkinson (1995), Jovicic and Coop (1997), Brocanelli and Rinaldi (1998), Arroyo (2001) and Lee and Santamarina (2005).
Results obtained using the above numerical interpretations are not yet proven to provide superior
estimation of wave travel time than the visual picking method previous described. Nevertheless, numerical analysis has confirmed that the travel time should not be taken as the time corresponding to the detection of the first arrival (Point 1 in Figure 2) but the most reliable assessment of travel time from visually picking is determined from the first major peak position (Point 3 in Figure 2) (Jovicic and Coop, 1997; Brocanelli and Rinaldi 1998; Arroyo, 2001 and Lee and Santamarina, 2005) therefore this approach has been adopted in the present research for determining the shear wave velocity.
3 EXPERIMENTAL EQUIPMENT
3.1 Bender elements
The bender element probes used in the present investigation were fabricated in house for a previous research project conducted by Chan (2006). Bimorph PZT-5A piezo-ceramic strips (69 mm x 10 mm x 0.5 mm) were supplied by Morgan Electro Ceramics. These strips were pre-polarised for either series or parallel connection. The strips were machined using a diamond edge wheel cutter to produce piezo-ceramic elements measuring 16mm in length. Each element was wired using a RG178B/U coaxial cable- 1.8 mm diameter that was soldered to the peizo-ceramic element. In line with
previous research (Lings and Greening, 2001; Leong et
al. 2005) a parallel wiring configuration was adopted for the transmitter while the receiver was connected in series as this has previously been shown to produce enhanced signal quality for both wave forms.
[image:4.595.315.542.569.703.2]The peizo-ceramic element was encapsulated in resin (2-part epoxy resin - Araldite MY753 and HY951) to provide waterproofing and additional protection to the ceramic as well as the wiring circuit. An aluminum split potting mould was specially designed and manufactured for this purpose to produce an encapsulation of 0.5 to 1.0 mm thickness on all sides of the protruding ceramic. The resin was introduced into the mould using a syringe through an access hole on the base of the mould ensuring that entrapped air was expelled. The resin filled mould containing the ceramic element was then placed in an oven at 105°C for 24 hours to ensure aid the curing process.
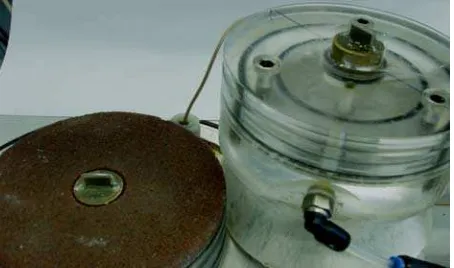
Upon de-moulding, the now encapsulated ceramic element was potted in a brass cup of 20 mm external diameter and 20 mm depth with the same resin. This was to allow the easy integration and exchange of the bender elements into existing apparatus within the laboratory (Figure 3). The final protrusion of the bender elements above the face of the pedestal and top cap was 12mm wide, 7mm high with a thickness of between 0.5 – 1.0mm. It is worth noting that the protruding element is unlikely to have affected sample performance as it represented a small surface are in relation to that of the overall sample. It was anticipated that the protrusion length of 7mm would ensure a good coupling between the soil sample and the bender element, and hence give clear signals for the determination of shear wave travel time. When calculating the shear wave velocity the travel distance is taken as the sample height minus the protrusion lengths of the bender elements. A BNC (Bayonet Neill Conringman) plug was fixed to the far end of the cable for connection to the relevant devices.
3.2 Shear wave velocity measurement
For signal generation a Thandor TG503 function generator was used and provided the necessary excitation voltag to the transmitting bender element. For reasons previously explained (Section 2.1) this was in the form of a single cycle sine wave. The received signal as detected by the receiving bender element mounted in the top cap of the sample was amplified through a battery-powered amplifier. Both the transmitted and received signals were captured on a digital oscilloscope (Tektronix TDS3012B, 100 MHz, 1.25GS/s) (Figure 4). Subsequent digitised data was processed in spreadsheets for determination of shear wave arrival time.
3.3 Triaxial system
Unconfined compressive strength of samples was measured using a conventional triaxial testing machine
capable of testing a specimen 100mm diameter by 200mm high. Modifications to integrate bender element probes to measure shear wave velocity were made in the pedestal and sample top cap. The system was fully automated allowing pneumatic control of cell and back pressures and axial load. The cell was instrumented with an external LVDT and internal 2.5kN load cell. The system was controlled using GDS software (Figure 4).
4 TEST PROCEDURE
4.1 Sample preparation
[image:5.595.313.545.344.438.2] [image:5.595.72.299.467.637.2]The test materials used in the investigation include commercially available Kaolin Speswhite Clay. Relevant material properties were assessed according to procedures outlined in BS1377: 1990 and are provided in Table 1. Artificial clay was used in this investigation to minimise sample variation and ensure enhanced sample repeatability.
Table 1. Material properties of Speswhite Kaolin Clay.
The base material for samples was prepared by mixing Kaolin powder at a range of moisture contents in a large rotating pan mixer for 10 minutes. Several cycles of hand mixing were conducted to remove material bonded to the paddles and sides of the bowl to ensure a uniform consistency was achieved. Triaxial specimens were generated by compacting the mixed material into a three piece split mould in five equal layers, each receiving 27 blows delivered from a 2.5kg compaction hammer in accordance with BS1377: 1990. Prior to extraction the sample was trimmed level with the top of the compaction mould using a wire saw. The mass of the sample was measured to determine the bulk density. The sample was wrapped in cling film to prevent loss of moisture loss and stored in a temperature controlled environment (20°C) for 24 hrs prior to triaxial compression.
Trial compaction tests on kaolin using this procedure confirmed that a water content of 34% produced samples having low air voids (<5%) and a high degree of saturation (Figure 5). To generate specimens having a range of
undrained shear strength Cu, appropriate moisture
contents were determined using the preliminary data presented in Figure 5, allowing samples to be manufactured using the aforementioned technique yielding the sample properties presented in Table 2.
Kaolin Clay Parameters
Liquid limit (%) 62
Plastic limit (%)1 35
Plasticity index 27
Optimum moisture content (%) 34
Specific gravity
Maximum dry density (Mg/m3)
2.61 1.31
Table 2. Sample properties.
4.2 Signal calibration
Prior to testing, calibration of the bender element probes at the predetermined confining pressure of 100kPa was conducted. This was to determine the relationship between the intended input frequencies (generated by the function generator - 2, 4, 6, 8, 10 and 12 kHz) and the actual frequency delivered to the soil sample from the transmitting bender element probe. In each case the actual applied frequencies to the sample were slightly less than intended with the average frequencies being 1.89, 3.2, 5, 6.25, 8.4 and 9.6 kHz (respectively for those input frequencies listed above). However, please note that for clarity the results will be presented in terms of intended rather than measured frequency. Reasons for this observation may be attributed to some minor electrical losses in the function generator system but principally due to the stiffness of material being tested and the applied confining stress. Calibration to determine the actual signal frequencies was vital to ensure correct assessment of near field effects
Figure 6 shows a typical data set that was recorded for the purpose for a 100% kaolin specimen confined at an isotropic stress of 100kPa at intended frequencies of 2 kHz, 6kHz and 12 kHz. It is evident that at 2kHz there was significant distortion of the received waveform prior to the first major peak, therefore making accurate assessment of the actual shear wave arrival time difficult to determine.
Sample Bulk Density (Mg/m3) Dry Density (Mg/m3) w (%)
T1 1.743 1.269 37.32
T2 1.750 1.307 33.94
T3 1.691 1.295 30.59
[image:6.595.68.283.103.277.2]T4 1.612 1.256 28.30
Figure 5. Relationship between dry density and moisture content for Kaolin.
1.10 1.15 1.20 1.25 1.30 1.35 1.40
20 22 24 26 28 30 32 34 36 38 40 42 44 46 48 50
D ry d e n s it y ( M g /m 3 )
Moisture Content (%) Trial Compaction Samples
Test Samples Saturation line 0% 5% 10% Compaction curve 50 40 30 20 10 0 10 20 30 40 50 10 8 6 4 2 0 2 4 6 8 10
0 0.5 1 1.5 2 2.5 3
O u tv o lta g e (m V ) In p u t V o lt a g e (V )
Time (ms)
2kHz Input Output 50 40 30 20 10 0 10 20 30 40 50 10 8 6 4 2 0 2 4 6 8 10
0 0.5 1 1.5 2 2.5
O u tv o lta g e (m V ) In p u t V o lt a g e (V )
Time (ms)
6kHz Input Output 50 40 30 20 10 0 10 20 30 40 50 10 8 6 4 2 0 2 4 6 8 10
0 0.5 1 1.5 2 2.5
O u tv o lta g e (m V ) In p u t V o lt a g e (V )
Time (ms)
12kHz
Input
[image:6.595.69.301.335.398.2]However, near field effects were less prevalent at frequencies of 6kHz and greater.
As previously discussed, the intended frequency of 6kHz was representative of an applied frequency of 5kHz.
This corresponded to an Rd ratio of 8.0 (refer to equation
3 and 4), based on an arrival time of 1.59x10⁻³ seconds
(peak to peak) for the sample height of 200mm accounting for length corrections due to bender element protrusion. For the indented frequency of 2kHz (actual
1.89kHz) the Rd ratio was 2.8. This confirms previous
findings reported by Sanchez-Salinero et al. (1986) and
Jovičić et al. (1996). Figure 6 also highlights the
attenuation of the received wave with increasing frequency. At higher frequencies the wave form is less pronounced and is more sensitive to signal background noise. It has been suggested that higher frequencies are more appropriate for frequency domain interpretation techniques as the analysis focuses on the spectral frequency breakdown and phase shifts. Furthermore, high frequencies are often required for tests conducted in stiffer material. In conclusion, for any given soil the optimal input signal frequency is that which maximises the amplitude of the received signal whilst minimising the near field effects. For this reason a 6kHz intended input signal was chosen for the present investigation.
4.2 Triaxial setup and bender element test
Compacted samples were placed onto the triaxial pedestal in preparation for axial compression. Specially fabricated porous discs were used with the pedestal and top cap that fitted around the collar of the 20mm diameter brass cup containing the bender probes. Extreme care was taken to ensure correct alignment of the bender element probes as incorrect alignment would significantly reduce the quality of the received signal. A rubber membrane was placed around the sample and sealed using o-rings. The top of the triaxial chamber was located, filled with water and the required confining pressure applied. A period of 15 minutes was allowed prior to the allocation of axial load to allow the sample pore pressure to stability at the end of which initial shear wave velocity measurement at 6kHz input frequencies were recorded for signal calibration purposes. The load cell was then lowered into contact with the sample and the external LVDT connected. Unconsolidated undrained compression tests for each specimen were conducted at a confining pressure of 100kPa at a strain rate of 1mm/min. Shear wave velocity measurements were recorded during compression at axial strains of 2%, 4%, 6% 8% and 10% and 12% at which point tests were terminated due to the limiting stroke length of the apparatus.
5 EXPERIMENTAL RESULTS AND DISCUSSION
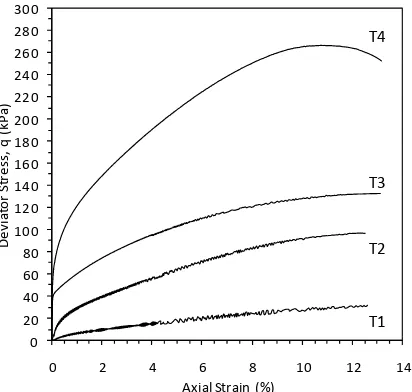
The stress-strain response of each specimen at the various moisture contents is shown in Figure 7 in terms of
deviator stress (q: kPa) and axial strain ( v: %). It is
evident from Figure 7 that a wide range of sample strengths were produced ranging from a deviator stress (allowing for area correction) of 31 kPa for sample T1,
mixed at a water content of 28%, to 266 kPa for sample T4, mixed at the water content of 38%. It is observed in Figure 7 that specimen T4 was the only sample to exhibit a peak deviator stress. This is attributed to the brittle natural of this sample arising from its low moisture content. Furthermore, bulging (barrelling) was observed for samples T1 and T2, compacted wet of optimum and close to the optimum moisture content. In this regard the stress strain responses are consistent with this observation showing a gradual increase in strength with the development of full plasticity occurring at
approximately v =10%.
The undrained shear strength (cu) of each sample
evaluated from the triaxial stress - strain response is listed in Table 3. Hand vane shear strength measurements at the top and bottom of each sample were also recorded after compression. The average value is also shown in Table 3. The undrained shear strengths for both methods of assessment are in reasonable agreement and therefore provides confidence in the values of sample shear strength correlated with shear wave velocity.
[image:7.595.322.528.242.438.2]
Table 3. Sample shear strengths from triaxial compression tests and hand vane tests.
As part of the investigation the variation of shear wave velocity was measured during triaixial compression with
Sample cu Triaxial (kPa) cu Hand Vane (kPa)
T1 15.5 15.0
T2 48.5 54.0
T3 66.0 64.0
T4 133.0 120.0
0 20 40 60 80 100 120 140 160 180 200 220 240 260 280 300
0 2 4 6 8 10 12 14
D
e
v
ia
to
r
S
tr
e
ss
,
q
(k
P
a
)
Axial Strain (%)
T4
T1 T2 T3
[image:7.595.310.543.591.660.2]increasing axial strainof 2, 4, 6, 18 and 10%. This data is presented in Figure 8. Prior to the application of load
( v=0%) the initial shear wave velocity at the confining
pressure of 100kPa varied from 98m/s to 185m/s for samples T1 and T4 respectively. It is evident from Figure 8 that wave velocity continues to increase for a sample compacted dry of the optimum moisture content less that the maximum bulk density (T2). This observation highlights the role of suction in controlling sample stiffness and hence the development of higher shear wave velocity in partially saturated soils. At moisture contents dry of optimum, suction enhances the stiffness of the soil structure by increasing particle contact stresses. As the sample is confined at an isotropic pressure of 100kPa these stresses are well developed; therefore, the soil skeleton strengthens, compressibility reduces and hence shear wave velocity increases. Due to the lack of suction measurement the above hypothesis cannot be confirmed; however, similar effects have been reported by Cho and Santamarina (2001) and Claria and Rinaldi (2007).
During axial compression an increase in shear wave velocity was observed with increasing axial strain (Figure 8). Note that the shear wave velocity values presented in Figure 8 are normalised velocities and remove the effect of sample shortening arising from axial compression. Furthermore, samples were loaded under undrained conditions. This rate of increase in shear wave velocity is more pronounced in dryer samples and reduces with increasing sample moisture content. As correction for sample height is incorporated and no consolidation was possible (undrained tests), it would indicate that increasing velocities are as a result of sample densification by compression. The potential for densification is reduced at higher moisture contents as both the soil particles and water are relatively incompressible compared to entrapped air. Sample T1 has a high degree of saturation and therefore less
potential to undergo densification. This is confirmed by the observations from sample T1 where little change was observed in the wave velocity with increasing axial strain.
Figure 9 presents the correlation of undrained shear strength determined by triaxial compression and hand shear vane measurement with shear wave velocity recorded before and during axial compression. The wave
velocities recorded prior to shear ( v =0%) indicate that a
linear relationship exists between cu and Vs. This is similar
to findings reported by other investigators (Hiraide et al 1996, Porbaha, et al 2005 and Chan, 2006); however, it is important to highlight that a single unique relationship for all cases is not established as shear wave response is dependant on soil type, soil structure, stress history and confinement. The effect of stress history is emphasised by the wave velocity measurements recorded during the shearing stage whereby at increasing strain wave velocity increases due to the densification process previously described. Is it interesting to note that at 12% strain the rate of increase in wave velocity decreases for the higher strength sample tested. T4 was the only sample to generate a distinctive peak in the stress strain curve. As shear strength is mobilised and full plasticity is developed, sample strength is best represented by the residual strength parameter, hence the convergence towards the
initial correlation of undrained shear strength ( v = 0%).
This may indicate that irrespective of stress history a unique linear relationship for undrained shear strength may exist for residual conditions. In this respect further work is ongoing to evaluate initial and post peak strengths in correlation with shear wave velocity.
6 CONCLUSIONS
[image:8.595.320.523.146.337.2]In this work, shear wave velocity of compacted kaolin clay at various moisture contents was measured under
Figure 9. Relationship between undrained shear strength and shear wave velocity.
80 100 120 140 160 180 200 220 240
0 20 40 60 80 100 120 140 160
W
a
v
e
V
e
lo
c
ity
(m
/s
)
Undrained Shear Strength (kPa) Triaxial 0% Axial Strain
Triaxial 12% Axial Strain
Hand Vane 0% Axial Strain
[image:8.595.76.280.326.508.2]Hand Vane 12% Axial Strain
Figure 8. Variation of shear wave velocity with axial strain during undrained triaxial compression.
0 20 40 60 80 100 120 140 160 180 200 220 240
0 2 4 6 8 10 12 14
W
a
v
e
V
e
lo
c
it
y
(m
/s
)
Axial Strain (%)
isotrophic confinement and during undrained compression tests. Difficulties relating to signal interpretation were reported by initial calibration of the bender elements probes at frequencies ranging from 2kHz to 12kHz. This highlighted the presence of near field effects at low frequencies (2kHz); however, determined near field effects could be significantly reduced at higher
frequencies above 6kHz corresponding to an Rd ratio of 8.
The influence of saturation ratio and suction on wave velocity was also discussed and further work is continuing
in this regard. A linear relationship of cu and Vs was
presented at v = 0%. It was also noted that at large
strains the post peak wave velocity measurements
decreased and appear to converge toward the initial v =
0% linear relationship. Again further work is ongoing to evaluate initial and post peak strengths in correlation with shear wave velocity.
REFERENCES
Arroyo, M. 2001. Pulse Tests In Soil Samples. Ph.D.
Thesis, University of Bristol.
Arulnathan, R., Boulanger, R.W. and Riemer, M.F. 1998. Analysis of bender element tests. ASTM Geotechnical Testing Journal, 21(2): 120-131.
Bates, C.R. 1989. Dynamic soil property during triaxial
testing. Géotechnique, 39(4): 721-726.
Bodare, A. and Massarch, K.R. 1984. Determination of shear wave velocity by different cross hole methods. Proceedings, Eight World Conference on Earthquake Engineering, San Francisco, California. 3: 39-45. Brignoli, E.G.M., Marino, G. and Stokoe, K.H. 1996.
Measurement of shear waves in laboratory specimens
by means of piezoelectric transducers. ASTM
Geotechnical Testing Journal, 29(4): 384–397. Brocanelli, D. and Rinaldi, V. 1998. Measurement of
low-strain material damping and wave velocity with bender
elements in the frequency domain. Canadian
Geotechnical Journal, 35(6),1032-1040.
Chan, C.M. 2006 A laboratory investigation of shear wave
velocity in stabilised soft soils. Ph.D. Thesis, University
of Sheffield.
Clayton, C.R.I., Theron, M. and Best, A.I. 2004. The measurement of vertical shear-wave velocity using side-mounted bender elements in the triaxial
apparatus. Géoechnique, 54(7): 495-498.
Dyvik, R. and Madshus, C. 1985. Lab measurements of
Gmax using bender elements. Proceedings of the
conference on the Advances in the Art of Testing Soil under Cyclic Conditions. ASCE Geotechnical Engineering Division, New York, 186-196.
Fam, M. and Santamarina, C. 1995. Study of geoprocesses with complementary mechanical and electromagnetic wave measurements in an
oedometer. ASTM Geotechnical Testing Journal,
18(3) 307-314.
Hiraide, A., Baba, K. and Azuma, H. 1996. Quality assessment of stabilized soil by S-wave logging. Proceedings of the 2nd. International Conference on Ground Improvement Geosystems (IS-Tokyo’96), Tokyo, Japan, 603-606.
Jovičić V., Coop, M.R. and Simic, M. 1996. Objective
criteria for determining Gmax from bender element
tests. Géotechnique, 46(2): 357-362.
Lawrence, F.V. 1963. Propagation of ultrasonic waves
through sand. Research Report R63-8, Massachusetts
Institute of Technology, Cambridge, MA.
Lawrence, F.V. 1965. Ultrasonic shear wave velocity in
sand and clay. Research Report R65-05, Soil
Publication No. 175, Massachusetts Institute of Technology, Cambridge, MA.
Lee, J.S. and Santamarina, J.C. 2005. Bender Elements:
Performance and Signal interpretation. Journal of
geotechnical and geoenviromental engineering ASCE, 1063-1070.
Leong, E.C., Yeo, S.H. and Rahardjo, H. 2005. Measuring
shear wave velocity using bender elements. ASTM
Geotechnical Testing Journal, 28(5).
Lings, M.L. and Greening, P.D. 2001. A novel bender/extender for soil testing.
Géotechnique, 51(8): 713–717.
Mancuso, C. and Vinale, F. 1988. Propagazione delle onde sismiche: teoria e misura insito. Atti del Convegno del Gruppo Nazionale di Coordinamento per gli Studi di Ingegneria Geotecnica, Monselice, Rome: Consiglio Nazionale delle
Ricerche. 115-138.
Pennington, D.S., Nash, D.F.T. and Lings, M.L. 2001. Horizontally mounted bender elements for measuring anisotropic shear moduli in triaxial clay specimens. ASTM Geotechnical Testing Journal, 24(2):133-144. Porbaha, A., Ghaheri, F. and Puppala, A.J. 2005. Soil
cement properties from borehole geophysics correlated with laboratory tests. Proceedings of the International Conference on Deep Mixing Best Practice and Recent Advances, Stockholm, Sweden, 1: 605-611.
Sanchez-Salinero, I., Roesset, J. M., and Stokoe, K. H. 1986. Analytical studies of body wave propagation and
attenuation. Report GR 86-15, Civil Engineering
Department, University of Texas at Austin, TX. Shirley, D.J. 1978. An improved shear wave transducer.
The Journal of the Acoustical Society of America. 63(5): 1643-1645.
Shirley, D.J. and Hampton, L.D. 1978. Shear wave
measurements in laboratory sediments. The Journal of
the Acoustical Society of America. 63(2), 607-613. Viggiani, G. and Atkinson, J.H. (1995). Interpretation of
bender element tests. Géotechnique, 45(1): 149–154.
Yesiller, N., Hanson, J.L. and Usmen, M.A. 2000. Ultrasonic assessment of stabilised soils. Soft Ground
Technology- Proceedings of the Soft Ground
Technology Conference, Noordwikerhout,