White Rose Research Online
eprints@whiterose.ac.uk
Universities of Leeds, Sheffield and York
http://eprints.whiterose.ac.uk/
This is the published version of an article in the
Quarterly Journal of the Royal
Meteorological Society, 135 (638)
White Rose Research Online URL for this paper:
http://eprints.whiterose.ac.uk/id/eprint/76620
Published article:
Flamant, C, Knippertz, P, Parker, DJ, Chaboureau, JP, Lavaysse, C,
Agusti-Panareda, A and Kergoat, L (2009)
The impact of a mesoscale convective
system cold pool on the northward propagation of the intertropical discontinuity
over West Africa.
Quarterly Journal of the Royal Meteorological Society, 135
(638). 139 - 159. ISSN 0035-9009
The impact of a mesoscale convective system cold pool on
the northward propagation of the intertropical discontinuity
over West Africa
C. Flamant,
a* P. Knippertz,
bD. J. Parker,
cJ.-P. Chaboureau,
dC. Lavaysse,
aA. Agusti-Panareda
eand L. Kergoat
faService d’A´eronomie/Institut Pierre-Simon Laplace, Universit´e Pierre et Marie Curie and CNRS, Paris, France bInstitute for Atmospheric Physics, University of Mainz, Germany
cSchool of Earth and Environment, University of Leeds, UK
dLaboratoire d’A´erologie, Universit´e Paul Sabatier and CNRS, Toulouse, France eEuropean Centre for Medium-Range Weather Forecasts, Reading, UK fUniversit´e Paul Sabatier, Centre d’ ´Etudes Spatiales de la Biosph`ere, Toulouse, France
ABSTRACT:The interaction between a mesoscale convection system cold pool and the intertropical discontinuity (ITD) is investigated on two consecutive days (5 and 6 June 2006), in the framework of the African Monsoon Multidisciplinary Analysis Special Observing Period (SOP 1a). Satellite imagery and surface meteorological observations are used to track the movement of the ITD prior to and after its interaction with the cold pool. The impact of the northward propagating cold pool on the Sahelo-Saharan planetary boundary layer (PBL) thermodynamics and aerosol vertical distribution is analyzed by means of airborne and ground-based measurements over the two-day period. Complementary European Centre for Medium-range Weather Forecasts (ECMWF) analyses are also used. The influence of the cold pool persists as a coherent dynamic and thermodynamic structure over these two study days, influencing a front at least 1000 km long and approximately 200 km wide, spreading across southern Mali. Dropsonde measurements revealed that the cold pool was bringing moisture quite far north over the northern Sahel and to the southern fringes of the Sahara, as well as cooling the desert surface. As a result, the vertical development of the Sahelo-Saharan PBL was found to be delayed on 6 June compared with 5 June. Further north, over the part of the Sahara not impacted by the propagating cold pool, the airborne measurements suggest that the large amounts of dust in the upper part of the Saharan aerosol layer, as observed by lidar, may also have had an impact on the Saharan PBL, by reducing the insolation in this region. The airborne observations were also used to assess the quality of the ECMWF analyses at 1200 UTC on 5 and 6 June, as well as+36 h,+24 h and+12 h forecasts valid at 1200 UTC on 6 June. A quantitative improvement was seen in the 6 June forecast valid at 1200 UTC once information relevant to the propagation of the ITD was assimilated, i.e. for the+24 h and+12 h forecasts. The analyses were able to reproduce the northward surge of moisture associated with the cold pool, suggesting that ECMWF analyses may be used to analyze the role of propagating density currents on the so-called monsoon onset mechanism. Copyright c2009 Royal Meteorological Society
KEY WORDS density currents; monsoon; harmattan; airborne lidar; dropsondes; ECMWF analyses; SEVIRI imagery; AMMA
Received 4 July 2008; Revised 4 November 2008; Accepted 17 November 2008
1. Introduction
The intertropical discontinuity (ITD) marks the surface position of the interface between the cool, moist south-westerly monsoon flow and the hot, dry northeasterly harmattan flow. This region, generally characterised by strong convergence and low pressures in the low levels, is also referred to as the monsoon trough in the literature (e.g. Buckle, 1996). The ITD is a synoptic-scale feature whose position is closely linked to pressure gradients across West Africa (Hastenrath, 1991; Buckle, 1996).
∗Correspondence to: C. Flamant, Service d’A´eronomie, Institut
Pierre-Simon Laplace, Tour 45, Boite 102, Universit´e Pierre et Marie Curie, 4 Place Jussieu, 75252 Paris Cedex 05, France.
E-mail: cyrille.flamant@aero.jussieu.fr
It exhibits a marked latitudinal displacement over West Africa in the course of the year, between the Sudan zone (north of the Guinea Coast) in February and nearly 20◦N in August (e.g. Dettwiller, 1965). As the ITD migrates, it brings with it a range of contrasting weather activity, making these seasonal movements of the utmost importance for determining the weather at any particular place (Buckle, 1996). The weather associated with the migration of the ITD varies with the depth of the monsoon moist air (e.g. Buckle, 1996). Near the ITD, the depth of moist air is quite shallow, so that significant rainfall is rare.
as well as due to variations of the main pressure systems, especially the subtropical highs (e.g. Libyan high), or in response to the passage of disturbances moving east through the Mediterranean. On a given day, the ITD is generally best defined (i.e. the density gradient across the monsoon–harmattan interface is sharpest) during the night and before sunset.
Furthermore, the position of the ITD can be sig-nificantly modified through interactions with cold-pool outflows associated with mesoscale convective systems (MCSs, forming south of the ITD), which can propa-gate quickly northward and may eventually catch up with the monsoon–harmattan density front. Over the Sahel, upon reaching the ITD, the cold-pool outflows further enhance the density gradient with the dry, hot harmat-tan air, which in turn leads to acceleration of the newly defined interface. As a result, the ITD/cold pool can prop-agate northward rapidly for some distance. The distance of propagation is a function of the density gradient, but also the time of day at which the density current forms, as daytime heating is likely to weaken this type of feature (e.g. Rosset al., 2004).
The ITD displacements at the annual, synoptic and diurnal scales have been the focus of the work of meteorologists interested in the West African climate in the 1940s through to the 1960s (Hastenrath, 1991). Likewise, MCS-related cold pools have received a lot of attention (e.g. Knippertz et al., 2007; Miller et al., 2008, and references therein). However, the interactions between MCS cold pools and the ITD have not been investigated much (e.g. Flamant et al., 2007, hereafter F07; Marsham et al., 2008). Improved knowledge of these interactions is of paramount importance as MCS-related density currents propagating to and subsequently deforming the ITD over the Sahel and the Sahara should have a profound impact on the energy budget of the Sahelian and Saharan PBLs (with moistening and cooling of the desert surface). Furthermore, they could play a role in the so-called monsoon onset by favouring the northward progression of the monsoon through complex land–atmosphere interactions.
In addition, the nocturnal monsoon flow (which behaves as a density current, e.g. Bou Karamet al., 2008), as well as cold pools associated with MCSs propagating over the Sahel (e.g. Sterk, 2002; F07; Marsham et al., 2008) offer the most efficient mechanism for dust lift-ing, particularly at the beginning of the monsoon season, before the growing vegetation rapidly inhibits local dust emission. The resulting large dust loads may, in turn, have important implications for the radiation budget over West Africa and on the West African Monsoon system during the summer.
This paper is the second of a series of publications analysing aircraft observations (airborne lidar and dropsondes) from a sequence of flights performed in the framework of the AMMA SOP (African Monsoon Multidisciplinary Analysis Special Observing Period; Redelsperger et al., 2006) with the SAFIRE (Service des Avions Franc¸ais Instrument´es pour la Recherche en
Environnement) Falcon 20 (F/F20) between 4 and 7 June 2006.
In the course of the 5 June mission, the F/F20 flew in the wake of (behind, and to the east of) an unforecasted convective system initiated north of Niamey, Niger, close to the Niger–Mali border and south of the ITD. F07 described the vertical structure of the northward propagating MCS cold pool over Mali. They also detailed the atmospheric stratification and thermodynamics to the north and away from the density current. They showed that, over the desert, the atmosphere exhibited a two-layer structure, with a growing, well-mixed 2 to 2.5 km deep internal convective boundary layer (IBL) capped by a stable, approximately 3 km deep residual layer, these two layers comprising the Saharan PBL. Dropsonde measurements showed that the density current was characterized by water vapour mixing ratios in excess of 8 g kg−1, while very dry conditions were observed over the Sahara (4 g kg−1or less).
The objectives of the present paper are: (i) assess the impact of the propagating density current observed during the 5 June mission on the thermodynamics of the Sahelian and Saharan PBLs, as well as on aerosol vertical distribution observed during the 6 June mission; (ii) study the disturbance of the ITD by the cold pool on 5 and 6 June; and (iii) provide insight into the representation of this process in the European Centre for Medium-Range Weather Forecasts (ECMWF) analyses and forecasts.
To the authors’ best knowledge, this paper details the first airborne lidar and dropsonde measurements of MCS-related cold pools and their impact on the thermo-dynamics and aerosol vertical distribution, as they prop-agate over northern Sahel and Sahara on two consecutive days.
The remainder of the paper is organized as follows: after describing, in section 2, the data utilized in this study, we focus on the synoptic situation (section 3). In section 4, we examine the position of the ITD and of a propagating MCS cold pool, their interaction, and the related dust emission and transport using satellite imagery and surface data. Section 5 focuses on the airborne observations and the analysis of the impact of the propagating cold pool on the vertical structure of the thermodynamics and aerosol fields over the Sahel and the Sahara. The impact on the surface energy budget is also investigated. In section 6, we examine the impact of synoptic station data assimilation in the ECMWF model. The airborne observations are compared to ECMWF analyses and forecasts with different lead times. The paper concludes with a summary and a discussion in section 7.
2. Data
level (agl; 6070 m above mean sea level, asl) and 6800 m agl (7070 m asl) on 5 and 6 June, respectively. The missions were performed in the early afternoon, between 1300 and 1530 UTC (1330 and 1600 UTC) on 5 June (6 June), during which time the convective mixed layer is typically growing relatively slowly. One of the objectives of the missions was to document the vertical structure and the thermodynamics of the Sahelian and Saharan PBLs, together with the aerosol distribution. Another objective was to provide insight into the structure of the ITD, using the high horizontal and vertical resolution lidar-derived atmospheric reflectivity field, together with temperature, water vapour and wind profiles derived from dropsondes. The sampling of the MCS cold pool north of Niamey on 5 June was fortuitous. On the other hand, the decision to fly the same track on 6 June was dictated by the goal of measuring the density current impact of Sahelian and Saharan PBLs.
The F/F20 was equipped with the airborne differential absorption lidar LEANDRE 2 (Bruneauet al., 2001; F07) and a 4-channel dropsonde system, the Airborne Vertical Atmospheric Profiling System. The high-resolution (15 m in the vertical and 1.5 km in the horizontal) lidar-derived atmospheric reflectivity (at 730 nm) is mostly sensitive to aerosols with radii ranging from 0.1 to 5µm, and hence to dust aerosols (e.g. F07). Furthermore, reflectivity is sensitive to aerosol optical properties and concentration,
to be hygrophobic (e.g. Fan et al., 2004). Therefore, reflectivity associated with desert dust is generally not expected to be sensitive to relative humidity fluctuations, and hence is a good proxy for dust concentration in the atmosphere. Ten dropsondes were released during the 5 June mission; four on the way to northern Niger and six on the way back to Niamey (Table I). Eight dropsondes were released during the 6 June mission; four on the way to northern Niger and four on the way back to Niamey (Table II). The dropsonde data have been processed with the latest release of the Atmospheric Sounding Processing Environment software (version 2.6.5 of July 2006) to provide information on the wind, temperature and water vapour fields. The dropsonde data were not put on the Global Transmission System and therefore were not assimilated in the 5 and 6 June ECMWF analyses.
[image:4.595.78.528.440.618.2]Surface measurements made in Agoufou, Mali (1.48◦W, 15.34◦N), Gao, Mali (0◦E, 16.25◦N) and Bamba, Mali (1.4◦W, 17.1◦N) (referred to as SOP stations) as well as data from the synoptic (SYNOP) stations of the West African Meteorological Offices are used to track the position of the ITD and of the cold pool over Niger, Mali, Burkina Faso and Mauritania (Figure 1 shows the location of the stations). The stations at Agougou and Bamba were deployed in the framework of AMMA and provided a full suite of measure-ments of meteorology, radiation and turbulence with a
Figure 1.(a) Map of North and West Africa with main orographic features labelled in italics. The grey shading indicates terrain height above mean sea level (m): 650, 1000 and 1500 m from light to dark grey. The bold dashed line represents the F/F20 flight track on 5 and 6 June 2006. Diamonds indicate surface stations deployed in the framework of the SOP (high temporal resolution). Ouaga = Ouagadougou and B-F = Burkina Faso. (b) expands the F/F20 operation region denoted by the dash-dotted box in (a). Crosses indicate the position of synoptic (SYNOP)
stations, and diamonds have the same meaning as in (a).
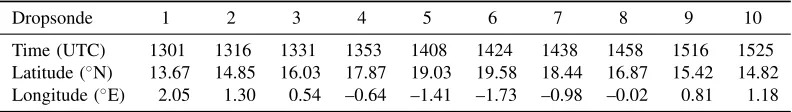
Table I. Dropsonde release times and positions along the F/F20 flight track on 5 June 2006.
Dropsonde 1 2 3 4 5 6 7 8 9 10
Time (UTC) 1301 1316 1331 1353 1408 1424 1438 1458 1516 1525
[image:4.595.105.501.698.754.2]Table II. Dropsonde release times and positions along the F/F20 flight track on 6 June 2006.
Dropsonde 1 2 3 4 5 6 7 8
Time (UTC) 1336 1358 1413 1435 1449 1503 1521 1537
Latitude (◦N) 13.62 14.83 16.06 17.87 19.03 18.34 16.81 15.43
Longitude (◦E) 2.52 1.32 0.54 –0.64 –1.41 –0.98 –0.02 0.82
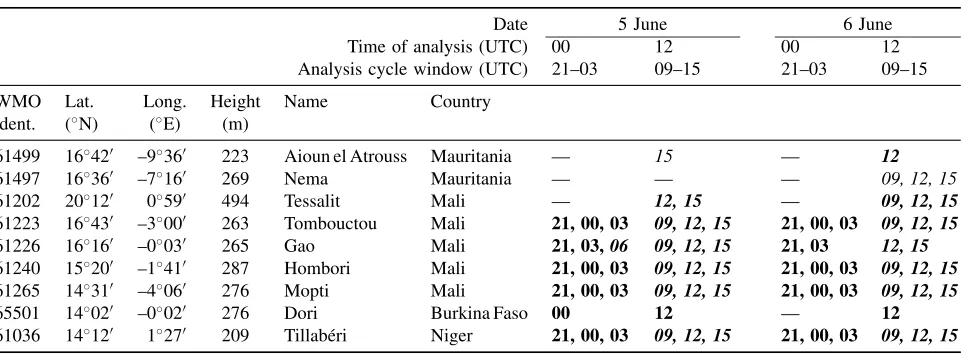
Table III. Details of synoptic stations used in this study. The time of the pressure (RH) measurement assimilated in the analysis cycle window appears in bold (italic). When both pressure and RH are assimilated, times appear in italic bold.
Date 5 June 6 June
Time of analysis (UTC) 00 12 00 12
Analysis cycle window (UTC) 21–03 09–15 21–03 09–15
WMO Lat. Long. Height Name Country
ident. (◦N) (◦E) (m)
61499 16◦42 –9◦36 223 Aioun el Atrouss Mauritania — 15 — 12
61497 16◦36 –7◦16 269 Nema Mauritania — — — 09, 12, 15
61202 20◦12 0◦59 494 Tessalit Mali — 12, 15 — 09, 12, 15
61223 16◦43 –3◦00 263 Tombouctou Mali 21, 00, 03 09, 12, 15 21, 00, 03 09, 12, 15
61226 16◦16 –0◦03 265 Gao Mali 21, 03,06 09, 12, 15 21, 03 12, 15
61240 15◦20 –1◦41 287 Hombori Mali 21, 00, 03 09, 12, 15 21, 00, 03 09, 12, 15 61265 14◦31 –4◦06 276 Mopti Mali 21, 00, 03 09, 12, 15 21, 00, 03 09, 12, 15
65501 14◦02 –0◦02 276 Dori Burkina Faso 00 12 — 12
61036 14◦12 1◦27 209 Tillab´eri Niger 21, 00, 03 09, 12, 15 21, 00, 03 09, 12, 15
15-minute temporal resolution. Surface sensible heat flux measurements performed at Eguerit (located 15 km from Agoufou) are used to complement the surface energy budget analysis in the vicinity of Agoufou. The station at Gao, also deployed for AMMA (Bocket al., 2008), pro-vided pressure and temperature measurements together with GPS-derived integrated water vapour content with a 15-minute resolution. The synoptic stations provided 3-hourly measurements (at best) of pressure, wind, tem-perature, humidity and visibility. The stations discussed in the following are listed in Table III. Data from a sunphotometer deployed at Agoufou in the framework of AERONET (Aerosol Robotic Network) are also used. In addition to the surface observations, the position of the leading edge of propagating MCS cold pools is mon-itored by tracking the northern edge of dust storms over North and West Africa using Meteosat Second Gener-ation (MSG) Spinning Enhanced Visible and Infra-Red Imager (SEVIRI) images produced from a combination of three infrared channels, namely channel 10 (12µm), channel 9 (10.8µm) and channel 7 (8.7µm). False-colour images were created using an algorithm similar to that used by EUMETSAT, which colours red the difference between the 12.0 and 10.8µm channels, green the dif-ference between the 10.8 and 8.7µm channels and blue the 10.8µm channel (e.g. Slingoet al., 2006; Schepanski
et al., 2007). On these composite images, dust appears pink or magenta.
Finally, the representation of the ITD and of propagat-ing density currents in the ECMWF data are investigated using analyses as well as+36 h, +24 h and +12 h fore-casts.
3. Synoptic situation on 5 and 6 June 2006
The synoptic situation on 5 June is detailed in F07. It is only briefly summarized here and illustrated on the basis of the 0600 UTC ECMWF analysis on 5 June (Figure 2). The mean sea level pressure field over North Africa is dominated by a high pressure system over the Mediter-ranean, centred on the coasts of Tunisia and Libya, which leads to a strong, meridionally oriented pressure gradi-ent north of the Hoggar. Associated with this pressure pattern, strong northeasterly low-level winds are seen at 925 hPa over Libya and around the northern and western flanks of the Hoggar (Figure 1 provides details of the orographic features). These strong winds are persistent throughout 5 and 6 June, and are seen to be stronger at 0600 UTC, as generally observed in this region (Parker
[image:5.595.54.535.182.360.2]Figure 2.ECMWF analysis at 0600 UTC on 5 June 2006, showing wind speed (colour shading, m s−1) and vectors at 925 hPa with overlaid
surface pressure contours (bold black lines) with interval 4 hPa. This figure is available in colour online at www.interscience.wiley.com/journal/qj
structure of the upper-level trough does not change sig-nificantly.
4. Observations of the ITD and of MCS cold pools
4.1. Identification of the ITD and MCS cold pools from surface meteorological stations
Difficulties in comparing different analyses of the ITD reported in the literature are related to the choice of dynamic (wind-based) versus thermodynamic criteria, and the diurnal variations (in part discussed by Leroux, 1970). On horizontal maps, the ITD is usually marked by a line, the position of which is determined by mete-orologists from surface dew-point temperature and wind direction measurements (e.g. Buckle, 1996; Laforeet al., 2007). Dettwiller (1965) used a dew-point temperature between 15 and 20◦C as a criterion to map the varia-tion of the monthly mean posivaria-tion of the ITD between the Equator and 30◦N (along about 0–5◦E longitude). Buckle (1996) defines the ITD using the 14◦C dew-point temperature criterion, with air to the north (south) of the ITD being characterized by dew-point temperature’s less than (in excess of) 14◦C and northerly to easterly (southerly to westerly) winds. In the framework of the AMMA project, the forecasters used three criteria to pro-vide daily forecasts of the ITD position at 0600 UTC to the SOP scientists: near-surface convergence, a dew-point temperature of 15◦C, and pressure which should exhibit a local minimum at the ITD (Laforeet al., 2007).
The ITD is generally best defined during the night when, in the absence of buoyancy-related turbulence in the PBL, the monsoon flow progresses northward, thereby leading to the existence of a sharp density gradient across the monsoon–harmattan interface. This is why the position of the ITD is generally presented at 0600 UTC on charts. In the daytime, the turbulence in the PBL tends to mix the opposing flows and thermodynamic layers in
the ITD region, thereby decreasing the density gradient across the monsoon–harmattan interface, and making it appear that the ITD is retreating south.
To illustrate this, we considered the diurnal evolution of the dew-point temperature at two stations (Gao and Agoufou) on 6 June (not shown). The ITD was north (but in the vicinity) of these stations and southerly to westerly winds were observed throughout the day. The dew-point temperatures are observed to fluctuate between 10◦C and 17.5◦C at Agoufou and between 8◦C and 15◦C at Gao. The largest dew-point temperatures occur between 1000 and 1200 UTC, while the minimum values are observed in the afternoon, between 1600 and 2000 UTC.
In the following, in order to track the ITD position over two days at 3-hourly intervals, we have used the 14◦C dew-point temperature criterion during the night but we have relaxed this criterion during the daytime, particularly in the afternoons. This is especially important for stations located in the vicinity of the ITD. The dew-point temperatures measured at stations remote from and south of the ITD do not exhibit such large fluctuations. We also used the wind direction criterion as in Buckle (1996) and Lafore et al.(2007).
At a given station, the passage of an MCS cold pool or density current is generally associated with a drop of temperature, an increase in pressure and a wind surge, in less than an hour (e.g. Simpson, 1987; Kochet al., 1991). For stations north (south) of the ITD, this is generally accompanied by an increase (decrease) of the near-surface water vapour mixing ratio, depending on the ambient moisture conditions at the surface. In stations over the Sahel and Sahara, the arrivals of density currents are also most often associated with dust uplift leading to a decrease of the near-surface visibility.
4.2. Locations of the ITD in the morning of 5 June
by station separations, from the stations’ temperature and wind observations (Figure 3). The ITD position is estimated from 2 m dew-point temperature measurements made by surface stations (both SYNOP and SOP). At 0000 UTC (Figure 3(a)), the ITD is observed to lie north of Bamako, Tillab´eri, and Niamey, but south of Mopti, Hombori, Agoufou, Gao and Agadez. At 0600 UTC (Figure 3(b)), the ITD has moved northward, past Mopti and Agadez, and is now close to Hombori and Agoufou. At 0900 UTC (Figure 3(c)), the ITD exhibits its northernmost position. It is now north of Hombori and Agoufou, while being still south of Tombouctou, Bamba and Gao. By 1200 UTC, the ITD has retreated slightly and is located over Hombori and Agoufou, while closing in on Mopti (still south of the ITD) and being south of Agadez. Hence, between 10◦W and 8◦E, the ITD is mainly observed to lie between 14◦N and 16◦N during the morning of 5 June.
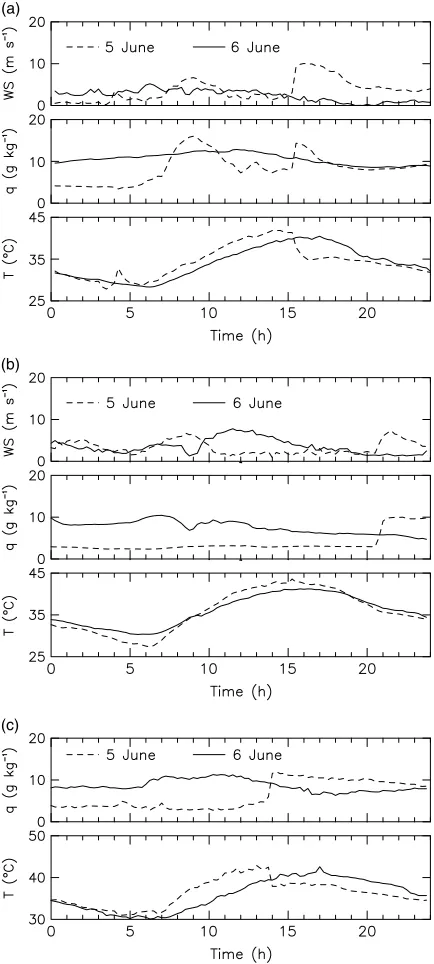
The influence of the advance and retreat of the ITD on near-surface conditions in the vicinity of the F/F20 flight track is observed at Agoufou (Figure 4(a)). Evidence of the arrival of the ITD is observed as early as 0600 UTC, in the form of an increase of water vapour mixing ratio (associated with an increase in dew-point temperature). Surface moistening is maximal at 0900 UTC at Agoufou, and is associated with a westerly wind surge. This is consistent with the fact that the ITD has moved past Agoufou at that time. The maximum wind speed around 0900 UTC is caused by the turbulence in the growing PBL which mixes downwards the momentum of the strong nocturnal low-level jet (Parker et al. 2005); the
jet is seen over Burkina Faso, western Niger and eastern Mali at 925 hPa on the 5 June ECMWF analysis at 0600 UTC, Figure 2. The surface measurements also suggest that the leading edge of the monsoon flow passing over Agoufou prior to 0900 UTC has the characteristics of a density current, which is consistent with the findings of Bou Karam et al. (2008). Finally, the decrease in water vapour mixing ratio after 0900 UTC is likely to be related to the turbulent mixing of this feature with the much drier harmattan air while the PBL is developing. Such pronounced drying is not observed further south (where the monsoon was established), confirming that the monsoon–harmattan interface is in the vicinity of Agoufou. It is worth noting that a very similar behaviour of the near-surface measurements is observed at Mopti during the same time period (Figure 5).
On the other hand, the near-surface measurements north of Agoufou, confirm that the ITD does not reach Bamba or Tombouctou (Figures 4(b) and 5, respectively). The increase in wind speed observed at Bamba around 0900 UTC is related to the downward mixing of the momentum from the strong harmattan flow over northern Mali (Figure 2).
4.3. Cold pools and their interactions with the ITD
[image:7.595.131.455.456.715.2]The MCS (in the wake of which the F/F20 flew on 5 June) initially developed in the vicinity of Tillab´eri and is seen in Figure 3(c). The Tillab´eri SYNOP station reported a thunderstorm at 0900 UTC on 5 June. The MCS started to propagate shortly after 0900 UTC, and is reported at
Figure 3.MSG/SEVIRI false-colour composite images (see text for details) at (a) 0000 UTC, (b) 0600 UTC, (c) 0900 UTC and (d) 1200 UTC on 5 June 2006. Dust appears pink or magenta, water vapour dark blue, thick high-level clouds red-brown, thin high-level clouds almost black and surface features pale blue or purple. The dashed line indicates the F/F20 track. 2 m dew point temperatures and 10 m winds (in the form of windbarbs) are overlaid for each of the SYNOP and AMMA stations when data are available. This figure is available in colour online at
Figure 4. SOP station measurements from (a) Agoufou (Mali), (b) Bamba (Mali), and (c) Gao (Mali). In (a) and (b), the measurements shown are (from top to bottom): wind speed (WS), water vapour mixing ratio (q), and temperature (T). In (c), water vapour mixing ratio and
temperature are shown.
1200 UTC at Dori (Figure 3(d)). The MCS then reached Ouagadougou around 1500 UTC (Figure 6(a)) and continued its route to southern Mali between 2100 UTC on 5 June and 03 UTC on 6 June and over the Ivory Coast after that time (Figures 6(c, d), and 7(a)).
High dust loads appearing in pink and magenta colours in the MSG/SEVIRI false-colour images are observed to be associated with the cold pool of this MCS from 1100 UTC on 5 June to 0600 UTC on 6 June (Fig-ures 3(a), 6(a–d), and 7(a, b)). There has been some discussion of the applicability of these images (as the dust effect on brightness temperature differences depends
Figure 5. Synoptic station measurements at Nema (Mauritania), Tombouctou and Mopti (Mali). From top to bottom: pressure, vis-ibility, wind barbs, wind speed, water vapour mixing ratio, and temperature. The vertical scale for the wind barbs panel is arbi-trary and is used only to separate the origin of the windbarbs from the different stations. This figure is available in colour online at
www.interscience.wiley.com/journal/qj
on its altitude, e.g. Pierangelo et al., 2004), suggesting that they may favour only dust which is elevated so that its radiating temperature differs significantly from the ground. In this case (and that of F07), the coincidence of the edge of the MSG/SEVERI dust pattern with sur-face observations and airborne lidar data confirms that the dust in the cold pool is lifted sufficiently to be apparent in the satellite imagery.
[image:8.595.316.538.72.409.2]Figure 6.As Figure 3, but at (a) 1500 UTC, (b) 1800 UTC, (c) 2100 UTC on 5 June and (d) 0000 UTC on 6 June. This figure is available in colour online at www.interscience.wiley.com/journal/qj
Figure 7.As Figure 3, but at (a) 0300 UTC, (b) 0600 UTC, (c) 0900 UTC and (d) 1200 UTC on 6 June. This figure is available in colour online at www.interscience.wiley.com/journal/qj
Nema between 0300 and 0600 UTC on 6 June (Fig-ures 5 and 7(a, b)). For example, the arrival of the density current observed around 1530 UTC at Agoufou is asso-ciated with a temperature drop of 4◦C, a water vapour mixing ratio increase of 6 g kg−1and a surge of the
south-southwesterly flow marked by an increase in wind speed of nearly 8 m s−1.
Furthermore, the SYNOP stations of Gao and Hombori reported dust mobilization at 1800 UTC (no observations
at 1500 UTC), while the Tombouctou station was reporting suspended dust haze (not mobilization) from 2100 UTC on. A dramatic drop in visibility was also observed at Mopti between 1800 and 2100 UTC (Fig-ure 5).
[image:9.595.134.451.362.614.2]of the Algeria, Mali and Niger borders (Figure 6(b)). The leading edges of the cold pools are clearly seen on 5 June at 1800 UTC (Figure 6(b)) to lie across the border between Algeria and Mali, and are marked by a sharp discontinuity in the colour composite from dark pink to light pink-blue. The leading edges are observed to propagate almost perpendicularly to the Algeria–Mali border towards Tessalit (near 20◦N just south of the Malian border) until 1200 UTC on 6 June (Figure 7(d)), but did not reach it.
In the afternoon of 5 June and in the morning of 6 June, the moist cold pool is observed to gradually cover the whole of southwestern Mali and the southern fringes of Mauritania, as attested by the increase in dew-point temperatures in these regions. Dew-point temperatures exceeding 14◦C at Nema observed between 0600 and 1200 UTC on 6 June, as well as the false-colour gradient, suggest the ITD is over Mauritania during that period (Figure 7). In the meantime, the ITD over central Mali is seen to retreat south, past Tombouctou and Bamba. Nevertheless, the relatively high dew-point temperatures (between 6 and 13◦C, Figures 7(b–d)) indicate that the ITD is still in the vicinity of these stations in the morning and early afternoon of 6 June, i.e. prior to aircraft operations on that day.
In conclusion, it appears that the large widespread cold pool associated with the MCS together with smaller con-vective cells to the northeast favoured the northwestward progression of the ITD over central and southwestern Mali as well as Mauritania.
5. The impact of the propagating cold pool on the Sahelo-Saharan PBL thermodynamics and aerosol vertical distribution
In this section, we discuss the impact of the propagating cold pool (also referred to as the density current) on the surface properties as well as on the lower troposphere. Airborne measurements are used to detail the evolution of the vertical structure, thermodynamics and aerosol distribution under the influence of the cold pool between midday on 5 June and midday on 6 June, and in a two-dimensional cross-section. Surface station measurements are used to assess the duration of the impact of the cold pool, in particular in the northern Sahel and Sahara.
5.1. Surface and near-surface conditions
The impact of the cold pool on the near-surface thermo-dynamics is evident at Agoufou (Figure 4(a)), where the water vapour mixing ratio values measured on 6 June lie between 10 and 13 g kg−1. These values are smaller than those observed at the passage of the density current (1500 UTC on 5 June). Nevertheless, the values observed on 6 June are much larger than those observed on 4 June
not shown). Likewise, the temperatures observed on 6 June are lower than on 4 and 5 (prior to the arrival of the ITD and the cold pool) and on 7 June. Similar behaviours are observed at Gao (Figure 4(c)) for both the temperature and the moisture trends.
At Bamba, further north, we do observe the impact of the density current in the near-surface moisture, just as at Agoufou and Gao (Figure 4(b)). However, the impact of the density current on the near-surface temperature on 6 June is not as drastic as in the other sites further south, possibly due to the late arrival of the density current, at a time when the ambient (pre-density current) air had cooled down after sunset, or due to the fact that the cold pool has undergone heating for most of the afternoon while propagating north (Smith et al., 1995; Knippertz et al., 2007). On the other hand, water vapour mixing ratio anomaly (with respect to the background state values characterizing the harmattan) associated with the passage of the density current remains distinguishable throughout 6 June. A similar behaviour is observed at Mopti (Figure 5).
5.2. Vertical structure of the Sahelo-Saharan PBL
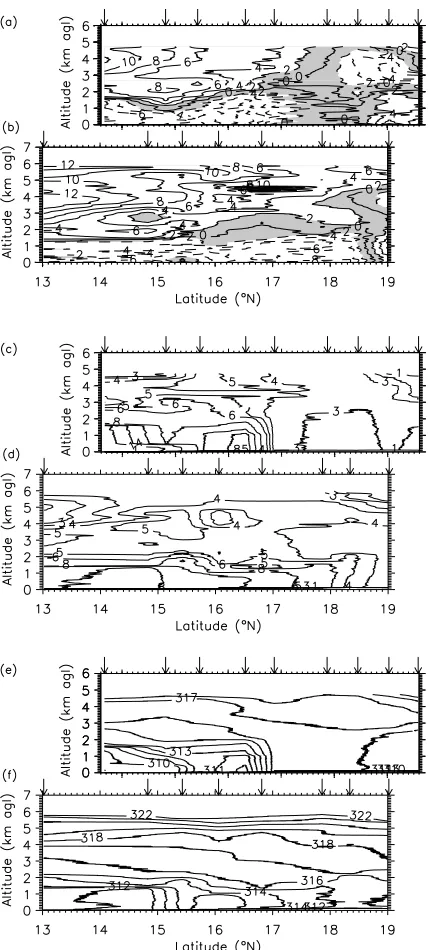
Using the lidar and dropsonde measurements made on 5 June, F07 showed that the leading edge of the cold pool, at the time of the aircraft operations, was located at 16.6◦N along the F20 track (Figure 8(a)). The cold pool is characterized by water vapour mixing ratios in excess of 8 g kg−1(Figure 8(c)), while very dry conditions are observed over the Sahara, north of 16.8◦N (4 g kg−1 or less, Figure 8(c)). The structure of the cross-track component of the wind measured by the dropsondes also exhibits the characteristics of a density current, with the deeper head region between 16◦N and 16.6◦N and a shallower wake region south of 15.5◦N (Figure 8(a)). North of the cold-pool leading edge, a region of relatively calm winds is observed which separates the monsoon from a core of moderate low-level northeasterly winds (Figure 8(a)). This region of relatively calm winds is where the warmest and driest air masses are observed on that day along the track (Figure 8(e)). It is also the region where the atmosphere exhibits a two-layer structure, with a growing, well-mixed 2 to 2.5 km deep IBL capped by an approximately 3 km deep Saharan aerosol layer (SAL), which showed weak but positive stability.
The dropsonde measurements on 6 June show that the leading edge of the cold pool (as determined from the transverse wind field, comparing Figures 8(a, b)) propagated from 16.8◦N to 18.6◦N in 24 hours along the F/F20 flight track; this amounts to nearly 170 km, in the direction nearly normal to the front.
Near-surface moistening is observed north of 16.8◦N, as illustrated by the northward progression of the 4 g kg−1
Figure 8.Dropsonde-derived vertical cross-sections of the wind com-ponent perpendicular to the F/F20 track on (a) 5 June and (b) 6 June, water vapour mixing ratio on (c) 5 June and (d) 6 June, and potential temperature on (e) 5 June and (f) 6 June. The wind component per-pendicular to the flight track has a contour interval of 2 m s−1. Positive
(negative) velocity values and solid (dashed) lines are indicative of a flow entering (exiting) the cross-section. The grey area indicates regions where the wind speed is between –2 and 2 m s−1. The water vapour
mixing ratio contour interval is 1 g kg−1 between 1 and 6 g kg−1, and 2 g kg−1 between 6 and 14 g kg−1. The potential temperature contour
interval is 1 K. The arrows indicate the locations of dropsondes released along the transects. The latitude scale is the same for the two panels, the panels being shifted to facilitate the interpretation of the evolution
of the thermodynamics fields between 5 and 6 June.
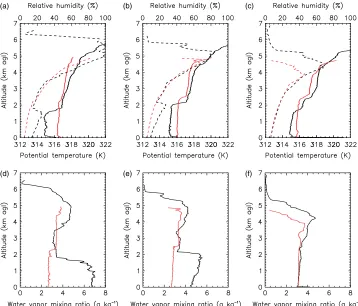
that the moistening associated with the density current occurred over a 2 to 2.2 km deep layer (Figures 9(d, e)) and that the density current does not reach 19◦N (Fig-ure 9(f)). The moistening of the lower layers is also accompanied by moistening above 4 km agl (even though not as dramatic as in the lower layers). North of 18◦N,
the pronounced drying observed between 5 and 6 km agl on 5 June (Figure 8(c), north of 19◦N) is also seen on 6 June (Figure 8(d), north of 18◦N). As discussed in F07, the drying appears to be associated with subsidence related to the return circulation of a plain–mountain wind system involving the Atlas range, and to the subsidence associated with the synoptic-scale trough. This vertical circulation is even more pronounced in the ECMWF anal-yses on 6 June (not shown), which is consistent with the fact that it is observed further south on that day.
The northward progression of moisture is observed to be associated with a surge of the southwesterly flow below 2 km agl. On 6 June the wind reversal region between the southwesterly flow and the northeasterly harmattan (marking the ITD) is much sharper than on 5 June (compare Figures 8(a, b)).
The stability in the upper SAL is similar on both days (compare the altitude of the 317 K and 318 K isentropic surfaces in Figures 8(e, f)), as the propagating cold pool mostly impacted the lower part of the Saharan PBL. The advance of the density current is associated with cool-ing near the surface as marked by the progression of the 314 K isentrope in the lower 2 km (Figure 8(f)). Fur-thermore, even though the 6 June flight was conducted slightly later than the 5 June one, the developing IBL is observed to be shallower, moister and cooler around 18◦N (Figures 9(a, b)). This suggests that the IBL devel-opment on 6 June is delayed due to the greater amount of surface heating needed for the IBL and the convec-tive thermals within it to break the convecconvec-tive inhibition barrier imposed by moister and cooler near-surface con-ditions in this area. More surprisingly, the growth of the Saharan PBL at 19◦N also appears to be delayed com-pared with 5 June (Figure 9(c)), even though the density current did not affect the thermodynamics directly that far north. A three-layer structure is observed at 19◦N (Figure 9(c)) on 6 June, with the IBL developing within the previous day’s IBL. This suggests that on 5 June the developing IBL did not mix throughout the depth of Saharan PBL. A possible explanation for the lack of IBL development on 5 June and for the delayed growth of the IBL could be the presence of large loads of dust observed with SEVIRI (Figure 5) but also by lidar in the upper SAL (north of 17.5◦N; next section and F07). Cloud shading could also play a role in the present case.
While dew-point temperature data from the SYNOP stations at Tombouctou and Gao are somewhat ambiguous with respect to the position of the ITD, high-temporal-resolution surface SOP station and dropsonde measure-ments unequivocally show that the cold pool which prop-agated during the afternoon of 5 June and in the early hours of 6 June had a durable impact on the thermo-dynamics in the lower PBL over the southern fringes of the Sahara.
5.3. Vertical distribution of aerosols
Figure 9.Profiles of potential temperature (solid) and relative humidity (dashed) derived from the dropsondes released over the Sahara from south to north at (a) 17.87◦N, (b) 18.44◦N and 18.24◦N on 5 and 6 June, respectively, and (c) 19.03◦N. Data for 5 June (6 June) appear in red (black). (d)–(f) are as (a)–(c), but for water vapour mixing ratio. This figure is available in colour online at www.interscience.wiley.com/journal/qj
means of airborne lidar measurements (Figure 10(a)). As discussed by F07, the leading edge of the dust storm was detected at 16.5◦N along the aircraft track. The dust plume was observed to be detached from the surface and to reach heights of approximately 3 km agl a few tens of kilometres behind the cold-pool leading edge. Lidar measurements suggest that a fraction of the dust lofted by the gravity current is mixed into the SAL (i.e. the upper part of the Saharan PBL, decoupled from the surface at the time of the airborne measurements), and in some instances injected above the SAL (around 16◦N, for example). To the north, away from the influence of the density current, the aerosol loading in the IBL (as determined by lidar) is observed to be much less than in the SAL aloft. Plumes of dust generated by strong low-level winds west of the Hoggar as observed in SEVIRI images (e.g. Figures 3(d) and 6(a)), and possibly injected in the upper SAL through PBL mixing, contribute to the dust loading of the elevated SAL over much of the domain observed by the lidar.
The lidar cross-section on 6 June (Figure 10(b)) shows a strikingly different picture from the previous day. For instance, the two-layer structure (with relatively low aerosol content in the IBL) seen in the reflectivity measurements over the Sahara (Figure 10(a)) is no longer visible in Figure 10(b). Instead, north of 18◦N, enhanced reflectivity values observed between 2 and 2.5 km agl (associated with relative humidity less than 30%; Figure 9) are believed to be associated with dust
lifted at the leading edge of the propagating density current. The dust plume associated with the density current is no longer observed to be connected to the surface, possibly due to turbulent mixing in the growing IBL (reducing the near-surface wind speeds) or to a lack of deflatable sediments available for lifting. The presence of dust as far north as 18.7◦N is in agreement with the SEVIRI-derived analysis of the position of the dust front leading edge discussed above (Figure 7(d)).
South of the cold-pool leading edge (between 14.6 and 16◦N), lidar measurements suggest a three-layer structure, with the intermediate layer (between 2 and 3.5 km asl, on average) corresponding to the lower part of the SAL and being characterized by lower reflectivity values, possibly indicating a small content in aerosol to which the lidar is sensitive. The high reflectivity values in the cold pool are due to the high concentration of aerosol being lifted at the leading edge and remaining concealed in the stable density current thereafter, as discussed by Bou Karam et al.(2008).
Figure 10.(a) Lidar-derived reflectivity along the F/F20 track on 5 June 2006 (colour shading) with superimposed isentropes (contour interval 1 K) interpolated from nine dropsondes launched during the flight. The arrows indicate the locations of dropsondes released along the transect. (b) is as (a), but on 6 June 2006. The latitude scale is the same for the two panels, the panels being shifted to facilitate the interpretation of the evolution of the reflectivity fields between the 5 and 6 June. This figure is available in colour online at www.interscience.wiley.com/journal/qj
with latitude of the SAL top (from 6.5 km to 5 km agl), associated with the return circulation of the Atlas, the large-scale trough and the associated subsidence are also seen on 6 June. Finally more clouds are observed near the top of the SAL on 6 June than on 5 June, which is consistent with fact that the upper SAL exhibits higher specific humidity (Figure 9(f)). Note that these clouds were generally observed to be just below the temperature inversion capping the SAL (as also observed elsewhere over the Sahara, e.g. Ansmannet al., 2008; Cuestaet al., 2008), and to sometimes intrude into the free troposphere, thereby locally deforming the top of the SAL.
In conclusion, it appears that, in addition to the influence on the thermodynamics at low levels, the propagating density current also has an impact on the vertical distribution of the dust aerosol over the Sahara.
5.4. Surface energy budget
The influence of the density current on the surface energy budget is investigated at Agoufou, for two reasons: (i) it was overpassed by the density current during the daytime, when the radiative impact of the density current is thought to be largest (as opposed to the site at Bamba, for instance), and (ii) it is one of the sites with the most complete suite of instruments, allowing high-resolution measurements of relevant variables.
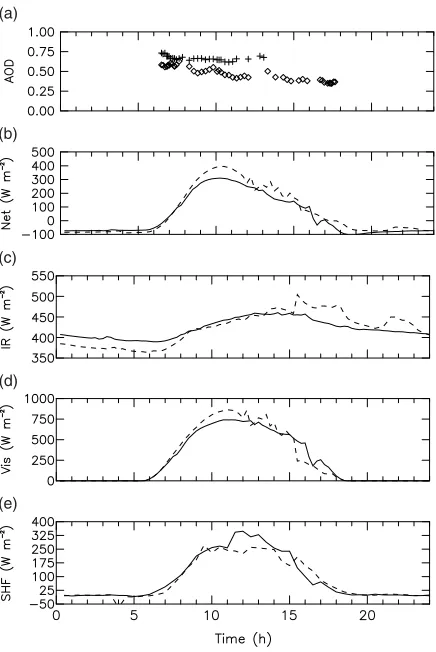
The arrival of the density current at Agoufou between around 1500 and 1530 UTC on 5 June leads to an increase of ≈40 W m−2 (≈8.5%) in the infrared (IR) downwelling flux (Figure 11(c)) while the visible flux is reduced by≈350 W m−2 (≈57%, Figure 11(d)). This is
consistent with increases in both the water vapour and aerosol load. Unfortunately, no sunphotometer-derived aerosol optical depth data were available at that time (Figure 11(a)). Nevertheless, ‘dust raised by wind’ was reported at 1800 UTC at the SYNOP station at Hombori,
near Agoufou. An increase in the surface sensible heat fluxes (≈50 W m−2 or 30%) is also observed to be associated with the passage of the leading edge of the density current (Figure 11(e)). Given that the sensible heat flux is generally decreasing during that time of day, this can be considered as a lower bound. On days not impacted by density currents, the sensible flux is reduced by 10% between 1500 and 1530 UTC, which leads to an upper-bound estimate of the increase of the sensible heat flux of≈60 W m−2(or 40%). The net radiation flux at the
surface decreases strongly (≈110 W m−2or 63%) during the same period.
On 6 June, after 0730 UTC, the net surface flux is observed to be less than on 5 June. The largest differences occur between 0900 and 1130 UTC, and are essentially related to a decrease in the downwelling visible flux (the downwelling IR flux increases slightly between 5 and 6 June, due to an excess of water vapour on 6 June). The decrease is not caused by a larger aerosol load over Agoufou after the passage of the density current (Figure 11(a)), but rather to an increased cloud cover at the top of the SAL as evident from the lidar data (Figure 10), associated with the moistening induced by the advection of humidity in the SAL. Note that increased cloud cover in the afternoon of 6 June (compared with 5 June) was also reported at the SYNOP station at Hombori.
Around midday (from 1130 to 1500 UTC), the surface sensible heat flux was larger on 6 June than on 5 June, most likely as the result of the cooler monsoon air being advected over a still warm surface (Figure 4(a)), which enhances the surface–air temperature gradient on 6 June. The difference was 130 W m−2at 1200 UTC, and ≈90 W m−2 on average between 1100 and 1400 UTC.
Figure 11.(a) Aerosol optical depth at 675 nm measured at Agoufou on 5 June (crosses) and on 6 June (diamonds). Measurements of (b) net radiative flux, (c) downwelling IR flux, (d) downwelling visible solar flux and (e) surface sensible heat flux, all at Agoufou on 5 and 6 June
(dashed and solid lines, respectively).
6. Assessment of the ECMWF data over the Sahel and the modelled impact of the propagating density current
The motivation for the evaluation of the ECMWF model in the framework of this case-study is to determine whether the northward displacement of the ITD resulting from its interaction with a density current can be realis-tically reproduced in the analyses and the forecasts. This is particularly important if one intends to use ECMWF analyses to evaluate the impact of the northward migra-tion of the ITD on the energy budget of the Sahelian and Saharan PBLs and the possible links with the so-called monsoon onset mechanism.
Note that the analyses used in this paper are from the ECMWF operational model based on the early delivery suite (Haseler, 2004). The early delivery suite is designed to disseminate the 10-day forecast as early as possible and to do that it uses a 12-hour analysis window to get the background state and a 6-hour window to initialize the 10-day forecast. Thus, the ECMWF analyses presented in this paper are 6-hour window analyses but they contain information from the background state and therefore from the previous 12-hour window four-dimensional variational assimilation (4D-Var) analyses. To ease comparison with the SYNOP data (Figures 3, 6
plotted.
From SYNOP messages, only surface pressure and/or relative humidity at 2 m (during the daytime) are directly assimilated. The temperature at 2 m is not incorporated directly in the 4D-Var analysis. It is interesting to note that the synoptic station measurements being assimilated at ECMWF are key to monitoring the locations of the ITD as well as to detecting propagating cold pools in both analyses and forecasts, despite the rather coarse temporal resolution. The passage of the ITD over a synoptic station is characterized by a decrease of surface pressure (associated with the monsoon trough), followed by an increase in moisture (marking the transition from the dry harmattan conditions to the moist monsoon conditions). On the other hand, the passage of a density current is characterized by an increase of surface pressure and, over the Sahel and the Sahara, an increase in moisture.
We also take advantage of the dropsonde measurements acquired during the back-to-back missions over Niger and Mali to provide some insight into the quality of the thermodynamic variables in the ECMWF analyses and forecasts along two-dimensional cross-sections.
6.1. ECMWF analyses
The quality of the ECMWF analyses was assessed by computing the biases and standard deviations between observations and model output extracted at the location of the stations. Overall, small dew-point temperature and wind speed biases are obtained for the period between 0000 UTC on 5 June and 1800 UTC on 6 June (Table IV). Biases and standard deviations may largely be explained by the rather coarse horizontal resolution of the model and by the fact that dew-point temperature and winds had to be extrapolated to 2 m and 10 m, respectively, in order to enable a meaningful comparison with surface station data.
The good agreement suggests that there is enough information in the radiosonde and synoptic observations in the region of interest (Niger, Mali, Mauritania, Alge-ria; Figure 1) to constrain the analysis efficiently via data assimilation. The SYNOP station data (in the vicin-ity of the F/F20 track) assimilated in the 5 and 6 June ECMWF analysis are detailed in Table III. In addition, several radiosonde stations were operating in the region of interest: Niamey, Agadez, Bamako, Ouagadougou and Tamanrasset (Parkeret al., 2008). Data from these sound-ing stations were put on the Global Telecommunication System and were therefore assimilated in the ECMWF analyses.
6.1.1. Nocturnal advance of the ITD
Table IV. Comparison between dew point temperature and wind speed from SYNOP station observations and extracted from ECMWF analyses/forecasts at the location of the SYNOP stations: number of samples (out of 46 stations), biases and standard
deviations.
Analyses Forecasts
5 June 6 June valid 6 June 1200
0000 0600 1200 1800 0000 0600 1200 5 June 0000 5 June 1200 6 June 0000
Samples 19 23 21 26 12 25 24 24 24 24
Td (2 m) Bias –0.82 0.46 1.07 0.54 –0.77 0.68 1.50 0.93 1.35 1.31
(◦C) Std. dev. 3.30 2.90 4.39 5.60 5.10 3.64 4.32 4.25 4.78 4.95
Samples 15 20 21 20 10 20 21 21 21 21
F F (10 m) Bias 1.00 0.58 –0.27 –2.16 –0.22 0.79 –0.23 –0.12 –0.37 –0.05
(m s−1) Std. dev. 1.83 1.61 1.92 2.47 1.47 1.52 1.31 1.53 1.44 1.36
northernmost position south of the southern tip of Algeria, and west of the A¨ır mountains (Figures 12(a–c)). The tightest dew-point temperature gradient along the ITD is seen to the west and at 0600 UTC, in response to the low-level jet over southern Mali and Burkina Faso (Figure 12(b)).
At 0000 UTC, the position of the ITD is in fair agree-ment with the observations (Figure 3(a)). The stations at Nema, Mopti, Tombouctou, Hombori, Agoufou, Bamba and Gao are experiencing harmattan conditions (northerly winds and dew-point temperatures below 14◦C). In the west of the domain, the ITD is seen to lie in the vicinity of Bamako in the analyses, as suggested by the dew-point temperatures (Figure 12(a)), while observations suggest that it is much further north (much higher dew-point tem-peratures are observed, Figure 3(a)). To the south of the ITD, the dew-point temperature values in the analysis are in good agreement with the observations. North of the ITD, larger discrepancies are observed.
At 0600 UTC, the ITD reaches Mopti and is just south of Hombori and Agoufou, as in the observations (Figure 12(b)). The stations in the vicinity of Bamako are now under the influence of the monsoon flow, as is Agadez, which is also consistent with the observations (Figure 3(b)). Nema, Tombouctou Bamba and Gao remain north of the ITD. Note that, in the observations, the dew-point temperatures have higher (lower) values south (north) of the ITD than in the analysis. This implies that the surface gradient of moisture and temperature associated with the ITD is weaker in the analysis.
At 1200 UTC, the ITD reaches Hombori and Agoufou, as well as Gao (Figure 12(c)), while observations sug-gest that Gao is still north of the ITD at that time even though winds exhibit a marked southwesterly component (Figure 3(d)). Southwesterly winds are seen at Tombouc-tou and Bamba, in spite of the low dew-point tempera-tures. Low dew-point temperatures are consistent with the observations, even though winds are not. The southerly winds north of the ITD observed at Gao and seen in the ECMWF data at Bamba and Tombouctou are likely caused by the progression of the ITD, imposing a north-ward displacement of the near-surface air masses.
6.1.2. Propagation of the ITD as the result of its inter-actions with the density currents
After the triggering of the density current, i.e. at 1800 UTC (not shown), the dew-point temperature gradi-ent is not as well marked as previously, even to the west, due to daytime heating and strong mixing within the PBL. Nevertheless, the ITD is now seen to be in the vicinity of Mopti, Hombori and Agoufou as well as Gao. The dew-point temperatures at these stations are in agreement with the observations. Bamba and Agadez are found to the north of the ITD, as in the observations. The winds at these stations are in good agreement with observations. To the west, over Mali, the harmattan flow in the analy-sis appears to be too strong and the ITD too far south, as for instance at Bamako where observations suggest the presence of a well-established monsoon flow.
In the morning of 6 June, the ITD is seen to move northward again between 0000 and 0600 UTC (Fig-ure 12(d, e)), even though the near-surface winds are not as strong as on the previous day. At 0000 UTC, the biggest discrepancy is found at Tombouctou where obser-vations indicate monsoon-type near-surface conditions (Figure 6(d)), whereas the analysis indicates harmattan-type near-surface conditions (Figure 12(d)). The ITD is over the Bamba station. Bamako also shows higher dew-point temperature in the observations than in the analysis because probably it did not have the MCS (at that time located around Bamako) and density current to deform the ITD near Tombouctou.
Figure 12.Dew-point temperature field at 2 m above ground (colour shading) from ECMWF analyses at (a) 0000 UTC, (b) 0600 UTC and (c) 1200 UTC on 5 June, and (d) 0000 UTC, (e) 0600 UTC and (f) 1200 UTC on 6 June. Dew-point temperature values and wind barbs extracted from the ECMWF fields at the position of the SYNOP stations are overlaid. The dashed line corresponds to the 14◦C dew-point temperature contour. The asterisks show the location of the dropsondes released on (a)–(c) 5 June and on (d)–(f) 6 June. This figure is available in colour
online at www.interscience.wiley.com/journal/qj
At 1200 UTC, the ITD reaches Nema, but not yet Aioun el Atrouss (Figure 12(f)), while observations sug-gest it has reached both (Figure 7(d)), because probably it did not have the MCS in the right position and the cold pool to deform the ITD near Aioun el Atrouss.
6.1.3. Vertical structure of the atmosphere
Comparing dropsonde data and ECMWF analysis sections along the F/F20 flight track (ECMWF cross-sections are shown in Figure 13), F07 have stressed the overall good agreement concerning the thermodynamics. They also noted that the density current front position in the observations and the ITD position in the ECMWF model were nearly coincident. On 6 June, the overall agreement between the dropsonde observations and the operational analyses (compare Figures 8(b, d, f) with Figures 13(b, d)) was found to be good, as on 5 June. The cold-pool leading edge position in the observations coincided with the position of the ITD in the ECMWF
analysis at 1200 UTC. Finally, the progression of the monsoon–harmattan interface between 5 June and 6 June is well captured in the analysis.
Hence, it appears that the ECMWF analyses do provide a reasonable ITD position (even though not everywhere) in the course of the event and also capture most character-istics of the monsoon–harmattan interface. This is found in spite of the fact that, although these analyses do have the capacity to represent convective events at these lati-tudes, isolated convective systems (and their cold pools) north of the intertropical convergence zone are commonly not reproduced. Therefore the reasonable ITD position in the ECMWF analyses is thought to be due to a beneficial impact of SYNOP data assimilation, as already suggested by Taylor et al.(2005).
6.2. ECMWF forecasts
Figure 13.Vertical cross-sections (latitude–altitude) of ECMWF-derived wind component (m s−1) perpendicular to the F/F20 track on (a) 5 June and (b) 6 June, and water vapour mixing ratio (g kg−1) on (c) 5 June and (d) 6 June, all with isentropes overlaid at 4 K intervals. The wind
component perpendicular to the flight track is plotted using the same sign convention as in Figure 8. This figure is available in colour online at www.interscience.wiley.com/journal/qj
of the ITD position and the atmospheric thermodynamics along the F/F20 flight track in the ECMWF forecasts valid on 6 June at 1200 UTC and initialized at 0000 UTC on 5 June (+36 h forecast) and 1200 UTC on 5 June (+24 h forecast) as well as 0000 UTC on 6 June (+12 h forecast). Improved forecasts are expected once data from the SYNOP stations are assimilated. The study of the forecasts with different lead times (and not just the analyses) will enable a better assessment of the impact of SYNOP data assimilation, as this is still subject to debate. For example, in a short, one-week data denial study based on data from the JET2000 project, Tompkins
et al. (2005) found that upper-air observations had a significant impact on the quality of the analysis, although the impact of the SYNOP data in this case was minor, possibly even detrimental. In contrast, Tayloret al.(2005) found that the ECMWF operational analyses were able to reproduce surface-forced features, and inferred that this must have been due to a beneficial impact of SYNOP data assimilation (Table III and section 6.1).
6.2.1. Propagation of the ITD as the result of its inter-actions with the cold pool
The horizontal structure of the ITD as obtained from the ECMWF+36 h,+24 h and+12 h forecasts at 1200 UTC on 6 June are similar (Figure 14), with the biggest differences appearing in the region of the F/F20 flight track. The ITD is seen to reach its northernmost position along the F/F20 flight track (almost reaching the position of the northernmost dropsonde) in the +36 h forecast (Figure 14(a)), whereas the northernmost position of the ITD in the +24 h and +12 h forecasts (Figures 14(b) and (c), respectively) is seen to the east of the F/F20 flight track. The forecasts (Figure 14) were found to be consistent with the analysis (Figure 12(e)) at the
location of the stations close to the ITD, e.g. Tombouctou, Bamba and Nema. Nevertheless, the forecasts are found to suffer from the same deficiencies as the analyses with respect to the observations (discussion in section 6.1.2). Interestingly, the agreement for the northernmost stations (Tessalit and Agadez) is better between the analysis and the +36 h forecast. An investigation of forecast departures from the observations at Tessalit seems to indicate that the moisture analysis on the 5 June 0000 UTC is closer to the SYNOP observations (i.e. smaller departures) than the analysis on 5 June 1200 UTC or 6 June 0000 UTC. This might explain why the+36 h forecast is also closer to the analysis and observations that the+24 h or +12 h forecasts.
6.2.2. Vertical structure of the atmosphere
For the three forecasts valid on 6 June at 1200 UTC, the most significant changes in the water vapour mixing ratio, potential temperature and transverse wind structures are seen between the+36 h forecast (Figure 15(a, b)) and the +24 h forecast (Figure 15(c, d)). The cross-sections from the+24 h forecast and the+12 h forecast (Figure 15(e, f)) are in good agreement with the 6 June 1200 UTC analysis (Figure 13(b, d)), especially in the lower 3 km, as opposed to the cross-sections from the+36 h forecast.
Figure 14.As Figure 12, but for the ECMWF forecasts valid at 1200 UTC on 6 June and initialized at (a) 0000 UTC and (b) 1200 UTC on 5 June, and at (c) 0000 UTC on 6 June. This figure is available in colour online at www.interscience.wiley.com/journal/qj
Figure 15.Vertical cross-sections along the track of F/F20 of (a, c, e) water vapour mixing ratio (g kg−1) and (b, d, f) transverse wind (m s−1),
(all with potential temperature overlaid, as in Figure 13) issued from the ECMWF forecasts valid at 1200 UTC on 6 June and initialized at (a, b) 0000 UTC and (c, d) 1200 UTC on 5 June, and at (e, f) 0000 UTC on 6 June. This figure is available in colour online at
[image:18.595.115.491.390.716.2]intensification of the heat low in the model forecast. There is a tendency of the model to intensify the Saharan heat low (apparent as a decrease in surface pressure in this region) with increasing forecast lead time (Agusti-Panareda and Beljaars, 2008). In the forecast based on the 5 June 0000 UTC analysis, low-level winds become too strong and advect moisture too far north (from 18◦to 19◦N). The reduction in the low-level wind strength in that region at+36 h might be due to PBL mixing being too strong. This is consistent with the PBL being too deep and the ITD gradient too weak in the forecast (Fig-ure 15(a, b)) between 18◦ and 19◦N.
The vertical structure of the potential temperature, moisture and wind fields in the +24 h forecast (Fig-ure 15(c, d)) and the+12 h forecast (Figure 15(e, f)) are very similar, with an ITD north of Tombouctou (16.71◦N, along the F/F20 flight track), i.e. around 18.5◦N. One of the likely reasons is the fact that the drift in the heat low forecast is not as important as it is for the+36 h forecast. Furthermore, the cycle window for the 5 June 1200 UTC and 6 June 0000 UTC analyses on which the +24 h and+12 h forecasts are based, respectively, account for SYNOP data relevant to the position of the ITD north of Tombouctou, as for example at Mopti, Hombori, Gao and Tombouctou. Details on the times of the measurements from these stations along the northern part of the F/F20 flight track, assimilated in the analysis cycle window are given in Table III. Nevertheless, small differences are seen between 15◦ and 16◦N, where the +12 h forecast (Figure 15(e)) is moister and cooler than the+24 h fore-cast (Figure 15(c)), which is in better agreement with the analysis (Figure 13(d)). It is also worth noting that the agreement is better between the dropsonde observations (Figures 8(b, d, f)) and the 6 June 1200 UTC analysis (Figure 12(f)) than with the +24 h and +12 h forecasts (Figures 14(b) and (c), respectively), as expected.
In summary, it appears that the +12 h and +24 h ECMWF forecasts are relatively realistic with respect to the 6 June 1200 UTC analysis and that the position of the ITD is relatively well reproduced. On the other hand, the +36 h forecast appears to be degraded due to the tendency of the model to intensify the Saharan heat low with increasing forecast lead time. Furthermore, the drift in the model may also be partly alleviated between the+36 h forecast and the+12 h/+24 h forecasts due to the assimilation of SYNOP data relevant to the position of the monsoon–harmattan interface in this particular case of deep convection over the Sahel. Over the Sahara, where SYNOP stations are scarce, already the ECMWF analyses occasionally miss out even fairly large cold pools (e.g. Knippertz et al., 2008), most likely due to the combination of a lack of assimilated observations and deficiencies in the representation of the moist convective dynamics.
7. Summary and conclusions
The interaction between a mesoscale convection system cold pool and the ITD is investigated on two consecutive
days (5 and 6 June 2006), in the framework of the AMMA SOP. Satellite imagery and surface meteorological obser-vations are used to track the movement of the ITD prior to and after its interaction with the cold pool. The influ-ence of the cold pool persists as a coherent dynamic and thermodynamic structure over these two study days, influ-encing a front at least 1000 km long and approximately 200 km wide, spreading across southern Mali.
The impact of the northward-propagating cold pool on the Sahelo-Saharan PBL thermodynamics and aerosol vertical distribution has been analyzed by means of airborne and ground-based measurements. The airborne observations of the propagating cold pool were performed at midday and in the early afternoon, when the ITD is generally ill-defined over the Sahel and Sahara because of the strong turbulent mixing resulting from the strong solar heating. Observations consistently show that propagating cold pools are efficient in bringing moisture over the southern fringes of the Sahara even during the daytime, a period that is generally not favourable to the progression of the monsoon.
The main findings are now summarized in four regions (Zones A to D in Figure 16) around the ITD. The impact of the cold pool on the weather in the four regions is discussed based on the conditions encountered before (Figure 16(a)) and after (Figure 16(b)) the arrival of a density current, and is representative of cross-sections in the lower troposphere in the vicinity of the aircraft flight track.
The conditions described in Figure 16(a) are repre-sentative of those observed on 5 June shortly after the formation of the MCS associated cold pool in the vicin-ity of Tillab´eri (Zone A). To the north, the conditions in Zone B are typically those observed at Agoufou in the early afternoon, after the ITD has moved northward past it, and before the arrival of the cold pool. Haze associ-ated with the passing of the ITD in the morning hours (i.e. related to the mechanism described by Bou Karam
Figure 16.Schematic of the conditions representative of (a) 5 June shortly after the formation of the MCS associated cold pool in the vicinity of Tillab´eri, and of (b) 6 June around midday, once the ITD and the cold pool have merged and the newly defined ITD has propagated northward.
See text for details. This figure is available in colour online at www.interscience.wiley.com/journal/qj
The conditions described in Figure 16(b) are represen-tative of those observed on 6 June around midday, once the ITD and the cold pool have merged and the newly defined ITD has propagated northward to the boundary between Zone C and Zone D. In this picture, the mon-soon flow now covers Zones A to C. The most significant impact of the propagating cold pool on the lower tropo-sphere is found in Zone C, i.e. the region of the Sahara previously under harmattan conditions. Due to the cool-ing and moistencool-ing associated with the density current, the vertical development of the Saharan PBL is found to be delayed on 6 June compared with 5 June (dash-dotted line in Figure 16(b)). Large amounts of dust raised at the leading edge of the newly defined ITD are observed both in the monsoon flow and in the IBL, possibly due to strong turbulence in this region, as shown by Bou Karam
et al.(2008). Further north (Zone D), over the part of the Sahara not impacted by the propagating cold pool, the