Care provision for post stroke visual impairment
Rowe FJ1, Marion Walker2, Janet Rockliffe3, Alex Pollock4, Carmel Noonan5, Claire Howard6, Richard Glendinning7, Rachel Feechan7, Jim Currie8
1 Department of Health Services Research, University of Liverpool, Liverpool L69
3GB
2 Department of Stroke Rehabilitation, University of Nottingham, Nottingham NG7
2UH
3 Speakability North West, 1 Royal Street, London SE1 7LL
4 Nursing, Midwifery and AHP Research Unit, Glasgow Caledonian University,
Glasgow G4 0BA
5 Department of Ophthalmology, Aintree University Hospital NHS Foundation Trust,
Liverpool L9 7AL
6 Department of Orthoptics, Salford Royal NHS Foundation Trust, Manchester M 6
8HD
7 GfK NOP Social Research, Ludgate House, 245 Blackfriars Road, London SE1
9UL
8 Different Strokes (London South East), 9 Canon Harnett Court, Wolverton Mill,
Milton Keynes MK12 5NF
Corresponding author
Dr Fiona Rowe
Department of Health Services Research
Whelan Building (1.10)
University of Liverpool,
Brownlow Hill,
Liverpool L69 3GB
T: 0151 7944956
Grant support: Funding provided by the Stroke Association and Thomas Pocklington Trust.
Abstract
Background: We sought to explore the care provision for post stroke visual
impairment and variations in this in the UK.
Methods: Survey questions were developed and piloted with clinicians, academics
and users. Questions addressed types of visual problems, how these were identified,
treated and followed up, care pathways in use, links with other professions and
referral options. The survey was accessed via a web-link which was circulated
through UK professional organisations to multi-professional members of ophthalmic
and stroke teams.
Results: 548 completed electronic surveys were obtained. 49.5% of respondents
represented stroke teams, 42.5% eye teams and 8% from other teams, e.g.
emergency care. Many respondents (41%) saw patients within one week of stroke.
19% did not personally test vision: 11% had a visiting clinician to test vision. 22%
used screening tools. Validated tests were used for assessment of visual acuity
(39.5%), visual field (57.5%), eye movement (48.5%) and visual function (58.5%).
Visual problems suspected by family or professionals were high (88.5%). Typical
overall follow-up period of vision care was less than 3 months. 46% of respondents
used designated care pathways for stroke survivors with visual problems. 33.5% of
respondents did not provide visual information leaflets.
Conclusions: Significant inequality exists in care for stroke survivors who experience
visual problems. There is great variability in how vision screening is undertaken,
which vision tests are used, methods of referral to eye care services, how visual
problems are managed and what vision information is provided to stroke survivors/
Introduction
Stroke affects 150,000 individuals per annum in the UK and is estimated to cost the
NHS almost £3bn a year (1,2). Visual impairment is a deficit of visual function and,
following stroke, includes abnormalities of central and/or peripheral vision, eye
movements and a variety of visual perception problems (how we interpret what we
see) such as inattention and agnosia. The prevalence of visual impairment amongst
stroke survivors is reported as approximately 60% (3). The visual problems (types of
visual impairment) can be complex including ocular as well as cortical damage (4).
Visual symptoms are frequently poorly described by patients particularly where
individuals have coexistent communication and cognitive impairments. Visual
symptoms can be wide ranging including blurred vision, hallucinations, diplopia and
reading impairment (5). It is unknown what symptoms are perceived to be most
problematic to stroke survivors and which cause the greatest impact to everyday life
such as navigation issues, reading difficulty, loss of confidence or loss of
independence. It is important to ascertain this information as specific types of visual
symptoms can be targeted by a range of therapy options such as prisms, occlusion,
eye scanning training, medical and surgical interventions (4).
Recent studies carried out in the UK have highlighted that many stroke survivors
report that their needs in relation to vision are not met. The Stroke Association (6)
conducted a needs survey in 2010 which included the question “Since your stroke,
have you had enough help with sight difficulties?” Most respondents (52.5%) had not
had a problem, 37.5% had experienced a visual problem and 10.3% had
experienced a problem but did not want help. Of those with a visual problem and
wanting help, 26% reported that their need was unmet, 35% stated their need had
study, involving a structured needs assessment at 6 months post hospital discharge,
also identified unmet needs in relation to vision, with 5.8% of participants reporting
vision as an unmet need (7).
Given the reported variations in care in previously reported surveys, the purpose of
this study was to survey professionals involved in stroke care to explore the systems
in place for care provided for stroke survivors with visual impairment in the UK in
relation to screening and assessment of visual problems, the treatment options
offered, access to and use of care pathways and provision of information resources.
Methods
Institutional ethical approval was obtained for this study. Our survey of professionals
included the following stages.
Methodology and feasibility
Development of survey questions involved consultation and pilot testing with
clinicians, academics and users identified through professional organisation stroke
specialist interest groups and stroke user forums. A range of questions addressed
the types of visual problems seen, how these were identified, how these were
treated, followed-up, what care pathways were used, links with other professions,
referral options and provision of /access to resources.
Instruments
The online survey consisted of 30 questions (appendix 1) containing a mix of closed
and open questions with additional sections for inserting comments. The survey took
approximately 15 minutes to complete but could only be completed in one session,
i.e. it was not possible to pause, save the survey and return to complete it at a later
Sample
Our sample included ophthalmic and stroke professionals contacted via their
UK-wide professional bodies, the Stroke Association, the UK Stroke Forum, the Stroke
Research Network regional contacts, Higher Education Institutes and NHS
organisations (appendix 2).
Conduct
The survey was available for completion via a web-link which was circulated, along
with a cover letter outlining the purpose of the survey. The survey was emailed to 31
professional groups and remained open for completion over a 6-week period
(September-October 2013). Three polite reminder emails were subsequently
circulated to boost survey completion rates.
The information provided on the returned surveys was input to a database (SPSS
version 20: IBM, USA) and descriptive analysis undertaken to combine responses in
relation to each of the questions.
Results
Respondent demographics
Completed surveys were obtained from 548 individuals. A further 348 individuals
started the survey but dropped out before completion; although this figure will include
some people who returned to the questionnaire and completed it as a new survey at
a later date.
Figure 1 shows the professional categories completing the survey. Responses from
members of stroke teams accounted for 49.5% of respondents and responses from
members of eye teams were received from 42.5%. 'Other' responses received from
executives, clinical and neuro psychologists, dieticians, GPs, orthotists, paramedics,
administrative and support workers and visual rehabilitation staff.
Respondents were primarily based in eye clinics (39.5%) and stroke units (26.5%)
with the remainder from community stroke services (11.5%), rehabilitation units
(10%), general medical or neurological wards (1.5%) or other services (11%:
including charitable organisations, community services, social sensory support
services, out-patient services, A&E, neurosurgical services and palliative care).
Visual screening and/or assessment
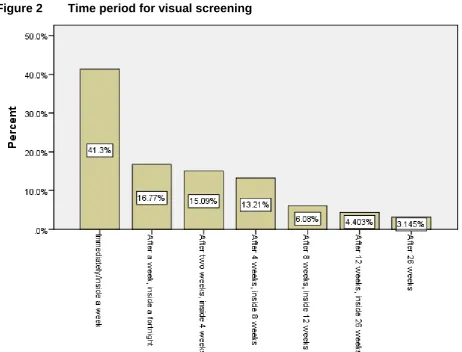
Patients were seen within variable time periods but many respondents (41%) saw
patients within one week of admission (figure 2) and 73% saw patients within one
month. When time of first visual screening/assessment versus profession was
considered, there was a spread across many professional groups (table 1). Eye
team professions (n=124 respondents, 22.5%) were as likely to see patients within
one month as stroke team professions (n=105 respondents, 19%) with similar
numbers of eye team professions (n=12 respondents, 2%) seeing patients after three
months as stroke team professions (n=17 respondents, 3%).
Many patients (45%) were assessed on a stroke unit with 11.5% seen on
neurological, general or elderly care wards. Many commonly saw patients in the eye
clinic (30.5%), at home (15%), in rehabilitation units (14.5%) or in out-patient and
community clinics (8.5%). Those seen in eye clinics were either referred by members
of the stroke team or had follow-up assessments made by the orthoptists who had
first seen them on the stroke unit.
Nineteen percent of respondents did not personally test vision in any way and 11%
respondents, 7%) and stroke team professions (n=47 respondents, 8.5%) did not
test the vision of stroke patients (table 2). However these members of the eye team
would work in other areas of eye health and not specifically with stroke survivors.
Similar numbers of eye team professions (n=30 respondents, 5.5%) as stroke team
professions (n=26 respondents, 5%) reported that a different clinician took
responsibility for undertaking this testing.
Screening tools were used by 22%. These included screening forms such as the
Vision In Stroke (VIS) or locally modified VIS form, British and Irish Orthoptic Society
(BIOS) or locally modified BIOS form. Locally designed screening forms were used
most commonly (13% of total; 54.5% of those using screening forms).
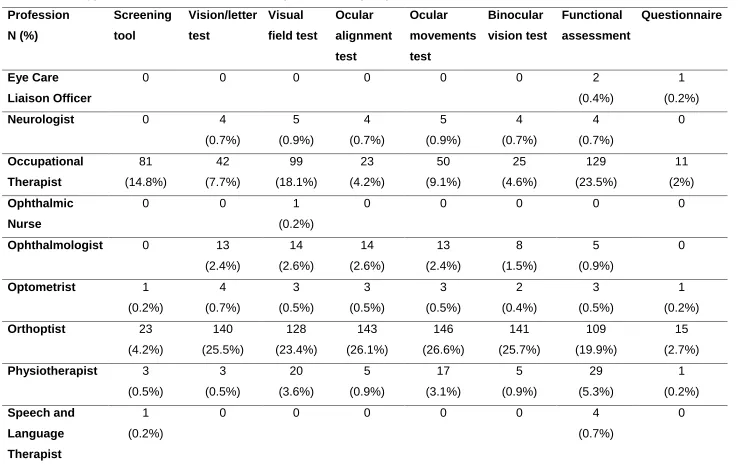
A common range of validated vision tests (table 3) were used by respondents for
assessment of visual acuity (39.5%), visual field (57.5%), eye movement (48.5%)
and visual function (58.5%). Out of all professions, occupational therapists and
orthoptists reported the greatest use of the full range of visual function test options
(table 4).
When testing visual acuity, logMAR and Snellen charts were more frequently used
(26% and 20% respectively). For assessment of ocular alignment, the cover test was
most frequently used (35%) along with observations of corneal reflections (27%).
Assessment of binocular function commonly included stereopsis (30%) and fusional
ability (25%). Functional assessments of vision were undertaken by 58.5% of
respondents. Six percent of respondents reported using questionnaires.
Visual symptoms and conditions
We asked respondents to report whether they encountered various symptoms
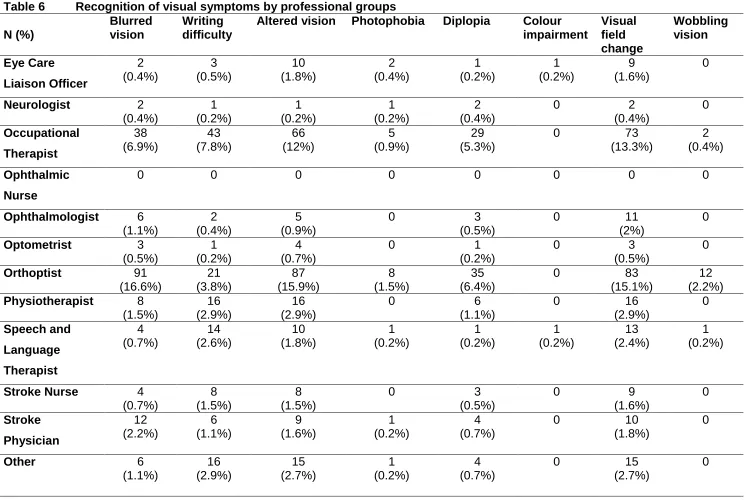
Respondents reported recognising a variety of visual symptoms. Table 5 shows the
frequency of recognition of these visual symptoms. Symptoms recognised frequently
included reading difficulty (49%), visual field change (44.5%), changed or altered
vision (42%), facial droop/weakness (37%) and clumsiness/increased collisions
(37%).
Most visual symptoms were sometimes recognised by many respondents apart from
photophobia/glare, wobbling/juddery vision and colour impairment. Other additional
symptoms were noted rarely. Of all professions reporting their frequent recognition of
symptoms, occupational therapists and orthoptists identified the largest range (table
6) with similar reporting for visual symptoms recognised sometimes or rarely. In
addition, we asked whether visual problems were observed or suspected by family or
other professionals. The response to this question was high at 88.5%.
A range of stroke-related visual conditions were recognised by professionals as
underlying their patients’ visual symptoms (table 7). Visual conditions recognised
frequently included visual field loss (66%), visual inattention (54%) and reduced
visual acuity (36.5%). Most visual conditions were sometimes recognised by many
respondents apart from pupil and colour defects. Other ocular conditions reported as
causing visual symptoms in stroke survivors included lack of glasses and refractive
problems plus binocular vision problems. Of all professions reporting their frequent
recognition of visual conditions, occupational therapists and orthoptists identified the
largest range (table 8) with similar reporting for visual conditions recognised
sometimes or rarely.
Visual rehabilitation options included treatment to improve visual acuity, to improve
adaptation to visual field loss, to alleviate diplopia and improve eye movements, and
to improve reading and functional vision (table 9). The most commonly provided
treatment options included vision advice (87.5%), functional advice (70.5%), reading
strategies (67%), prisms for diplopia (54.5%), monocular patch (53%) and eye
scanning therapy for hemianopia (50%). Table 10 outlines how frequently specific
treatment options were considered by individual professions. Certain types of
treatment options were more likely to be considered by eye team professions than
stroke team professions including prisms, typoscope, refraction, botulinum toxin and
extra ocular muscle surgery.
Many respondents provided rehabilitation treatment options personally (figure 3).
Respondents most commonly offered general vision advice (71% of respondents),
functional advice (55%), reading strategies (52%), monocular patch (39%), eye
scanning for hemianopia (39%), eye scanning for gaze (34%) and prisms for diplopia
(34% of respondents). If patients had no visual symptoms but had an eye condition,
20.5% stated they would always treat, 46.5% would sometimes treat, 11% would not
treat and 22% stated 'don't know'. Those stating ‘don’t know’ included both eye team
and stroke team professions.
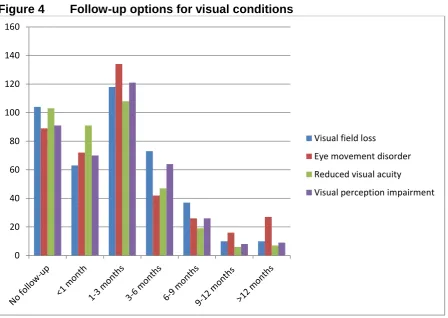
The typical overall follow-up period was less than 3 months. This varied depending
on whether the visual condition related to visual field loss, eye movement disorders,
reduced visual acuity or visual perception impairment (figure 4). Follow-up options
were similar between eye team and stroke team professions for visual field loss and
visual perception impairment. Longer follow-up options were offered by orthoptists
Care pathways, resources and knowledge base
A designated care pathway for stroke survivors with visual problems was used by
46% of respondents. Locally designed pathways were most frequently used (37.5%)
by both stroke team and eye tea professions. Where the (national) British and Irish
Orthoptic Society care pathway (8) was used, this was only by orthoptists and
ophthalmologists.
Visual information sheets related to patient’s visual problems were not given to
patients by 33.5% of respondents. Of the vision information sheets provided, many
were obtained from charitable organisations such as the Stroke Association and
RNIB (47%) followed by professional body resources (24.5%) and Trust in-house
information leaflets (19%).
Twenty percent of respondents rated their knowledge of visual problems as fairly or
very poor whereas 80% rated their vision knowledge as very or fairly good. More
responses reporting fairly poor or poor knowledge were from stroke team
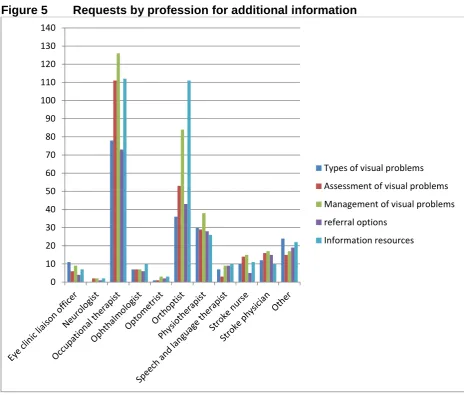
professions (table 11). Nearly 40% of respondents would request more information
to enhance their knowledge and skills: specifically on types of visual problems
(39%), assessment options (47%), management options (60%), who to refer to
(37%) and information resources for patients (59%). These requests for further
information were spread across both eye team and stroke team professions but with
a high number of requests from occupational therapists (figure 5). When asked about
the existing evidence base, 40.5% felt this did not influence, or only slightly
influenced, their assessment of visual problems, and 36.5% felt the evidence base
did not influence, or only slightly influenced, their management. Of all professions,
orthoptists reported being more influenced by the evidence base in how they assess
Discussion
We received 548 responses to our survey from a circulation of the online survey
through 31 organisations. A roughly equal number of responses were received from
members of the stroke team and members of the eye team. The highest number of
responses was received from orthoptists and occupational therapists indicating their
particular involvement with post-stroke care provision for visual impairment. Our
results are limited by a lower than anticipated response rate and a high
non-completion rate (discussed later).
Patients with vision problems were reported by 27% of respondents as being seen at
greater than 4 weeks post stroke. These respondents included both eye team and
stroke team respondents. For those from eye teams, this delay between stroke and
visual assessment potentially has an impact as early treatment of eye problems is
not provided. Early treatment is important as this can alleviate troublesome visual
symptoms and/or advise on compensatory strategies to make best use of residual
visual function. For example, correcting diplopia with prisms enables safer
mobilisation of patients and such patients specifically report considerable symptoms
of disorientation when diplopia is not corrected. Furthermore, delay in visual
assessment leads to a delay in providing accurate information about the visual
condition to the patient, carers and therapy staff.
One fifth of respondents used screening tools but these were mostly screening forms
based on identifying observed signs of visual problems or patient-reported visual
syndromes. They were not formal tests of visual function and such screening forms
detection of visual impairment is based on observed visual signs alone. Where visual
assessment was undertaken, a common array of tests was used for visual acuity,
visual field, eye movements and visual perception. Many tests were validated
assessments, particularly when testing visual acuity and visual inattention.
Orthoptists used the widest range of tests which likely reflects their eye care training
and adaptation of this for stroke services. Confrontation was commonly used for
visual field assessment and this is an appropriate bed-side assessment (10,11).
However, where visual field loss is identified, it is advisable to obtain follow-up with
formal perimetry methods as this plots visual field loss more accurately and reliably
than confrontation, particularly for smaller/less dense visual field defects and, with
respect to follow-up, for confirming change in visual fields (10,11). Assessment of
nine positions of gaze for eye movements was undertaken by a third of respondents
but with others testing only horizontal or vertical eye movements. It is important that
suitable assessment of eye movements is sought (i.e. minimum of horizontal and
vertical eye movements) so that abnormalities, which may only be present in one
specific gaze position, are not missed. From our overall results, it was clear that no
standardised assessment of visual function was made for post-stroke visual
impairment. It was unclear whether assessments for visual function were provided
for all stroke survivors or just for those with suspected visual problems. Thus our
data demonstrate that there are substantial variations in the assessment visual
problems after stroke, and a need for core standardised assessment tools. We
argue that there is a need to develop a set of agreed core outcome measures which
measure relevant outcomes and reflect what is important to patients. Standardised
(considering patient ability) which are not time consuming or too onerous for the
patient to complete.
We asked respondents how frequently they recognised visual symptoms. Of note,
this is not indicative of how frequently these visual symptoms are reported by
patients but merely how frequently they were recognised by respondents. The most
commonly recognised visual symptoms by respondents included blurred vision,
changed or altered vision, field loss, facial weakness, reading difficulties and
clumsiness. Notably these symptoms could be attributed to a number of different
visual problems and could not be used to infer a diagnosis of a specific type of visual
problem which has been reported previously (5).
The survey asked how commonly visual problems were suspected in patients who
could not report their visual symptoms. In such circumstances, respondents
highlighted that visual problems were frequently suspected and subsequently
reported by family or members of the stroke team (88%). This suspicion of visual
problems by professionals, family and carers is important in detecting problems for
patients who are not able to communicate their visual symptoms for whatever
reason.
The most common treatment options that were provided personally by professions in
either the stroke or eye teams included functional activity training, scanning training
for hemianopia or for eye movement problems plus reading strategies and general
advice on adaptations. Scanning training for eye movement problems was reported
as a widely used treatment option by a previous survey (12). In our survey its use
who targeted treatment specifically to the type of eye movement problem. Referrals
made to the eye team were typically to ophthalmologists, orthoptists, optometrists
and low vision services. These referrals are important so that access to specialist
treatments such as prisms, refraction, botulinum toxin and extra-ocular muscle
surgery is facilitated. However there remains a lack of high quality evidence in
relation to the effectiveness of interventions for visual problems after stroke, and
there is clearly an urgent need to establish the evidence-base for the interventions
that are in current use.
Care pathways for visual problems were not utilised by 44% of respondents. Two
previous surveys of occupational therapists and orthoptists in Scotland reported
access to protocols for post stroke visual impairment by 9% and 12% respectively
(12,13). Our figure of 44% is considerably improved but may relate to our survey
being UK wide and across multiple professional groups whereas the previous
surveys were reported in 2011 and in two professional groups only (occupational
therapists and orthoptists). Despite this evidence that care pathways may now be
more widely used, our survey does clearly demonstrate that there remain substantial
variations in the delivery of care to people with visual problems after stroke. We
believe that improving access to and use of nationally agreed care pathways is
essential to facilitate improved, equitable care provision for post-stroke visual
impairment across the UK.
When asked about provision of resources 31% of our respondents did not provide
any visual information leaflets. Given the free availability and easy access to
nationally approved visual information leaflets, this is an aspect that can be readily
UK, vision information can be accessed through the Stroke Association (14), RNIB
(15) and other charities or professional organisations in a variety of formats (e.g.
standard print, large print, auditory). Our survey data suggests that a significant
number of people with post stroke visual impairment may not be receiving
information about their impairment, despite the wide-spread and free availability of
information leaflets specifically for this group of patients. We urge all health
professionals to ensure that their patients have access to appropriate information
about their condition.
One fifth of respondents reported their visual knowledge as fairly or very poor and
specifically requested information on types of visual problems, assessment of visual
problems, management options, referral and information resources. Twice as many
stroke team professions requested such information versus eye team professions,
and in particular occupational therapists. Furthermore one third of respondents
across all professions felt the existing evidence base did not influence their practice.
This raises education issues which have also been previously advocated (8,9).
Professionals can access a wide range of published papers in medical journals
through their organisation libraries. However there is a wealth of information also
available through free internet resources along with approved training courses
(1,17). The challenge of ensuring that health professionals have adequate
knowledge and skills relating to visual impairment after stroke should be addressed
by under-graduate and post-graduate training programmes throughout the UK.
Limitations
We received 548 responses to our professional survey. We had hoped to receive
identified professions involved in eye and stroke care through Vision 2020 UK and
the UK Stroke Forum and circulated the online survey as a web-link via professional
organisations to all professions involved in stroke and eye care. Despite this we are
unsure whether the survey was sufficiently disseminated to clinicians. However we
received almost equal numbers of responses from eye teams and stroke teams with
useful information provided.
We received three criticisms about completion of the survey in which respondents
found it difficult to complete the survey because many questions were asked about
visual assessments and treatments and staff did not necessarily have sufficient
knowledge of these. This criticism had been raised in our pilot survey before the
main survey was released and a ‘don’t know’ or ‘not applicable’ option was added to
most questions. Future, similar, surveys should add these options to all questions
where relevant. It is possible that our results may be biased towards professionals
who had a greater understanding of visual problems. If the results are biased in this
way then it is likely that there is greater variation in care, outcome assessment,
poorer knowledge base and less provision of visual information resources. It is likely
that this will have served to under, rather than over, estimate the variations and
limitations in care provision.
A further limitation of the survey was that it required completion in one stage which
took approximately 15 minutes for full completion. Therefore if individuals had not
allowed sufficient time to complete the survey or for those who found it difficult to
complete (as raised above) and dropped out of it, there was no option to return to
where they had stopped and complete it later. For those returning to the survey, they
would have to start the survey from the beginning and the survey script would count
non-completed surveys versus non-completed surveys. It is likely that some of the 348 who
failed to complete the survey did return to the survey at a different time and complete
it. Thus the 348 figure may overestimate the true number of non-completions.
Conclusions
Visual problems are common after stroke, and a large number of different eye and
stroke professionals are involved in the care of people with these problems. To
ensure the delivery of equitable, high quality, effective care to this group of people it
is clear that a number of service improvements are required. Central to these are the
need for strategies to detect visual problems in people with communication
problems, nationally agreed care pathways and provision of adequate information to
all people with post stroke visual impairment. In addition there is a need for
agreement over core outcome measures, high quality research to establish the
evidence based for interventions and education and training programmes to ensure
adequate knowledge and skills amongst all relevant health professionals. People
with stroke have previously identified that their needs in relation to visual problems
have not been met, and that visual problems after stroke is a top research priority
(18,19); we therefore urge service providers and researchers to address the
important issues raised from this survey.
Acknowledgements
Thus review was supported by funding from the Stroke Association and Thomas
Pocklington Trust.
1. Care Quality Commission. Supporting life after stroke; A review of services for
people who have had a stroke and their carers. 2011
2. The Stroke Association. Accessed 12th August 2014. www.stroke.org.uk 3. Rowe FJ, Walker M, Rockliffe J, Pollock A, Noonan CP, Howard C, Hepworth
L, Glendinning R, Currie J. Care provision and unmet need for post-stroke
visual impairment: Final report. The Stroke Association/Thomas Pocklington
Trust. 2014
4. Rowe FJ, VIS Group. Rowe FJ, VIS group. Visual impairment following stroke.
Do stroke patients require vision assessment? Age Ageing. 2009; 38: 188-193
5. Rowe FJ, VIS Group. Symptoms of stroke related visual impairment.
Strabismus. 2013; 21: 150-4
6. Coleman P. The Stroke Association needs survey. 2010
7. Rothwell K, et al. Feasibility of assessing the needs of stroke patients after 6
months using the GM-SAT. Clin Rehab. 2012; 27(3): 264-71
8. https://orthoptics-org.wildapricot.org/stroke_for_patients
9. Rowe FJ, VIS Group. Accuracy of referrals for visual assessment in a stroke
population. Eye. 2011 Feb;25(2):161-7
10. Gray, C.S. French, J.M. Bates, D. Cartlidge, N.E.F. Venables, G.S. and
James, O.F.W. (1989) Recovery of visual fields in acute stroke: homonymous
hemianopia associated with adverse prognosis. Age Ageing. 18; 419-421. 11. Cassidy, T.P. Bruce, D.W. and Gray, C.S. (2001) Visual field loss after stroke:
Confrontation and perimetry in the assessment of recovery. J Stroke
12. Pollock A, Hazelton C, Brady M. Visual problems after stroke: a survey of
current practice by occupational therapists working in UK stroke inpatient
settings. Top Stroke Rehab. 2011 Oct;18 Suppl 1:643-51
13. Pollock A, Hazelton C, Brady M. Orthoptic assessment and management of
patients with stroke in Scotland. Br Irish Orthoptic J. 2011; 8: 36-42
14. http://www.stroke.org.uk/factsheet/visual-problems-after-stroke
15.
http://www.rnib.org.uk/eye-health-sight-loss-and-other-conditions/stroke-and-sight-loss
16. http://www.stroke-education.org.uk/
17. http://www.strokeadvancingmodules.org/node.asp?id=vision
18. http://www.lindalliance.org/StrokeinScotlandaJLAPrioritySettingPartnership.as
p
19. Rowe FJ, Wormald R, Cable R, Acton M, Bonstein K, Bowen M, Bronze C,
Bunce C, Conroy D, Cowan K, Evans K, Fenton M, Giles H, Gordon I,
Halfhide L, Harper R, Lightstone A, Votruba M, Waterman H, Zekite A. The
Sight Loss and Vision Priority Setting Partnership (SLV-PSP): overview and
results of the research prioritisation survey process. BMJ Open
Figure 3 Percent frequency of personally provided visual rehabilitation options
0 10 20 30 40 50 60 70 80
Per
ce
n
t
Figure 4 Follow-up options for visual conditions
0 20 40 60 80 100 120 140 160
Visual field loss
Eye movement disorder
Reduced visual acuity
Figure 5 Requests by profession for additional information
0 10 20 30 40 50 60 70 80 90 100 110 120 130 140
Types of visual problems
Assessment of visual problems
Management of visual problems
referral options
Table 1 Timing of first vision assessment by professional group
N (%)
Immediately /inside a
week
After a week, inside a fortnight After two weeks, inside 4 weeks After 4 weeks, inside 8 weeks After 8 weeks, inside 12 weeks After 12 weeks, inside 26 weeks After 26 weeks Total
Eye Care Liaison
Officer 0
1 (0.2%) 2 (0.4%) 2 (0.4%) 1 (0.2%) 1 (0.2%) 1 (0.2%) 8 (1.7%)
Neurologist 3
(0.6%) 0 0
1
(0.2%) 0 0 0
4 (0.8%) Occupational Therapist 84 (17.6%) 13 (2.7%) 16 (3.3%) 11 (2.3%) 10 (2.1%) 5 (1%) 6 (1.3%) 145 (30.4%) Ophthalmic
Nurse 0 0 0 0
1
(0.2%) 0 0
1 (0.2%)
Ophthalmologist 1
(0.2%) 0
5 (1%) 6 (1.3%) 2 (0.4%) 3
(0.6%) 0
17 (3.6%)
Optometrist 0 2
(0.4%) 0
1
(0.2%) 0
1 (0.2%)
0 4
(0.8%)
Orthoptist 26
(5.5%) 52 (10.9%) 35 (7.3%) 35 (7.3%) 9 (1.9%) 3 (0.6%) 3 (0.6%) 163 (34.1%)
Physiotherapist 29
(6%) 1 (0.2%) 6 (1.3%) 2 (0.4%) 1 (0.2%) 1 (0.2%) 2 (0.4%) 42 (8.8%) Speech and Language Therapist 8 (1.7%) 1 (0.2%) 2
(0.4%) 0
2 (0.4%) 2 (0.4%) 1 (0.2%) 16 (3.4%)
Stroke nurse 11
(2.3%) 2 (0.4%) 2 (0.4%) 1
(0.2%) 0 0 0
16 (3.4%)
Stroke physician 26
(5.5%)
1
(0.2%) 0 0 0 0 0
27 (5.6%)
Other 9
Table 2 Professional group numbers not undertaking vision assessments specifically for stroke survivors
Profession Do not personally test vision
N (%)
Has a visiting clinician to test vision N (%)
Eye Care Liaison Officer 10 (1.8%) 1 (0.2%)
Neurologist 0 0
Occupational Therapist 11 (2%) 13 (2.4%)
Ophthalmic Nurse 0 0
Ophthalmologist 5 (0.9%) 2 (0.4%)
Optometrist 0 2 (0.4%)
Orthoptist 25 (4.6%) 25 (4.6%)
Physiotherapist 14 (2.6%) 4 (0.7%)
Speech and Language Therapist 14 (2.6%) 1 (0.2%)
Stroke Nurse 6 (1.1%) 6 (1.1%)
Table 3 Type of visual assessments
Visual assessment type Percentage use by respondents Test type
Letter charts or tests 39.5% logMAR charts (26%)
Snellen’s chart (20%)
Fixation and following (18%)
Vanishing optotypes (6.5%)
Gratings (6%)
Near acuity charts (6%)
Others: inattention tests, Kay’s pictures and
Sheridan Gardiner optotypes.
Visual field assessment 57.5% Confrontation (46.5%)
Static perimetry (23%)
Kinetic perimetry (17.5%)
Ocular alignment assessment 38% Cover test (35%)
Observations of corneal reflections (27%)
Ocular movement assessment 48.5% Nine position testing (35%)
Horizontal and vertical gaze only (14%)
Horizontal gaze only (5%)
Vertical gaze only (3.5%)
Others: vergence, saccades, Hess/Lees charts,
optokinetic nystagmus and vestibulo-ocular reflex
Binocular vision assessment 36% Stereopsis (30%)
Retinal correspondence (15%)
Functional vision assessment 58.5% Observations of navigation, reading, eye scanning,
walking, activities of daily living, self-care, body
placement, spatial awareness, mobility, writing,
hand-eye coordination
Carer observations
Questionnaire 6% Locally designed questionnaires
Validated questionnaires for activities of daily living
Visual Function Questionnaire (NVQ25)
Other: case history, inattention
assessment, low vision
assessment, NIHSS scale, other
screening scales
Table 4 Type of visual assessments across professional groups Profession N (%) Screening tool Vision/letter test Visual field test Ocular alignment test Ocular movements test Binocular vision test Functional assessment Questionnaire Eye Care Liaison Officer
0 0 0 0 0 0 2
(0.4%)
1
(0.2%)
Neurologist 0 4
(0.7%) 5 (0.9%) 4 (0.7%) 5 (0.9%) 4 (0.7%) 4 (0.7%) 0 Occupational Therapist 81 (14.8%) 42 (7.7%) 99 (18.1%) 23 (4.2%) 50 (9.1%) 25 (4.6%) 129 (23.5%) 11 (2%) Ophthalmic Nurse
0 0 1
(0.2%)
0 0 0 0 0
Ophthalmologist 0 13
(2.4%) 14 (2.6%) 14 (2.6%) 13 (2.4%) 8 (1.5%) 5 (0.9%) 0
Optometrist 1
(0.2%) 4 (0.7%) 3 (0.5%) 3 (0.5%) 3 (0.5%) 2 (0.4%) 3 (0.5%) 1 (0.2%)
Orthoptist 23
(4.2%) 140 (25.5%) 128 (23.4%) 143 (26.1%) 146 (26.6%) 141 (25.7%) 109 (19.9%) 15 (2.7%)
Physiotherapist 3 (0.5%) 3 (0.5%) 20 (3.6%) 5 (0.9%) 17 (3.1%) 5 (0.9%) 29 (5.3%) 1 (0.2%) Speech and Language Therapist 1 (0.2%)
0 0 0 0 0 4
(0.7%)
Stroke Nurse 3 (0.5%)
1
(0.2%)
8
(1.5%)
2
(0.4%)
4
(0.7%)
1
(0.2%)
7
(1.3%)
0
Stroke Physician
2
(0.4%)
8
(1.5%)
23
(4.2%)
10
(1.8%)
20
(3.6%)
10
(1.8%)
15
(2.7%)
0
Other 7
(1.3%)
2
(0.4%)
15
(2.7%)
3
(0.5%)
8
(1.5%)
2
(0.4%)
14
(2.6%)
2
`
Table 5 Percent frequency of recognised symptoms
Symptom Recognised
frequently
Recognised sometimes
Recognised rarely
Not
recognised / did not know
Reading difficulty 49% 44.5% 3% 3.5%
Visual field change 44.5% 45.5% 7% 3%
Changed or altered vision 42% 47% 6% 5%
Facial droop/ weakness 37% 38.5% 15% 10%
Clumsy / collisions 37% 51% 6% 6%
Blurred vision 32% 52% 10% 6%
Writing difficulty 24% 52% 16% 8%
Depth impairment 20% 53% 17.5% 9.5%
Diplopia 16% 66% 13% 5%
Recognition impairment 13% 49% 28.5% 9.5%
Compensatory head posture 9.5% 40.5% 36% 14%
Lid droop 8% 44% 38% 10%
Visual hallucinations 3.5% 34.5% 47% 15%
Photophobia / glare 3.5% 26.5% 52% 18%
Wobbling / juddery vision 3% 29% 50% 18%
Table 6 Recognition of visual symptoms by professional groups N (%) Blurred vision Writing difficulty
Altered vision Photophobia Diplopia Colour impairment Visual field change Wobbling vision Eye Care Liaison Officer 2 (0.4%) 3 (0.5%) 10 (1.8%) 2 (0.4%) 1 (0.2%) 1 (0.2%) 9 (1.6%) 0
Neurologist 2
(0.4%) 1 (0.2%) 1 (0.2%) 1 (0.2%) 2 (0.4%)
0 2
(0.4%) 0 Occupational Therapist 38 (6.9%) 43 (7.8%) 66 (12%) 5 (0.9%) 29 (5.3%)
0 73
(13.3%)
2 (0.4%)
Ophthalmic Nurse
0 0 0 0 0 0 0 0
Ophthalmologist 6 (1.1%)
2 (0.4%)
5 (0.9%)
0 3
(0.5%)
0 11
(2%)
0
Optometrist 3
(0.5%)
1 (0.2%)
4 (0.7%)
0 1
(0.2%)
0 3
(0.5%)
0
Orthoptist 91
(16.6%) 21 (3.8%) 87 (15.9%) 8 (1.5%) 35 (6.4%)
0 83
(15.1%)
12 (2.2%)
Physiotherapist 8 (1.5%)
16 (2.9%)
16 (2.9%)
0 6
(1.1%)
0 16
(2.9%) 0 Speech and Language Therapist 4 (0.7%) 14 (2.6%) 10 (1.8%) 1 (0.2%) 1 (0.2%) 1 (0.2%) 13 (2.4%) 1 (0.2%)
Stroke Nurse 4 (0.7%)
8 (1.5%)
8 (1.5%)
0 3
(0.5%)
0 9
(1.6%) 0 Stroke Physician 12 (2.2%) 6 (1.1%) 9 (1.6%) 1 (0.2%) 4 (0.7%)
0 10
(1.8%)
0
Facial droop
Lid droop Compensatory head posture Visual hallucinations Recognition impairment Depth impairment Reading difficulty Clumsy / collisions Eye Care Liaison Officer
0 1
(0.2%)
0 2
(0.4%) 5 (0.9%) 8 (1.5%) 10 (1.8%) 7 (1.3%)
Neurologist 4
(0.7%)
0 0 0 0 0 2
(0.4%) 2 (0.4%) Occupational Therapist 91 (16.6%) 14 (2.6%) 24 (4.4%) 6 (1.1%) 21 (3.8%) 35 (6.4%) 72 (13.1%) 63 (11.5%) Ophthalmic Nurse
0 0 0 0 0 0 0 0
Ophthalmologist 0 1
(0.2%)
0 1
(0.2%)
0 2
(0.4%)
9 (1.6%)
4 (0.7%)
Optometrist 0 0 0 0 1
(0.2%) 1 (0.2%) 3 (0.5%) 2 (0.4%)
Orthoptist 10
(1.8%) 4 (0.7%) 4 (0.7%) 9 (1.6%) 26 (4.7%) 36 (6.6%) 104 (19%) 62 (11.3%)
Physiotherapist 25 (4.6%)
7 (1.3%)
12 (2.2%)
0 5
(0.9%) 11 (2%) 17 (3.1%) 20 (3.6%) Speech and Language Therapist 12 (2.2%) 4 (0.7%) 3 (0.5%)
0 3
(0.5%) 3 (0.5%) 13 (2.4%) 7 (1.3%)
Stroke Nurse 12 (2.2%) 2 (0.4%) 3 (0.5%) 1 (0.2%) 7 (1.3%) 4 (0.7%) 8 (1.5%) 10 (1.8%) Stroke Physician 26 (4.7%) 4 (0.7%) 1 (0.2%)
0 0 3
(0.5%)
10 (1.8%)
9 (1.6%)
Other 22
Table 7 Percent frequency of recognised visual conditions Condition
%
Recognised frequently
Recognised sometimes
Recognised rarely
Not
recognised / did not know
Visual field loss 66% 26.5% 2.5% 5%
Visual inattention 54% 34% 6% 6%
Reduced visual acuity 36.5% 50% 5.5% 8%
Ophthalmic condition 24% 50% 16% 10%
Eye tracking defect 17% 53.5% 16% 13%
Depth defect 16% 52% 18% 12%
Perceptual defect 16% 49% 22% 13%
Ocular cranial nerve palsy 14% 43.5% 22% 20.5%
Ocular gaze palsy 11.5% 43% 26% 19.5%
Strabismus 10.5% 41.5% 30% 18%
Visual agnosia 9.5% 45% 32% 13.5%
Nystagmus 9.5% 43.5% 34.5% 12.5%
Visual hallucinations 6% 36% 40% 18%
Lid defect 6% 45% 35.5% 13.5%
Reduced contrast 5% 35% 28% 32%
Pupil defect 2% 28% 45.5% 24.5%
Table 8 Recognition of visual conditions by professional groups N (%) Visual field loss Reduced visual acuity Reduced contrast Visual inattention Colour defect Depth defect Visual hallucinations Visual agnosia Eye Care Liaison Officer 12 (2.2%) 7 (1.3%) 4 (0.7%) 8 (1.5%) 1 (0.2%) 6 (1.1%) 2 (0.4%) 2 (0.4%)
Neurologist 4
(0.7%)
1 (0.2%)
0 4
(0.7%)
0 0 0 1
(0.2%) Occupational Therapist 109 (19.9%) 62 (11.3%) 5 (0.9%) 118 (21.5%) 3 (0.5%) 37 (6.6%) 6 (1.1%) 21 (3.8%) Ophthalmic Nurse
0 0 0 0 0 0 0 0
Ophthalmologist 16 (2.9%)
7 (1.3%)
0 2
(0.4%)
0 1
(0.2%)
1 (0.2%)
0
Optometrist 4
(0.7%)
2 (0.4%)
0 1
(0.2%)
0 0 1
(0.2%)
0
Orthoptist 124
(22.6%) 85 (15.5%) 11 (2%) 69 (12.6%)
0 27
(4.9%)
19 (3.5%)
19 (3.5%)
Physiotherapist 25 (4.6%)
9 (1.6%)
0 30
(5.5%)
0 4
(0.7%) 1 (0.2%) 3 (0.5%) Speech and Language Therapist 12 (2.2%) 5 (0.9%) 2 (0.4%) 13 (2.4%)
0 2
(0.4%)
0 3
(0.5%)
Stroke Nurse 13 (2.2%) 4 (0.7%) 1 (0.2%) 11 (2%)
0 1
(0.2%)
0 0
Stroke Physician 23 (4.2%) 10 (1.8%) 1 (0.2%) 20 (3.6%)
0 2
(0.4%)
1 (0.2%)
3 (0.5%)
Perceptual defect
Strabismus Nystagmus Cranial nerve palsy Gaze palsy Eye tracking defect
Lid defect Pupil defect Eye Care
Liaison Officer
2 (0.4%)
0 0 0 0 2
(0.4%)
1 (0.2%)
0
Neurologist 1
(0.2%) 1 (0.2%) 1 (0.2%) 2 (0.4%) 3 (0.5%)
0 0 0
Occupational Therapist
42 (7.7%)
0 11
(2%) 1 (0.2%) 5 (0.9%) 23 (4.2%) 7 (1.3%) 3 (0.5%) Ophthalmic Nurse
0 0 0 0 0 0 0 0
Ophthalmologist 1 (0.2%) 4 (0.7%) 1 (0.2%) 4 (0.7%) 3 (0.5%) 2 (0.4%) 2 (0.4%) 1 (0.2%)
Optometrist 0 0 1
(0.2%)
0 0 0 0 0
Orthoptist 23
(4.2%) 47 (8.6%) 30 (5.5%) 62 (11.3%) 37 (6.8%) 51 (9.3%) 10 (1.8%) 4 (0.7%)
Physiotherapist 4 (0.7%) 1 (0.2%) 3 (0.5%) 1 (0.2%) 2 (0.4%) 6 (1.1%) 3 (0.5%) 1 (0.2%) Speech and Language Therapist 6 (1.1%)
0 0 1
(0.2%)
0 2
(0.4%)
3 (0.5%)
1 (0.2%)
Stroke Nurse 0 1
(0.2%)
2 (0.4%)
0 3
(0.5%) 1 (0.2%) 1 (0.2%) 0 Stroke Physician 4 (0.7%) 3 (0.5%) 3 (0.5%) 5 (0.9%) 8 (1.5%) 3 (0.5%) 3 (0.5%) 2 (0.4%)
Table 9 Percent frequency of provided visual rehabilitation options
Rehabilitation Provided Frequently Sometimes Rarely
Vision advice 87.5% 66.4% 19.5% 1.5%
Functional advice 70.5% 48.7% 17.4% 4.2%
Reading strategies 67% 31.6% 29.9% 5.3%
Prisms for diplopia 54.5% 26.8% 23% 4.7%
Monocular patch 53% 21.4% 25.8% 5.8%
Eye scanning for hemianopia 50% 29.4% 16.4% 4.2%
Refraction / glasses 45% 18.4% 22.4% 4%
Low vision aids 45% 9.7% 27% 8.2%
Eye scanning for gaze 45% 21.5% 19% 4.7%
Prisms for hemianopia 39.5% 9.9% 19.7% 10%
Prisms for gaze 28% 9.3% 13% 6%
Ocular muscle surgery 24% 2.6% 13.5% 8%
Typoscope 17% 4.6% 9.3% 3.3%
Table 10 Provision or referral for treatment options by professional groups N (%)
Refraction Prisms: hemianopia
Scanning: hemianopia
Typoscope Low vision aids Reading strategies Functional activity advice General advice Eye Care Liaison Officer 4 (0.7%) 3 (0.5%) 3 (0.5%) 2 (0.4%) 9 (1.6%) 7 (1.3%) 7 (1.3%) 12 (2.2%)
Neurologist 3 (0.5%)
2 (0.4%)
3 (0.5%)
0 4
(0.7%) 5 (0.9%) 5 (0.9%) 4 (0.7%) Occupational Therapist 47 (8.6%) 48 (8.8%) 115 (21%) 3 (0.5%) 55 (10%) 131 (23.9%) 151 (27.6%) 142 (25.9%) Ophthalmic Nurse 1 (0.2%) 1 (0.2%)
0 0 1
(0.2%)
0 0 0
Ophthalmologist 18 (3.3%)
6 (1.1%)
5 (0.9%)
0 18
(3.3%) 10 (1.8%) 8 (1.5%) 19 (2.5%)
Optometrist 5 (0.9%) 3 (0.5%) 3 (0.5%) 3 (0.5%) 5 (0.9%) 3 (0.5%) 2 (0.4%) 5 (0.9%)
Orthoptist 124
(22.6%) 102 (18.6%) 88 (16.1%) 81 (14.8%) 117 (21.4) 135 (24.6%) 108 (19.7%) 177 (32.3%)
Physiotherapist 9 (1.6%)
13 (2.4%)
20 (3.6%)
0 8
(1.5%) 17 (3.1%) 33 (6%) 39 (7.1%) Speech and Language Therapist 5 (0.9%) 4 (0.7%) 4 (0.7%)
0 3
(0.5%) 11 (2%) 10 (1.8%) 10 (1.8%)
Stroke Nurse 10 (1.8%) 10 (1.8%) 10 (1.8%) 1 (0.2%) 6 (1.1%) 9 (1.6%) 13 (2.4%) 16 (2.9%) Stroke Physician 14 (2.6%) 17 (3.1%) 10 (1.8%) 1 (0.2%) 13 (2.4%) 19 (3.5%) 23 (4.2%) 25 (4.6%)
Prisms: diplopia
Prisms: gaze
Occlusion Scanning: gaze Ocular muscle botulinum toxin Ocular muscle surgery
Don’t know Not applicable Eye Care Liaison Officer 4 (0.7%) 2 (0.4%) 1 (0.2%) 3 (0.5%) 1 (0.2%) 1 (0.2%)
0 0
Neurologist 5 (0.9%) 3 (0.5%) 5 (0.9%) 3 (0.5%) 1 (0.2%) 1 (0.2%)
0 0
Occupational Therapist 36 (6.6%) 20 (3.6%) 38 (6.9%) 104 (19%)
0 1
(0.2%)
0 2
(0.4%)
Ophthalmic Nurse
1 (0.2%)
0 0 0 1
(0.2%)
0 0 0
Ophthalmologist 20 (3.6%) 9 (1.6%) 18 (3.3%) 5 (0.9%) 16 (2.9%) 17 (3.1%) 1 (0.2%) 0
Optometrist 3 (0.5%) 2 (0.4%) 4 (0.7%) 1 (0.2%) 1 (0.2%) 1 (0.2%)
0 0
Orthoptist 183
(33.4%) 93 (17%) 176 (32.1%) 79 (14.4%) 71 (13%) 110 (20.1%) 2 (0.4%) 2 (0.4%)
Physiotherapist 10 (1.8%) 6 (1.1%) 14 (2.6%) 28 (5.1%)
0 0 1
(0.2%) 1 (0.2%) Speech and Language Therapist 2 (0.4%) 1 (0.2%) 2 (0.4%) 4 (0.7%)
0 0 0 3
(0.5%)
Stroke Nurse 6 (1.1%) 4 (0.7%) 8 (1.5%) 8 (1.5%)
0 0 0 3
(0.5%) Stroke Physician 23 (4.2%) 12 (2.2%) 17 (3.1%) 10 (1.8%) 3 (0.5%) 1 (0.2%)
Table 11 Reporting of knowledge base by professional group
N (%) Very good Fairly good Fairly poor Very poor Total
Eye Care Liaison Officer 1 (0.2%) 11 (2%) 1 (0.2%) 0 13 (2.4%)
Neurologist 1 (0.2%) 4 (0.7%) 0 0 5 (0.9%)
Occupational Therapist 13 (2.4%) 113 (20.6%) 32 (5.8%) 0 158 (28.8%)
Ophthalmic Nurse 0 1 (0.2%) 0 0 1 (0.2%)
Ophthalmologist 5 (0.9%) 14 (2.6%) 3 (0.5%) 0 22 (4%)
Optometrist 1 (0.2%) 4 (0.7%) 0 0 5 (0.9%)
Orthoptist 59 (10.8%) 114 (20.8%) 16 (2.9%) 0 189 (34.5%)
Physiotherapist 1 (0.2%) 22 (4%) 23 (4.2%) 1 (0.2%) 47 (8.6%)
Speech and Language
Therapist 0 10 (1.8%) 6 (1.1%) 1 (0.2%)
17 (3.1%)
Stroke nurse 0 13 (2.4%) 7 (1.3%) 0 20
(3.6%)
Stroke physician 5 (0.9%) 20 (3.6%) 3 (0.5%) 0 28 (5.1%)
Other 6 (1.1%) 20 (3.6%) 12 (2.2%) 5 (0.9%) 43
(7.8%)
Table 12 Numbers of professionals with non-completed and completed surveys Professional group Non-completed surveys
(n)
Completed surveys (n)
Eye Care Liaison Officer 3 13
Neurologist 3 5
Occupational Therapist 78 158
Ophthalmic nurse 3 1
Ophthalmologist 17 22
Optometrist 5 5
Orthoptist 134 189
Physiotherapist 24 47
Speech and language therapist 5 17
Stroke nurse 24 20
Stroke physician 11 28
Others 25 43