NON-CONTRASTED COMPUTED TOMOGRAPHY FOR THE
ACCURATE MEASUREMENT OF LIVER STEATOSIS IN
NON ALCOHOLIC FATTY LIVER DISEASE
Dissertation submitted for
D.M.DEGREE EXAMINATION- AUGUST-2013 BRANCH-IV-MEDICAL GASTROENTEROLOGY
MADRAS MEDICAL COLLEGE &
RAJIV GANDHI GOVERNMENT GENERAL HOSPITAL CHENNAI-600003
CERTIFICATE
This is to certify that the dissertation “NON-CONTRASTED COMPUTED TOMOGRAPHY FOR THE ACCURATE MEASUREMENT OF LIVER STEATOSIS IN NON ALCOHOLIC FATTY LIVER DISEASE” is a bonafide work of Dr.P.SENTHIL KUMAR in partial fulfillment of the requirements for D.M. Branch-IV (MEDICAL GASTROENTEROLOGY) examination of THE TAMILNADU DR.M.G.R. MEDICAL UNIVERSITY to be held in August 2013.The period of post-graduate study and training was from August 2010 to July 2013.
DR. MOHAMMED ALI., MD., DM., PROFESSOR AND HOD
MADRAS MEDICAL COLLEGE, CHENNAI
DEAN
DECLARATION
I, Dr. P.SENTHIL KUMAR, solemnly declare that this dissertation
entitled, NON-CONTRASTED COMPUTED TOMOGRAPHY FOR
THE ACCURATE MEASUREMENT OF LIVER STEATOSIS IN NON ALCOHOLIC FATTY LIVER DISEASE is a bonafide work done by me at the Department of Medical Gastroenterology, Madras Medical College & Rajiv Gandhi Government General Hospital, Chennai during the period 2010- 2013 under the guidance and supervision of the Prof. Mohammed Ali M.D.,D.M., Professor and Head of the Department Of Medical Gastroenterology of Madras Medical College & Government General Hospital, Chennai.
This dissertation is submitted to The Tamil Nadu Dr.M.G.R Medical University, towards requirement for the award of D.M. Degree (Branch-IV) in Medical Gastroenterology
Chennai Date
Dr. P.SENTHIL KUMAR Post graduate student
ACKNOWLEDGEMENTS
A great many people made this work possible. I thank my Dean for
allowing me to conduct this study. I owe my warmest respects and sincere
thanks to our beloved Professor Prof. Mohammed Ali Professor and Head
of the Department of Medical Gastroenterology, Government General
Hospital,Chennai, and DrP.Padmanaban M.D.,D.M, T.Pugazhenthi
M.D.,D.M., additional professor Department of Medical Gastroenterology,
Government General Hospitals Chennai who were the driving force behind
this study. I am indebted to my Assistant Professors Dr.K.Prem Kumar,
Dr. Kani Sheik Mohammed,Dr.Ratnakar Kini P, and who helped in my
work
In addition, I am grateful to of my copost graduate students for
helping me out throughout this study period.Last but not the least I thank
CONTENTS
S.NO TITLE PAGE
NO
1 INTRODUCTION
1
2
AIM OF THE STUDY
6
3
REVIEW OF LITERATURE
7
4
MATERIALS AND METHODS
34
5 RESULTS
40
6 DISCUSSION
54
7 CONCLUSION
59
BIBLIOGRAPHY
ANNEXURES
¾
ABBREVIATIONS
¾
CONSENT FORM
¾
MASTER CHART
¾
ETHICAL COMMITTEE APPROVAL ORDER
¾
TURNITIN-PLAGIARISM SCREEN SHOT
ABBRIVATIONS
ncCT
-
Non-Contrasted Computed Tomography
LFT
-
Liver Function Test
CTHU
-
Computer Tomography in Houns Field Unit.
CTL-S
-
Computer Tomography of Liver – spleen in Houns
Field
Unit.
CTL/S
-
Computer Tomography of Liver to spleen ratio in
Houns
Field
Unit.
BMI
-
Body Mass Index
NASH
-
Non Alcoholic Steato Hepatitis
NAFLD
-
Non Alcoholic Fatty Liver Disease
1
INTRODUCTION
Non alcoholic fatty liver disease[NAFLD] is emerging as most
common liver disorder in India and other developing countries, The
histological spectrum ranging from simple steatosis or steatosis with only
mild inflammation (type 1 and 2 NAFLD) to more severe steatohepatitis
(types 3 and 4 NAFLD or NASH). Types 3 and 4 NAFLD progress to
cirrhosis in 15-20% of patients. Progression is silent or paradoxically
associated with normalization of aminotransferases. “NASH” coined by
Ludwig and colleagues from Mayo clinic.
SPECTRUM OF NAFLD
• Steatosis
• Steatohepatitis (NASH)
• NASH with Fibrosis
• Cirrhosis
DEFINITIONS
NAFLD: Non alcoholic fatty infiltration with no or minimal inflammation
and no fibrosis.also called simple steatosis,Pure steatosis and bland
2
Primary NAFLD : indicates typical NAFLD associated with central
obesity and T2 DM without specific etiology.
Secondary NAFLD – associated with a specific, non alcohol related
problem such as drugs or toxins.
Toxin- associated steatohepatitis : associated with specific toxin or
medication.eg petrochemical exposure in oil industry
CRITERIA FOR DEFINING NAFLD
1) A liver biopsy showing moderate to gross macrovesicular fatty
change with or without inflammation (lobular or portal),and
Mallory bodies, fibrosis, or cirrhosis.
2) No alcohol consumption or consumption less than 40 g of ethanol
per week.
3) Absence of serologic evidence of hepatitis B or hepatitis C.
EPIDEMIOLOGY AND PREVALENCE
Prevalence of NAFLD 13-18% and that of NASH specifically 2-3%
(1.2-9%) in two Japanese studies- incidence rate of 31 and 86 cases .
( AGA guidelines 2012)
3
By histology confirmed NASH-12.2 %. (AGA guidelines 2012) It is
a disease of all sexes, ethnicities, and age groups (peak 40-59) Higher in
Hispanics than Africa Americans. Occurs more frequently in females (65
to 83%)
OBESITY
4.6 fold increase risk of fatty liver in USG compared to nonobese.
Autopsy studies, steatosis-approx 70%obese vs 35% lean. Severe obesity
patients- prevalance of NAFLD may go upto 90%. Obese patients with
abnormal liver enzymes approx 30% has septal fibrosis and 10% cirrhosis.
INSULIN RESISTANCE AND T2 DM
Insulin resistance is very common in NAFLD. Progression to overt
iabetes is preceded by steatosis in susceptible population. 75% of T2 DM-
fatty infiltration. Liver injury worsens the preexistant diabetes in patients
with NAFLD and doubles the prevalence of cirrhosis from 10-25%.
HYPERLIPIDEMIA
2/3 of hypertriglyceridemeia&1/3rd with hypercholestrolemia- fatty
liver Hyperlipidemia reported in 92% of NASH patients. Ethnic variation
4
METABOLIC SYNDROME
Steatosis and central adiposity with underlying insulin resistance and
lipotoxicity- independent risk factor for metabolic syndrome. Unexplained
elevation of liver enzymes attributable to NAFLD seen in 7% of
individuals with metabolic syndrome defined by adult Treatment Panel 111
criteria.
DIAGNOSIS
On routine liver biochemical test elevated liver enzymes level
usually will suspect common causes of liver disease will arose for other
investigations like USG, CT, MRI, CBC, PT, anti-HCV, HBsAg, serum
iron , anti-tripsin, ANA, on physical examination hepatomegaly, on history
alcohol consumption should be excluded [ less than 40 grams /week]
clinically if the patients having age > 50 years, obesity, diabetes,
hypertension
IMAGING
Hepatic ultrasonogram shows “bright liver” with increased echoes
consistant with steatosis on CT scan. Fatty liver shows lower in density
compared to screen, MRI shows fat appears bright on T1 – weighted
5
hepatic fat, with more than grade I fatty liver [< 5% is minimal, 5 – 33%
grade I, 33 – 66% grade II, > 66% grade III] with positive predictive value
of 62 – 76%, no radiologic modality able to distinguish simple steatosis
from more advanced NAFLD. These imaging techniques [USG, CT, MRI,
support the diagnosis of NAFLD but it cannot predict the severity of
disease. And also it cannot replace gold standard liver biopsy and
histopathogy, for establishing diagnosis in certainty.
So The degree of steatosis in NAFLD patients is usually assessed
with invasive technique like liver biopsy, because of the invasive method
of the liver biopsy and its painful nature of the procedure with moderate
complication rate need to find alternative less invasive, less painful, quick
6
AIMS AND OBJECTIVES
To study and analyse unenhanced CT [nc-CT] determination of
hepatic steatosis based on image attenuation data (Hounsfield units) and to
7
REVIEW OF LITERATURE
NAFLD is emerging as one of the most common liver disorder in
India and many other developing countries in the world. The histological
spectrum ranging from simple steatosis or steatosis with only mild
inflammation( type 1 and 2 NAFLD) to more severe steatohepatitis (types
3 and 4 NAFLD or NASH. Types 3 and 4 NAFLD progress to cirrhosis in
15-20% of patients. Progression is silent or paradoxically associated with
normalization of aminotransferases. “NASH” coined by Ludwig and
colleagues from Mayo clinic.
SPECTRUM OF NAFLD
• Steatosis
• Steatohepatitis (NASH)
• NASH with Fibrosis
• Cirrhosis
DEFINIT
NAFLD: Non alcoholic fatty infiltration with no or minimal
inflammation and no fibrosis. Also called simple steatosis, pure steatosis
8
Primary NAFLD: indicates typical NAFLD associated with central
obesity and T2 DM without specific etiology.
Secondary NAFLD – associated with a specific, on alcohol related
problem such as drugs or toxins.
Toxin- associated steatohepatitis: associated with specific toxin or
medication.eg petrochemical exposure in oil industry
CRITERIA FOR NAFLD
1) A liver histology showing moderate to gross macro vesicular fatty
change with or without inflammation (lobular or portal), and
Mallory bodies, fibrosis, or cirrhosis.
1) No alcohol consumption or consumption less than 40 g of ethanol
per week.
2) Absence of serologic evidence of hepatitis B or hepatitis C.
EPIDEMIOLOGY AND PREVALENCE
Prevalence of NAFLD 13-18% and that of NASH specifically 2-3%
(1.2-9%) in two Japanese studies- incidence rate of 31 and 86 cases of
suspected NAFLD person-years respectively. (AGA guidelines 2012)
The prevalence by USG is-46% and the prevalence by histology -12.2 %.
9
It is a disease of both the sexes, ethnicities, and all age groups (peak 40-59)
higher in Hispanics than Africa Americans. Occurs more frequently in
females (65 to 83%)
OBESITY
4.6 Fold increase risk of fatty liver in USG compared to non obese.
Autopsy studies, steatosis-approx 70%obese vs. 35% lean. Severe obesity
patients- prevalence of NAFLD may go up to 90%. Obese patients with
abnormal liver enzymes approx 30% have sepal fibrosis and 10% cirrhosis.
INSULIN RESISTANCE AND T2 DM
Insulin resistance is very common in NAFLD. Progression to overt
diabetes is preceded by steatosis in susceptible population. 75% of T2 DM-
fatty infiltration. Liver injury worsens the preexistent diabetes in patients
with NAFLD and doubles the prevalence of cirrhosis from 10-25%.
HYPERLIPIDEMIA
2/3 of hypertriglyceridemeia&1/3rd with hypercholesterolemia- fatty
liver Hyperlipidemia reported in 92% of NASH patients. Ethnic variation
10
METABOLIC SYNDROME
Steatosis and central adiposity with underlying insulin resistance and
lipotoxicity- independent risk factor for metabolic syndrome. Unexplained
elevation of liver enzymes attributable to NAFLD seen in 7% of
individuals with metabolic syndrome defined by adult Treatment Panel 111
criteria.
GENETIC AND FAMILIAL FACTORS
Ethnic variation: Hispanic descent in USA has higher prevalence of
NASH than primarily african-american descent. It reflects the ethnic
difference in body fat distribution and lipoprotein metabolism. Familial
factors: High prevalence in 1st degree relatives in NASH. Insulin resistance
among relatives of T2DM and impaired skeletal muscle mitochondrial
metabolism in offspring supports genetic component. Genetic variation:
gene coding phospholipase like protein called PNPLA3 or adiponutrin –
major predictor of steatosis in different ethnic groups.
NASH in other liver diseases
Steatosis mediated by core protein metabolism and microsomal TGL
transfer protein associated with hepatitis C {geno3} infection. Obesity,
insulin resistance negatively influences response to antiviral therapy.
Occult hemochromatosis and iron loading – cofactor in progression of
11
ETIOLOGY
Causes of Nonalcoholic Fatty Liver Disease Acquired Metabolic Disorders
• Diabetes mellitus
• Dyslipidemia
• Kwashiorkor and marasmus
• Obesity
• Starvation
Cytotoxic and Cytostatic Drugs Other Drugs and Toxins
• Amiodarone
• 4,4′-diethylaminoethoxyhexestrol
• Dichlorethylene
• Ethionine
• Ethyl bromide
• Estrogens
• Glucocorticoids
• Highly active antiretroviral therapy
• Hydrazine
12
• Orotate
• Perhexilene maleate
• Safrole
• Tamoxifen
Acquired Metabolic Disorders
• Diabetes mellitus
• Dyslipidemia
• Kwashiorkor and marasmus
• Obesity
• Starvation
Acquired Metabolic Disorders
• Diabetes mellitus
• Dyslipidemia
• Kwashiorkor and marasmus
• Obesity
• Starvation
Cytotoxic and Cytostatic Drugs Other Drugs and Toxins
• Amiodarone
• 4,4′-diethylaminoethoxyhexestrol
13
• Ethionine
• Ethyl bromide
• Estrogens
• Glucocorticoids
• Highly active antiretroviral therapy
• Hydrazine
• Hypoglycin
• Orotate
• Perhexilene maleate
• Safrole
• Tamoxifen
Metals
• Rare earths of low atomic number
• Thallium compounds
• Uranium compounds
Inborn Errors of Metabolism
• Abetalipoproteinemia
• Familial hepatosteatosis
• Galactosemia
• Glycogen storage disease
14
• Systemic carnitine deficiency
• Tyrosinemia
• Weber-Christian syndrome
• Wilson disease
Surgical Procedures
• Biliopancreatic diversion
• Extensive small bowel resection
• Gastric and
• Jejunoileal bypass
Miscellaneous Conditions
• Industrial exposure to petrochemicals
• Inflammatory bowel disease
• Partial lipodystrophy
• Jejunal diverticulosis with bacterial overgrowth
• Severe anemia
15
PATHOGENESIS OF NAFLD
TRIGLYCERIDE ACCUMULATION
Occurs due to shifting of fatty acid metabolism to lipogenesis and
also synthesis of lipoprotein decreases
16
• Excessive importation of FFA
Obesity
• Impaired VLDL synthesis and secretion
• Impaired beta-oxidation of FFA to ATP
INSULIN RESISTANCE& HYPERINSULINEMIA
It is a Primary pathogenic factor in steatosis. Excess FFA causes
insulin resistance by down regulating IRS-1 signaling. Insulin resistance
potentiated by aberrant function of peptide mediators TNF-α,leptin and
adiponectin. TNF-α downregulates IRS-1 signaling via serine
phosphorylation through activation of Jun terminal N kinase . Activation of
inhibitor Kappa βkinase / nuclear factor kappa β by FFA – reduce insulin
sensitivity.
LIPID PEROXIDATION & HEPATIC LIPOTOXICITY
FFA upregulates cyst P-450 – enhanced generation of ROS & lipid
per oxidation. Increase FFA concentration –sustained upregulation of
PPAR-α-promotes fatty acid oxidation. FFA – direct toxicity to cell
membrane- toxic fatty acid ethylesters formation – disruption of
17
Other mechanisms
• Portal endotoxemia
• Oxidative stress- induction of cyt P450 2E1- generate ROS –
peroxidase cellular membrane- cell injury.
• Mitochondrial changes
- Mitochondrial ROS formation
- Megamitochondria and crystalline inclusions
-Structural abnormalities
18
Clinical features
Clinical and Laboratory Features of Nonalcoholic Fatty Liver Disease
SYMPTOMS SIGNS LAB
FEATURES Common
None (48-100%)
Fatigue (70%) Hepatomegaly
2 to 4 fold elevation of ALT/AST levels
RUQ pain (50%) AST/ALT ratio <1
Acantosis nigricans S.ALP slightly elevated
Occasional
Neurological Deficits. In children
Normal biluribin and albumin&PT levels Elevated serum ferritin levels.
Increase in uric acid levels
Uncommon
Vague right upper
quadrant pain Splenomegaly
Low titre<1:320)ANA positivity
Fatigue Spider angiomata Elevated transferrin
saturation
Malaise Palmar erythema HFE gene mutation
( C282Y)
19
NAFLD and Normal Aminotranferases
• Occurs in later stages of steato hepatitis.
• “True normal” in obese patients may be lower than that of lean
individuals.
• ALT levels are positively correlated with central obesity and
hyperinsulinemia(leading to ongoing effort to revise normal changes).
• Glitazones normalise transminase levels,but stil criteria for NASH met on follow up liver biopsy.
Histopathology of NAFLD
• Picture of simple steatosis or fatty liver.
20
NASH
• “Lobular inflammation” is hallmark.
21
NASH with cirrhosis
• NASH with cirrhosis ( macrovesicular steatosis,inflammation and
cirrhosis)
• Early Cirrhosis (bridging fibrosis)
22
• Mallory – Denken bodies – perinuclear material- dark staining
23
Histological Features of NAFLD
Present in All or Most Cases
• Macrovesicular steatosis
• Diffuse or centrilobular steatosis; degree may correlate with BMI
• Parenchymal inflammation
• Polymorphonuclear neutrophils, lymphocytes, other mononuclear
cells
• Hepatocyte necrosis
• Ballooning hepatocyte degeneration
Observed with Varied Frequencies
• Perivenular, perisinusoidal, or periportal fibrosis (37%-84%),
moderate to severe in 15%-50%; most prevalent in zone 3
(perivenular)
• Cirrhosis (7%-16% on index biopsy specimen)
• Mallory bodies
• Glycogenated nuclei
• Lipogranulomas
24
Risk Factors for Advanced Nonalcoholic Fatty Liver Disease Clinical
• Older age (>50 years)
• Obesity
• Diabetes mellitus/insulin resistance
• Hypertension
Laboratory
• AST/ALT ratio > 1
• Serum ALT level > twice the upper limit of normal
• Serum triglyceride levels > 155 mg/Dl
Histologic
• Severe steatosis
• Necroinflammatory activity (hepatocyte ballooning, necrosis)
• Stainable iron
Diagnostic approach and evaluation of NAFLD.
Essential Recording
• Age, Gender
• Body weight, body height, waist circumference, hip circumference,
BMI
25
• History of liver disease, including HBV, HCV, autoimmune disease,
DM, hyperlipidimia
• Family History of above mentioned (at least first degree)
NAFLD and Related Biochemical Studies Including OGTT and, IR
• Arthrometry: BMI, Wait/hip ratio
• AST/ALT, rGT, Bilirubin, ALP
• Cholesterol, HDL, TG, UA
• SBP/DBP
• OGTT
• Insulin Resistance
26
HOMA &QUICKI
• Used to estimate insulin resistance by utilising mathematical
manipulation of fasting insulin and glucose levels.
• Homa index: insulin concentration (μU/ml)x fasting glucose
concentration (mmol/l)/22.5 - utilise
• Cutoff level: 2.5 for adult
• Cutoff level: 3.16 for aldolescent
• Keskin M, et al. Padiactric 2005 March
• QUICKI ( quantitative insulin sensitivity index)- the addition
27
28
Role of Liver biopsy
The only diagnostic test that quantifies hepatic steatosis,necrosis and
fibrosis and histological stage of NAFLD is best prognostic indicator.
Indications in
NAFLD:
Peripheral stigmata of chronic liver disease
Splenomegaly
Cytopenia
Abnormal iron studies
Diabetes and/or significant obesity in an individual over the
age of 45
BIOPSY SCORING
• NASH grade and stage(brunt) 0-8
• NASH activity index ( NAI)- 0-12 accounts for steatosis,
necroinflammatory and hepatocyte injury
NAFLD activity score ( NAS)-0-8,steatosis 0-3,lobular and portal
29
NAFLD—Natural History
• Steatosis generally follows a benign course
• Steatosis can progress to NASH ± fibrosis
• NASH with fibrosis has increased liver-related morbidity and
mortality
• Olmsted large study 420pts with definite NAFLD on imaging and
biopsy findings
cirrhosis developed in 3% of patients.
132 patients of NAFLD followed for 18yrs.
clinical outcomes based on degree of injury on an index liver biopsy
specimen.
Cirrhosis and liver related death are common in NAFLD types 3 and
4 than 1 and 2.
• Studies show that long term survival of patients with NASH
significantly better than alcoholic hepatitis .
• 5-10yr outcome of NAFLD associated cirrhosis was similar to that
for HCV associated cirrhosis, although HCC less common in
30
• Studies show that long term survival of patients with NASH
significantly better than alcoholic hepatitis .
Independent predictors of fibrosis progression
• Diabetes mellitus,
• Low initial fibrosis stage
• Higher body mass index.
• Elevated liver enzymes
Non invasive markers of fibrosis in NAFLD
• Fibrotest: This tests incorporates haptoglobin,bil,GGTP,apo
lipoproteinemiaA-1, α2 macroglobulin and necroinflammatory index
combines above markers plus ALT levels. cut off value – 0.70 has
pos predictive value
NAFLD fibrosis score : incorporates age ,BMI,hyperglycemia,
AST/ALT ratio, platelet count and serum albumin level. PPV of
82-90%
• Transient elastography (fibro scan)
• S.dehydroepiandrosterone
• S.hylaluronic acid levels.
31
IMAGING OF NAFLD
• USG abdomen - “bright “ liver of increased echogenicity.
Poor detection if the degree of steatosis is less than 20% to 30%
Initial test of choice for large population screening.
• CT imaging :
Sensitivity and specificity of detecting fatty liver (with
spleen-minus-liver attenuation of 10 Hounsfield units) were 0.84 and 0.99.
liver: spleen ratio <1- steatosis
• MRI :
T 1weighted image shows bright liver.
32
MR proton spectroscopy :
Newer tecnique of quantification of fatty infiltration.most accurate
method of quantifying steatosis
33
Currently non-invasive modalities are unable to detect NASH with
34
MATERIAL AND METHODS
The study was conducted at the department of Medical
Gastroenterology, Institute of Pathology and in the Bernard Institute of
Radiology Department in the Rajiv Gandhi Government General Hospital
Chennai. and in the Madras Medical College Chennai.,
Patients coming to our OPD undergo routine investigations like
CBC,LFT,RFT,Blood sugar and USG Abdomen, among them those who
had fatty liver on USG abdomen were selected, those who with history of
alcohol use and viral hepatitis were excluded
Inclusion
criteria 1. Fatty liver on USG Abdomen
Exclusion criteria
1. Alcohol (more than 20 g/d)
2. HCV infection
3. HBV infection
4. Decompensated CLD
5. HCC / focal lesion on USG or CT
6. Coagulopathy ( for liver Bx)
7. Secondary cause- surgery, Drugs, Pregnancy
35
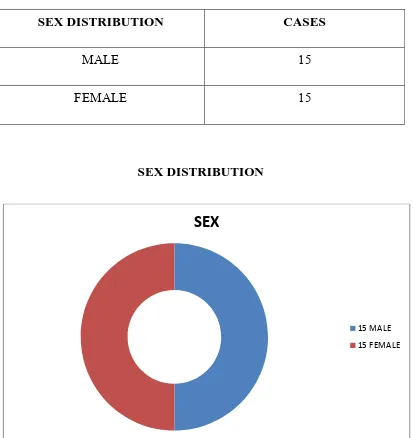
Table 1
SEX DISTRIBUTION
SEX DISTRIBUTION CASES
MALE 15
FEMALE 15
SEX DISTRIBUTION
SEX
15 MALE
DIS 1 1 1 AGE STRIBUT 20-30 30-40 40-50 50-60 0 2 4 6 8 10 12 14
20‐3
TION 30 T AGE DI MALE 1 4 3 7 AGE DI
30‐40
36
Table 2
STRIBUT
FE
STRIBUT
40‐50
TION EMALE 0 3 10 2 TION
50‐60
1 1 1 BMI < 20 20-25 25-30 30-35 0 2 4 6 8 0 2 4
< 20
M 0 T BM MALE 4 3 6 2 BM
20‐25
37
Table 3 MI CHART
FE
MI CHART
25‐30
T EMALE 3 3 8 1 T
> 3
38
These selected patient subjected to the following additional
investigations Biochemical investigation – LFT. HBsAg, anti HCV, BT,
CT, PT/INR.
Detailed history was taken and physical examinations done. All the
patients underwent non contrast CT [ncCT] scan. those patients
underwent non contrast computerized tomography of the abdomen with
machine [GE Medical Systems, Milwaukee, WI] of Bernard Institute Of
Radiology in Rajiv Gandhi Government General Hospital – Chennai .
Following observation are assessed from the Radiology Department.
With Non contrast computerized tomography [nc CT] CT attenuation
index in houns field units [HU] of liver and CT attenuation index in houns
field units [HU] of spleen were assessed.
All the patients after informed concern underwent liver biopsy after
proper aseptic precaution and after screening for coagulation profile in
the side room of ward no : 243 and 245 [male and female ward] of
Medical Gastro Enterology Department Liver biopsy was done with biopsy
true cut biopsy needle using biopsy gun, the specimen was placed in 10%
39
LIVER BIOPSY GUN
After the liver biopsy all the patients were admitted and observed
in the ward for 24 hrs. Successful biopsy specimens were obtained in all
the patients among them two patients [mrs.Ayisha bevi and mr.Prasanth]
required two pass for adequate biopsy sample size, other 28 patients
required one pass only.
Among them one patient [mrs.uniammal] developed severe pain
after the procedure [pain radiating to right shoulder and became dyspneic ]
she has been screened with X ray chest, X ray erect abdomen and USG
Abdomen .no evidence of any pneomothorax noted and the patient was
managed symptomatically . no intervention required and sent home after
40
RESULTS
This study includes total of 30 cases- CT Finding of six patients
Mrs.Muniammal Mrs.Nisha
Mr.Prasanth Mrs. Priya
41
Table 4
CT Scan Finding of 30 patients –Attenuation in HOUNS FIELD UNITS [HU]
NAME AGE SEX CT HU Liver
CT HU spleen
CT HU Liver-spleen
Raja 29 M 26 49 -23
Banumathi 32 F 31 52 -21
Devaki 60 F 26 45 -19
Rangasamy 55 M 28 47 -19
Yoganand 57 M 45 54 -9
Aisha bee 47 F 34 42 -8
Purushothaman 39 M 36 48 -12
Ladly 32 M 26 48 -22
Ram mohan 53 M 26 49 -23
Prabha 44 F 26 48 -22
Ramasamy 55 M 26 42 -6
Ayisha bevi 47 F 28 45 -17
Prasanth 44 M 29 54 -25
Jananki 39 F 26 42 -18
Gopi 43 M 28 48 -20
Nisha 47 F 26 57 -25
Priya 34 F 34 51 -17
Jothi 42 F 28 45 -17
Amudha 48 F 28 45 -16
Lalitha 51 F 28 45 -17
Kumar 45 M 31 45 -14
Yog Vetr Vija San Noo Ana Thir Part Am gas riselvan ayalakshm ngeetha orjagans andvalli ru thiban
mong them t
0.0 10.0 20.0 30.0 40.0 50.0 Mean V a lues 57 35
i 39
40 42 45 51 54 their biops 33. 0 0 0 0 0 0 Minim M M F F F F M M
sy has been
0 2 mal M
Mean C
42 32 26 29 29 26 28 26 28n graded an
28.9
Mild
Histolo
CT HU L
nd its resul
HI MIN GRA GRA GRA Grade 0 Grade I Grade II Grade III H ISTOLOG GRADE NIMAL ADE I ADE II ADE III HISTO 0 2 4 6 8 10 12 MIN BIO HISTOLO GIC LOGICA NIMAL Ta OPSY GRA Ta GICAL G MALE 2 5 4 3 L GRADE
GRADE I
43
able 5 (a) ADING A
Minimal < 5-33% ste 33-66 % s >66 % ste
able 5 (b) GRADE-O
FE
E-OBSER
GRADE II
ADOPTED
<5 % steato eatosis steastosis eatosis OBSERVA EMALE 3 5 7 1 RVATION
GRADE III
44
Minimal Macro-Steatosis
45
Grade I
46
Grade II
47
Grade III
48
Table 6
One way ANOVA to compare mean values between Histology
Histology N Mean Std. Dev Min Max P-Value
CT HU Liver-spleen
Minimal 5 13.00 4.36 8.00 18.00
0.001
Mild 9 15.11 4.17 6.00 19.00
Moderate 12 20.25 2.05 17.00 23.00
Severe 4 24.25 0.96 23.00 25.00
Total 30 18.03 4.85 6.00 25.00
Table 7
Tukey HSD Post Hoc Tests to compare multiple pairwise comparisons Dependent
Variable Pairs
Mean
Difference P-Value
CT HU Liver-spleen
Minimal Mild -2.111 0.640
Moderate -7.250 0.001
Severe -11.250 0.001
Mild Moderate -5.139 0.006
Severe -9.139 0.001
[image:59.612.113.515.462.706.2]0.0 5.0 10.0 15.0 20.0 25.0 30.0 Mean V a lues 13.0 Minima
Me
1 al Man CT H
49
15.1
Mild
Histolo
HU Liver
Live Rati One way er Spleen io 0.0 0.2 0.4 0.6 0.8 1.0 Mean V a lu es y ANOVA Histology Minimal Mild Moderate Severe Total 0.7 Minim
Me
T to compaN Me
5 0.7
9 0.6
12 0.5
4 0.4
30 0.6
0
mal M
ean Live
50
Table 8 are mean v
ean Std. D
719 0.097
638 0.056
76 0.041
497 0.043
608 0.087
0.6
Mild M
Histolo
er Splee
values betw
Dev Min
7 0.620
6 0.580
0.530
0.460
7 0.460
51
Tukey HSD Post Hoc Tests to compare multiple pairwise comparisons
Dependent
Variable Pairs
Mean
Difference P-Value
Liver Spleen Ratio
Minimal Mild 0.081 0.081
Moderate 0.143 0.001
Severe 0.222 0.001
Mild Moderate 0.062 0.092
Severe 0.141 0.002
Moderate Severe 0.079 0.110
Tukey HSD Post Hoc Tests to compare multiple pairwise comparisons
Dependent
Variable Pairs
Mean
Difference P-Value
CT HU Liver Minimal Mild 4.111 0.233
Moderate 5.167 0.072
Severe 6.250 0.090
Mild Moderate 1.056 0.920
Severe 2.139 0.783
52
Tukey HSD Post Hoc Tests to compare multiple pairwise comparisons
Dependent
Variable Pairs
Mean
Difference P-Value
BMI Minimal Mild -0.249 1.000
Moderate 1.173 0.967
Severe -1.660 0.954
Mild Moderate 1.422 0.905
Severe -1.411 0.960
Moderate Severe -2.833 0.734
Tukey HSD Post Hoc Tests to compare multiple pairwise comparisons
Variable Pairs Mean
Difference P-Value
Liver Spleen Ratio Mild Moderate .05064 0.280
Severe .06243 0.608
53
CHARTS
54
DISCUSSION
The degree of steatosis in NAFLD patients is usually assessed with
invasive technique like liver biopsy [leon A.Adams,et al]7, Because of the
invasive method of the liver biopsy and its painful nature of the procedure
with moderate complication rate there has always been a need to find
alternative less invasive, less painful, quick method to accurately diagnose
NAFLD is the need of the hour.
CT scan and MRI scan are well established imaging modalities for
diagnosis of various disorders. These imaging modalities can also assess
the degree of fat as accurately as histology of liver tissue. This accuracy of
grading of fatty liver by CT and MRI has been utilized by various
investigators. Olmsted etal large study 420pts with definte NAFLD on
imaging and liver biopsy. But only few studies are available [Nathan et al;
sheela ramesh; arun j.sanyal et al]1,2,3.
These authors tried to validate CT scan as non invasive diagnostic
modality for this purpose, by comparing against gold standard liver biopsy.
but their studies have been done in smallnumber [ie., 15 subjects].
Most of the studies are with magnetic resonance image [MRI].few
studies are with computerized tomography [Nathan et al]1. These studies
55
In our study non contrast computerized tomography scan [nc CT]
has been done in all the patients [no of sample size is 30] compared to
previous studies the number is doubled.
Initial evaluation of NAFLD requires ultra sound scan of
abdomen.just as In previous studies the investigators used USG for initial
evaluation. But this USG abdomen scan can be used for screening purpose
only. It is not useful for semi quantitative assessment of steatosis.
Non contrast CT scan [nc CT] has been done in both the studies.
Because non contrast CT scan will give accurate measurement of fat
content of the liver measured as a hounce field unit is compared with
nearby organ spleen. Both the studies [our study and the previous study]
followed the same method. Use of contrast is avoided because contrast will
decrease the liver attenuation in hounce field unit. It will give false positive
results.
The diagnostic sensitivity of the CT depends upon the severity of
steatosis. HU will fall when more steatosis is present in the liver. In the
milder form of steatosis the HU will be in higher values or equal to spleen
value.
The study has confirmed the nc CT is useful technique delineating
56
difference between CTHU liver to spleen is significantly and directly
correlated to the histology in HMS.
CT assessment of hepatic steatosis in previous studies was criticized
on the basis of limited accuracy to estimate hepatic fat content accurately
[etal] but such critisizism cannot be leveled with our datas
Most of the studies conducted earlier [Nathan j.shore etal]1 is not a
direct comparison between macrosteatosis to liver HU unit difference, only
one study compared [Nathan et al] 1 hepatic macrosteatosis HMS to CT
HU – liver difference, those studies are in small number.
The strength of this study,that it is a direct comparison of liver CT
attenuation with histological grade of steatosis, it is not included the stage
of fibrosis. In our study we have adopted grading of steatosis in four stages
namely grade 0 is minimal <5 % of macrosteatosis, grade I is 5-33 % of
macrosteatosis, grade II is 33-66 % of macrosteatosis, and grade III is
more than 66 % When compared to previous studies [Nathan j.shore
etal]1 adapted hepatic macrsteatosis as more than 30 % [HMS].and this
value has been compared to hepatic attenuation index in HU and also there
is no control arm in the previous mentioned studies [Nathan j.shore etal]1.
To delineate in which grade of HMS will directly correlate to hepatic CT
57
Nathan j.shore etal1 in their study have taken biopsy from both
lobes of liver. And the biopsy is a wedge biopsy taken at the time of
bariatric surgery. The tissue sample size is compared to our study is larger.
And also they studied the liver tissue triglyceride’s concentration by
biochemical methods. But in our study biopsy has been taken by true cut
needle biopsy using biopsy gun and the tissue sample is small and only
taken from the right lobe of the liver alone, in this study no biochemical
analysis of liver tissue is made ,the possibility of false negative results [ if
the normal liver tissue in the biopsied sample ]could be possible and a false
positive results [a focal nodular fatty liver] may be another possibility to
give grade III macro steatosis on histology.
Previous study by qayyum etal. In his study he has included higher
BMI patients only [BMI > 30] when compared to this study where in we
have included all the patients with BMI starting from 17.5 - 32 . In our
study the inclusion criteria is based on the ultra sonogram finding of fatty
liver. So that lean NASH can be calculated with our study. Out of 30
patients lean NASH is [0 %].
In various studies sample size is small less than 15 patients
[Nathan j.shore etal]1compared to this study the sample size is 30 subjects.
But one drawback of our study, there is no control arm, if a control arm is
58
we can accurately predict the presence of NAFLD. It could served as a
quantitative assessment of NAFLD score. The control arm was not
designed due to the ethical point of view as well as risk of liver biopsy in
normal subjects. Even though if the normal subject found to be detected
having NAFLD. There is no definite treatment option available till Date.
Also associated risk of radiation exposure in normal subjects for an
investigation for a non clinical purpose. The studied patients under went
plain CT abdomen, there is a life time risk of medical radiation but is a
modest radiation exposure and also the abdominal region only exposed to
radiation and not to the entire body.
59
CONCLUSION
1] There is definite correlation between non contrast computerized
tomography [nc CT] with liver biopsy in this study [p value 0.001]
2] Hence non contrast computerized tomography [nc CT] can be used
as a sole investigation for defining NAFLD. invasive liver biopsy
REFERENCES
1. Nathan J sores, Flegal KM, Carroll MD, Ogden CL, Johnson CL. Prevalence and trends in obesity among US adults, 1999–2000. JAMA. 2002;288:1723–1727. doi: 10.1001/jama.288.14.1723. [PubMed] [Cross Ref]
2. Nair S, Mason A, Eason J, Loss G, Perrillo RP. Is obesity an independent risk factor for hepatocellular carcinoma in cirrhosis? Hepatology. 2002;36:150–155. doi: 10.1053/jhep.2002.33713. [PubMed] [Cross Ref]
3. Wanless IR, Lentz JS. Fatty liver hepatitis (steatohepatitis) and obesity: An autopsy study with analysis of risk factors. Hepatology. 1990;12:1106–1110. doi: 10.1002/hep.1840120505. [PubMed] [Cross Ref]
4. Adinolfi LE, Gambardella M, Andreana A, Tripodi MF, Utili R, Ruggiero G. Steatosis accelerates the progression of liver damage of chronic hepatitis C patients and correlates with specific HCV genotype and visceral obesity. Hepatology. 2001;33:1358–1364. doi: 10.1053/jhep.2001.24432. [PubMed] [Cross Ref]
5. Browning JD, Szczepaniak LS, Dobbins R, Nuremberg P, Horton JD, Cohen JC, Grundy SM, Hobbs HH. Prevalence of hepatic steatosis in an urban population in the United States: Impact of ethnicity. Hepatology. 2004;40:1387–1395. doi: 10.1002/hep.20466. [PubMed] [Cross Ref]
Nonalcoholic fatty liver, steatohepatitis, and the metabolic syndrome. Hepatology. 2003;37:917–923. doi: 10.1053/jhep.2003.50161. [PubMed] [Cross Ref]
7. Xirouchakis E, Sigalas A, Manousou P, Calvaruso V, Pleguezuelo M, Corbani A, Maimone S, Patch D, Burroughs AK. Models for non-alcoholic fatty liver disease: A link with vascular risk. Curr Pharm Des. 2008;14:378–384. doi: 10.2174/138161208783497705. [PubMed] [Cross Ref]
8. Rockey DC, Caldwell SH, Goodman ZD, Nelson RC, Smith AD. Liver biopsy. Hepatology. 2009;49:1017–1044. doi: 10.1002/hep.22742. [PubMed] [Cross Ref]
9. Qayyum A, Chen DM, Breiman RS, Westphalen AC, Yeh BM, Jones KD, Lu Y, Coakley FV, Callen PW. Evaluation of diffuse liver steatosis by ultrasound, computed tomography, and magnetic resonance imaging: Which modality is best? Clin Imaging. 2009;33:110–115. doi: 10.1016/j.clinimag.2008.06.036. [PMC free article] [PubMed] [Cross Ref]
10. Schwenzer NF, Springer F, Schraml C, Stefan N, Machann J, Schick F. Non-invasive assessment and quantification of liver steatosis by ultrasound, computed tomography and magnetic resonance. J Hepatol. 2009;51:433–445. doi: 10.1016/j.jhep.2009.05.023. [PubMed] [Cross Ref]
12. Vuppalanchi R, Cummings OW, Saxena R, Ulbright TM, Martis N, Jones DR, Bansal N, Chalasani N. Relationship among histologic, radiologic, and biochemical assessments of hepatic steatosis: A study of human liver samples. J Clin Gastroenterol. 2007;41:206–210. doi: 10.1097/01.mcg.0000225515.28536.3a. [PubMed] [Cross Ref]
13. Lee SW, Park SH, Kim KW, Choi EK, Shin YM, Kim PN, Lee KH, Yu ES, Hwang S, Lee SG. Unenhanced CT for assessment of macrovesicular hepatic steatosis in living liver donors: Comparison of visual grading with liver attenuation index. Radiology. 2007;244:479–485. doi: 10.1148/radiol.2442061177. [PubMed] [Cross Ref]
14. Contos MJ, Sanyal AJ. The clinicopathologic spectrum and management of nonalcoholic fatty liver disease. Adv Anat Pathol 2002;9: 37–51.
15. Clark JM, Brancati FL, Diehl AM. The prevalence and etiology of elevated aminotransferase levels in the United States. Am J Gastroenterol 2003;98:960–967.
16. Third Report of the National Cholesterol Education Program (NCEP) expert panel on detection, evaluation, and treatment of high blood cholesterol in adults (adult treatment panel III) final report. Circulation 2002;106:3143–3421.
18. Chitturi S, Farrell GC. Etiopathogenesis of nonalcoholic steatohepatitis. Semin Liver Dis 2001;21:27–41.
19. Ford ES, Giles WH, Dietz WH. Prevalence of the metabolic syndrome among US adults: findings from the third National Health and Nutrition Examination Survey. JAMA 2002;287:356–359.
20. FlegalKM,CarrollMD,Ogden CL, Johnson CL. Prevalence and trends in obesity among US adults, 1999–2000. JAMA 2002;288:1723–1727.
21. Haque M, Sanyal AJ. The metabolic abnormalities associated with non-alcoholic fatty liver disease. Best Pract Res Clin Gastroenterol 2002;16:709–731.
22. Skelly MM, James PD, Ryder SD. Findings on liver biopsy to investigate abnormal liver function tests in the absence of diagnostic serology. J Hepatol 2001;35:195–199.
23. Mathiesen UL, Franzen LE, Fryden A, Foberg U, Bodemar G. Theclinical significance of slightly to moderately increased liver transaminase values in asymptomatic patients. Scand J Gast roenterol 1999;34:85–91.
25. Diehl AM. Fatty liver, hypertension, and the metabolic syndrome. Gut 2004;53:923–924.
26. Marchesini G, Bugianesi E, Forlani G, Cerrelli F, Lenzi M, Manini R, et al. Nonalcoholic fatty liver, steatohepatitis, and the metabolic syndrome. Hepatology 2003;37:917–923.
27. Clark JM, Diehl AM. Hepatic steatosis and type 2 diabetes mellitus. Curr Diab Rep 2002;2:210–215.
28. Falck-Ytter Y, Younossi ZM, Marchesini G, McCullough AJ. Clinical features and natural history of nonalcoholic steatosis syndromes. Semin Liver Dis 2001;21:17–26.
29. Youssef W, McCullough AJ. Diabetes mellitus, obesity, and hepatic steatosis. Semin Gastrointest Dis 2002;13:17–30.
30. Neuschwander-Tetri BA, Bacon BR. Nonalcoholic steatohepatitis. Med Clin North Am 1996;80:1147–1166.
31. Haller DL, Sargeant C, Luketic VA, Sanyal AJ. A behavioral analysis of nonalcoholic fatty liver disease. Hepatology 2003;38:233A.
32. Bacon BR, Farahvash MJ, Janney CG, Neuschwander-Tetri BA. Nonalcoholic steatohepatitis: an expanded clinical entity. Gastroenterology 1994;107:1103–1109.
34. Powell EE, Cooksley WG, Hanson R, Searle J, Halliday JW, Powell LW. The natural history of nonalcoholic steatohepatitis: a follow-up study of forty-two patients for up to 21 years. Hepatology 1990;11:74–80.
35. S. Ramesh, A.J. Sanyal / Journal of Hepatology 42 (2005) S2–S12 S11 [23] Clouston AD, Powell EE. Interaction of non-alcoholic fatty liver disease with other liver diseases. Best Pract Res Clin Gastroenterol 2002;16:767–781.
36. Matteoni CA, Younossi ZM, Gramlich T, Boparai N, Liu YC, McCullough AJ. Nonalcoholic fatty liver disease: a spectrum of clinical and pathological severity. Gastroenterology 1999;116:1413– 1419.
37. Angulo P, Keach JC, Batts KP, Lindor KD. Independent predictors of liver fibrosis in patients with nonalcoholic steatohepatitis. Hepatology 1999;30:1356–1362.
38. Sanyal AJ. AGA technical review on nonalcoholic fatty liver disease. Gastroenterology 2002;123:1705–1725.
39. Yajima Y, Ohta K, Narui T, Abe R, Suzuki H, Ohtsuki M. Ultrasonographical diagnosis of fatty liver: significance of the liverkidney contrast. Tohoku J Exp Med 1983;139:43–50.
41. Lee RG. Nonalcoholic steatohepatitis: a study of 49 patients. Hum Pathol 1989;20:594–598.
42. Saadeh S, Younossi ZM, Remer EM, Gramlich T, Ong JP, Hurley M, et al. The utility of radiological imaging in nonalcoholic fatty liver disease. Gastroenterology 2002;123:745–750.
43. Jacobs JE, Birnbaum BA, Shapiro MA, Langlotz CP, Slosman F, Rubesin SE, et al. Diagnostic criteria for fatty infiltration of the liver on contrast-enhanced helical CT. AJR Am J Roentgenol 1998;171: 659–664.
45. Sorbi D, McGill DB, Thistle JL, Therneau TM, Henry J, Lindor KD. An assessment of the role of liver biopsies in asymptomatic patients with chronic liver test abnormalities. Am J Gastroenterol 2000;95: 3206–3210.
46. Caldwell SH, Oelsner DH, Iezzoni JC, Hespenheide EE, Battle EH, Driscoll CJ. Cryptogenic cirrhosis: clinical characterization and risk factors for underlying disease. Hepatology 1999;29:664–669.
47. Sorbi D, Boynton J, Lindor KD. The ratio of aspartate aminotransferase to alanine aminotransferase: potential value in differentiating nonalcoholic steatohepatitis from alcoholic liver disease. Am J Gastroenterol 1999;94:1018–1022.
48. Lewis KO, Paton A. ABC of alcohol: tools of detection. Br Med J (Clin Res Ed) 1981;283:1531–1532.
50. Nalpas B, Vassault A, Charpin S, Lacour B, Berthelot P. Serum mitochondrial aspartate aminotransferase as a marker of chronic alcoholism: diagnostic value and interpretation in a liver unit.Hepatology 1986;6:608–614.
51. Storey EL, Mack U, Powell LW, Halliday JW. Use of chromatofocusing to detect a transferrin variant in serum of alcoholic subjects. Clin Chem 1985;31:1543–1545.
52. Marchesini G, Brizi M, Bianchi G, Tomassetti S, Bugianesi E, Lenzi M, et al. Nonalcoholic fatty liver disease: a feature of the metabolic syndrome. Diabetes 2001;50:1844–1850.
53. Garg A, Misra A. Hepatic steatosis, insulin resistance, and adipose tissue disorders. J Clin Endocrinol Metab 2002;87:3019–3022.
54. Garg A. Lipodystrophies. Am J Med 2000;108:143–152.
55. Executive summary of the clinical guidelines on the identification, evaluation, and treatment of overweight and obesity in adults. Arch Intern Med 1998;158:1855–1867.
56. Bray GA, Nielsen SJ, Popkin BM. Consumption of high-fructose corn syrup in beverages may play a role in the epidemic of obesity. Am J Clin Nutr 2004;79:537–543.
57. Archer WR, Lamarche B, Deriaz O, Landry N, Corneau L, Despres JP, et al. Variations in body composition and plasma lipids in response to a high-carbohydrate diet. Obes Res 2003;11:978–986.
59. Hayes KC. Saturated fats and blood lipids: new slant on an old story. Can J Cardiol 1995;11:39G–446.
60. Kwiterovich Jr PO. The effect of dietary fat, antioxidants, and prooxidants on blood lipids, lipoproteins, and atherosclerosis. J Am Diet Assoc 1997;97:S31–S41.
61. Gaziano JM, Manson JE. Diet and heart disease. The role of fat, alcohol, and antioxidants. Cardiol Clin 1996;14:69–83.
62. Knowler WC, Barrett-Connor E, Fowler SE, Hamman RF, Lachin JM, Walker EA, et al. Reduction in the incidence of type 2 diabetes with lifestyle intervention or metformin. N Engl J Med 2002;346:393–403.
63. Kriska A. Can a physically active lifestyle prevent type 2 diabetes? Exerc Sport Sci Rev 2003;31:132–137.
64. Rollins G. Moderate exercise reduces the risk of heart disease and death in men with type 2 diabetes. Rep Med Guidelines Outcomes Res 2003;14:10–12.
65. Hollander P. Orlistat in the treatment of obesity. Prim Care 2003;30: 427–440.
66. Holt R. Orlistat reduces features of the metabolic syndrome: the XENDOS study. Diabetes Obes Metab 2003;5:356.
68. Ryan DH. Use of sibutramine to treat obesity. Prim Care 2003;30: 405–426.
69. Sabuncu T, Nazligul Y, Karaoglanoglu M, Ucar E, Kilic FB. The effects of sibutramine and orlistat on the ultrasonographic findings, insulin resistance and liver enzyme levels in obese patients with nonalcoholic steatohepatitis. Rom J Gastroenterol 2003;12:189–192.
70. Luyckx FH, Scheen AJ, Desaive C, Thiry A, Lefebvre PJ. Parallel reversibility of biological markers of the metabolic syndrome and liver steatosis after gastroplasty-induced weight loss in severe obesity. J Clin Endocrinol Metab 1999;84:4293.
71. Luyckx FH, Desaive C, Thiry A, Dewe W, Scheen AJ, Gielen JE, et al. Liver abnormalities in severely obese subjects: effect of drastic weight loss after gastroplasty. Int J Obes Relat Metab Disord 1998;22: 222–226.
CONSENT FORM
DESCRIPTION: You are invited to participate in a research study on liver disease. We are going to assess the normal values of liver biochemistry ,liver scan and liver
tissue biopsy in healthy adults.
PROCEDURES: You will be asked to do ultra sound scan , CT-Scan, Liver biopsy (small piece of liver tissue by a small needle biopsy )and Blood test provide a sample
of blood (1 tablespoon). The blood will be taken from your arm at the same time you
are going to donate the blood.
The results of the study of your samples will be used for research purposes only and
you will not be told the results of the tests.
RISKS AND BENEFITS: there are mild risks of bleeding from liver puncture site associated pain with this study.
TIME INVOLVEMENT: Post liver biopsy you have to stay for one day for observation of any complication
PAYMENTS: You will not be paid to participate in this study.
I, ____________________________________________ , hereby consent to do USG
abdomen, CT abdomen , liver biopsy ,Blood sample which I have donated as a
voluntarily for the purpose of estimating the function of the liver in normal individuals.
I have understood that this sample will be used for research and the results will not be
available to me. I have also understood that this does not involve any additional
procedure.
Signature of the donor
Name of the Donor Witness – Signature, Name and address
PROFORMA
NAME
AGE/SEX
GE.No.
CBC
LFT
PT/INR
BT/CT
HBsAg
AntiHCV
BLOOD SUGAR
F/PP
BMI
WAIST/HIP
ALOHOL CONSUPTION
QUANTITY IN GRAMS
USG ABDOMEN
CT ABDOMEN
LIVER/SPLEEN RATIO
LIVER-SPLEEN INDEX
LIEVER BIOPSY
LENGTH
FINDING
SL.No NAME AGE SEX HEIGHT WEIGHT BMI USG abdomen CT HU Liver CT HU spleen CT HU Liver‐spleen HISTOLOGY LFT1 LFT‐AST LFT‐ALT LFT‐SAP
1 raja 29 m 155 75 31.2 3 26 49 ‐23 3 1.12 25.7 39.9 131
2 banumathi 32 f 155 70 29.1 1 31 52 ‐21 2 1.4 29 32 120
3 devaki 60 f 152 68 29.4 2 26 45 ‐19 2 0.9 34 42 92
4 rangasamy 55 m 168 72 25.5 1 28 47 ‐19 1 0.9 30 23 83
5 yoganand 57 m 168 80 28.3 2 45 54 ‐9 0 1.1 23 29 92
6 aisha bee 47 f 150 72 32 1 34 42 ‐8 0 0.7 59 44 152
7 purushothaman 39 m 169 80 28 1 36 48 ‐12 1 0.9 36 39 75
8 ladly 32 m 152 70 30.3 2 26 48 ‐22 2 1.1 94 86 132
9 ram mohan 53 m 155 69 28.7 1 26 49 ‐23 2 1.3 21 26 102
10 prabha 44 f 153 45 19.2 2 26 48 ‐22 2 1 56 76 134
11 ramasamy 55 m 165 50 18.4 3 26 42 ‐6 1 0.7 34 36 120
12 ayisha bevi 47 f 156 69 28.4 1 28 45 ‐17 1 1.2 29 23 84
13 prasanth 44 m 160 65 25.4 2 29 54 ‐25 3 0.9 102 109 196
14 jananki 39 f 158 50 20 1 26 42 ‐18 0 0.7 34 31 98
15 gopi 43 m 162 52 19.8 1 28 48 ‐20 2 0.8 34 36 102
16 nisha 47 f 158 71 28.4 2 26 57 ‐25 3 4.1 32 34 98
17 priya 34 f 157 68 27.6 2 34 51 ‐17 2 0.7 231 246 163
18 jothi 42 f 154 48 20.2 2 28 45 ‐17 2 0.8 24 19 98
19 amudha 48 f 160 48 18.7 2 28 45 ‐16 1 2.1 19 17 102
20 lalitha 51 f 149 63 28.4 1 28 45 ‐17 1 0.8 83 96 159
21 kumar 45 m 162 54 20.6 2 31 45 ‐14 0 1.8 19 17 109
22 muniammal 48 m 158 70 28 1 26 45 ‐19 1 0.8 64 96 128
23 yogas 57 m 168 70 24.8 1 32 45 ‐13 1 0.9 124 34 102
24 vetriselvan 35 m 159 53 21 2 26 56 ‐24 3 1.8 34 31 103
25 vijayalakshmi 39 f 155 56 23.3 1 29 45 ‐16 0 0.7 96 96 104
26 sangeetha 40 f 154 62 26.1 2 29 48 ‐19 2 2.1 19 20 96
27 noorjagan 42 f 150 42 17.5 2 26 48 ‐19 2 0.9 47 51 102
28 anandvalli 45 f 143 68 25.6 1 28 45 ‐17 1 1.2 29 34 106
29 thiru 51 m 167 47 17.7 2 26 48 ‐22 2 1 34 39 123
30 parthiban 54 m 165 50 18.4 2 28 50 ‐22 2 1 29 34 96