DISSERTATION
ON
STUDY OF PLASMA FIBRINOGEN IN ACUTE
MYOCARDIAL INFARCTION
Dissertation submitted to
THE TAMILNADU DR. M.G.R. MEDICAL UNIVERSITY
In partial fulfilment of the regulations for the award of the degree of
M.D. -GENERAL MEDICINE- BRANCH – I
THANJAVUR MEDICAL COLLEGE,
THANJAVUR - 613 004.
THE TAMILNADU DR. M.G.R. MEDICAL UNIVERSITY
CHENNAI - 600 032.
CERTIFICATE
This is to certify that this dissertation entitled “STUDY OF PLASMA
FIBRINOGEN IN ACUTE MYOCARDIAL INFARCTION.” is the
bonafide original work of Dr. NARENDRAN.M in partial fulfilment of the
requirements for M.D Branch -I (General Medicine) Examination of the
Tamilnadu Dr. M.G.R. Medical University to be held in APRIL - 2013. The
period of study was from October– 2011 - November 2012.
Prof.Dr.S.MUTHUKUMARAN, M.D.
Head of the Department,
Department of Internal Medicine, Thanjavur Medical College,
Thanjavur - 613 004.
Prof. Dr.C.GUNASEKARAN, M.D.,DCH.
The Dean I/C,
Thanjavur Medical College.
Thanjavur - 613 004.
Prof. Dr. C.GANESAN M.D.,
Unit Chief M-5
Department of Internal Medicine, Thanjavur Medical College.
DECLARATION
I, Dr.NARENDRAN. M, solemnly declare that the dissertation
titled “DISSERTATION ON THE STUDY OF PLASMA FIBRINOGEN IN
ACUTE MYOCARDIAL INFARCTION ” is a bonafide work done by me at
Thanjavur Medical College, Thanjavur during October 2011 - November 2012
under the guidance and supervision of Prof.Dr.C.GANESAN, M.D., Unit Chief
M-5, Thanjavur Medical College, Thanjavur.
This dissertation is submitted to Tamilnadu Dr. M.G.R Medical
University towards partial fulfilment of requirement for the award of M.D.
degree (Branch -I) in General Medicine.
Place: Thanjavur.
ACKNOWLEDGEMENT
I gratefully acknowledge and my sincere thanks to The Dean I/C,
Prof.Dr.C.GUNASEKARAN, M.D.,DCH., Thanjavur Medical College,
Thanjavur, for allowing me to do this dissertation and utilize the institutional
facilities.
I am extremely grateful to Prof.Dr.S.MUTHUKUMARAN M.D.,Head
of the Department, Department of Internal Medicine, Thanjavur Medical
College, for his full-pledged support throughout my study and valuable
suggestions and guidance during my study and my post graduate period.
I am greatly indebted to Prof.Dr.C.GANESAN MD my Professor and
Unit Chief, who is my guide in this study, for his timely suggestions, constant
encouragement and scholarly guidance in my study and post graduate period.
I profoundly thank my professors Prof.Dr.P.G.SANKARANARAYANAN
MD, Prof.Dr.K.NAGARAJAN M.D, Prof.Dr.S.MANOHARAN M.D.
Prof.Dr.D.NEHRU MD DMRD, and Dr.C.PARANTHAKAN M.D.,
(Registrar), for their advice, guidance and valuable criticism which enabled me
I also express my heartiest thankfulness to my former unit chiefs
Prof.Dr.V.RAJENDRAN MD., & Prof.Dr.M.SIVASANKARAN MD., for
their advice and guidance.
I would like to express my gratitude to Prof. DR.G. SENTHIL KUMAR ,
M.D., D.M.., Department of cardiology and Prof. DR. ARUMUGAM, M.D.,
Department of pathology for their immense help in the study which enabled me to
complete this work and also permitting me to utilize the facilities available in
the department.
My sincere thanks to assistant professors Dr.GOWTHAMAN.G,M.D.,
Dr.SHRI RAM GANESH, M.D., and DR.MAGESH.A, M.D., for their
motivation, encouragement and support.
A special mention of thanks to all the patients who participated in this
study for their kind cooperation.
I would like to thank my colleagues and friends who have been a constant
ABSTRACT
BACKGROUND AND OBJECTIVES OF THE STUDY
Myocardial infarction is one of the commonest cause of death in the developing and developed countries. Indians are more prone to coronary artery disease but conventional risk factors do not explain the high rates of Coronary Artery Disease among Indians. Myocardial infarction is claiming a large number of lives i n i n d i a . An impressive difference was absence of traditional risk factors in a third of them. Novel risk factors like homocysteine, lipoprotein (a), small LDL particle and fibrinogen may play a significant role in these patients. The aim of this study is to estimate fibrinogen levels in myocardial infarction patients and to study association of these novel risk factors with conventional risk factors.
METHODOLOGY
The present study included 70 patients who were admitted to I M C U a n d I C C U o f T h a n j a v u r m e d i c a l c o l l e g e h ospital during the period of O c t 2011–Nov 2012 fulfilling WHO criteria for acute myocardial infarction, presenting within 48 hours. Traditional risk factors were studied in addition to studying plasma fibrinogen levels.
RESULTS
common 42 (60.9 %) risk factor in the present study followed by smoking 39 (55.7 %). High mean plasma fibrinogen (440.61 ± 75.4 mg/dl) levels was noted among patients. Significant association was noted between plasma f i b r i n o g e n and risk factors like dyslipidemia, obesity , diabetes and smoking . High plasma fibrinogen was observed in patients with chronic alcoholism, but not statistically significant.
INTERPRETATION AND CONCLUSION
In addition to the conventional risk factors of myocardial infarction, a high plasma fibrinogen levels were noted in patients with acute Myocardial infarction.
However, larger studies need to be done to substantiate these findings.
CONTENTS
SL.
NO. TITLE PAGE NO.
1 INTRODUCTION 1
2 AIM OF THE STUDY 3
3 REVIEW OF LITERATURE 4
4 MATERIALS AND METHODS 46
5 RESULTS 50
6 DISCUSSION 70
7 CONCLUSION 77
8 SUMMARY 79
9 ANNEXURES
ANNEXURE –I BIBLIOGRAPHY
ANNEXURE –II PROFORMA
ANNEXURE –III MASTER CHART
ANNEXURE –IV ABBREVIATIONS
INTRODUCTION
Cardiovascular disease is one among the major global health problems
presenting in epidemic proportions. Myocardial infarction is one of the
commonest cause of death, including low and middle income countries. India
is in a transition phase from the state of high incidence of communicable
disease to a state of high incidence of non communicable disease. India’s
contribution to the rising global burden of coronary artery disease is
significant.1
High risks of coronary artery disease reported in south Asian
populations, particularly in Indians regardless of the country in which they
live.
During the last twenty years it is noted that Indians have a higher
incidence of coronary artery disease. Myocardial infarction claims a large
number of lives even before they reach fifth decade of life. Myocardial
infarction occurring at early age is associated with absence of usual risk
factors such as systemic hypertension, smoking, diabetes mellitus and
hyperlipidemia in about one third of them.2
The coronary artery disease manifest as acute coronary syndrome
including unstable angina, ST elevation MI and Non ST elevation MI. There
Acute myocardial infarction is due to sudden interruption of coronary
blood flow. It is the complication of thrombotic occlusion of already narrowed
coronary artery due to atherosclerosis.
The mortality following the acute coronary event depends on the size of
the infarct. The left anterior descending supplies wide areas including bundle
branches, ventricular wall and septum hence its occlusion results in larger area
of infarct.
Salient features of coronary artery disease among Indians when compared
to other ethnic groups.3
More than two fold higher prevalence
A decade earlier onset of first MI
Nearly fivefold higher incidence of MI and mortality in younger
population less than 40 years
Severity of the disease
Lower prevalence of traditional risk factors
Higher prevalence of newer risk factors including fibrinogen,
AIM OF THE STUDY
1. To study fibrinogen levels in subjects with acute myocardial infarction.
2. To compare the novel risk factors like fibrinogen with conventional
risk factors like smoking, hypertension, diabetes mellitus, obesity and
REVIEW OF LITERATURE
Myocardial infarction
Definition
The World Health Organisation (WHO) definition includes the presence
of two of the following4
1. Symptoms of myocardial infarction
2. Cardiac markers (enzymes) elevated
3. ECG showing characteristic electrocardiographic changes
Newer diagnostic criteria according to the American College of
Cardiology and European Society of Cardiology.5
It requires the presence of one of the following diagnostic criteria to
satisfy the diagnosis of acute, evolving or recent myocardial infarction.
1. Typical rise and gradual fall (troponin I/T) or more rapid rise and fall
(CK-MBs) of biochemical markers of cardiac muscle necrosis with any
one of the following:
a. Symptoms of myocardial ischemia
c. ECG changes suggestive of ischemia (ST segment elevation /
depression)
d. Coronary artery intervention (Eg. Coronary angioplasty)
2. Pathological findings of an acute Myocardial infarction
Risk factors
According to American heart association (AHA) prevention conference
held in 1999, risk factors are classified to three categories.6
1. Traditional /Conventional risk factors.
Cigarette smoking,
Low HDL cholesterol
Elevated serum cholesterol
Hypertension
Diabetes mellitus
2. Predisposing factors
Male sex
Physical inactivity
Family history of CAHD
3. Conditional factors
Homocysteine
Fibrinogen
Small LDL particle
C-reactive protein
Lipoprotein (a)
Emerging risk factors
Nitrotyrosine
Oxidative stress
Asymmetric dimethylarginine
Myeloperoxidase
Smoking
Cigarette smoking is the one of the most important modifiable risk
factor. It interacts with other risk factors to increase the risk multi fold. It
accelerates coronary atherosclerosis in men and women, at all ages. Smoking
increases the risk of thrombosis, plaque rupture, myocardial infarction,
It increases the oxygen demand of myocardial tissue and hence worsens
angina. Coronary artery disease causes about 40% of smoking related
deaths, and in addition to it around 8% of them attributable to passive smoke
exposure.
The most important and modifiable cause of coronary heart disease
and death is smoking. Smoking correlates strongly with atherosclerotic
disease , usually in association with other risk factors.7
It has been found that 28% of all deaths from coronary heart
disease are attributed to tobacco smoking. Compared with non-smokers,
current smokers have a 70% increased risk of fatal coronary event and a two
to four fold increased risk of non-fatal CAD.8
In a recent major overview, smoking cessation reduced coronary heart
disease mortality by 36% as compared with mortality in subjects who
continued smoking.9
Smoking was the most common risk factor (87%) in a study by Siwach
SB et al. who studied the profile of acute MI in young patients (below 40
Hyperlipidemia
Abnormalities in plasma lipoproteins and derangements in lipid
metabolism rank as the most firmly established and best understood risk factor
for atherosclerosis. The 4S trial demonstrated an approximately 40%
reduction in incidence of myocardial infarction as well as a further
reduction in the need of procedural intervention in hyperlipidemic
individuals.11
In a study by Weinberger et al., hyperlipidemia was present in
only four patients among 30 young patients.12
In a study by Kanitz et al., Hyperlipidemia was present in 20% of young
adult patients.13
Hypertension
The elevated blood pressure has been shown to be associated with
accelerated atherosclerosis and coronary heart disease. Elevated systolic
blood pressure/diastolic blood pressure is clearly associated with an increased
In Framingham heart study even high normal blood pressure augements
risk of cardiovascular disease two fold compared with lower levels.
Hypertension is not a common risk factor in CAD in young adults. In a
study by Zimmerman FH et al., hypertension and diabetes were more frequent
in older men and women.15
In study by Al Khadra et al., hypertension was documented in 18.5% of
young individuals with acute myocardial infarction.16
Diabetes mellitus
Diabetes mellitus is the most important CAD risk equivalent. Most
diabetic patients die of atherosclerosis and its complications.
The dyslipidemia present in diabetic patients is responsible for the
elevated cardiovascular risk. The coronary artery disease is responsible for
three fourths of all deaths in diabetic patients.17
There is endothelial and smooth muscle function impairment in
diabetic patients. They also have increased adhesion of leukocytes to the
Patients with diabetes mellitus have two to eight fold higher rates of
future cardiovascular events as compared with age and ethnically
matched non-diabetic individuals.
In a study by Barbash GI et al. few young patients with MI had history
of hypertension and diabetes mellitus.18
In a Nurse’s health study, women who eventually developed type 2 DM,
the relative risk of MI was increased 3 fold before the diagnosis of diabetes.19
In a study by Al khadra 30.8% of young patients with MI had
diabetes mellitus.16
Gender
Men have increased risk of atherosclerosis than women. It is the most
important predisposing factor for coronary atherogenesis. The female sex
have protection from coronary atherogenesis. This effect is due to the
The Framingham study found a greater than two fold age adjusted
increase in risk for CAD among post menopausal females compared with
premenopausal females. Data from the Framingham cohort also indicate that
there are sex specific differences in the manifestations of CAD.21
Male : Female ratio was 20:1, in study of profile of acute MI in young
patients by Siwatch SB et al. 10
Physical activity and Obesity
Regular physical activity is associated with cardio protective effect. It
increases exercise capacity. It also reduces the oxygen demand of cardiac
muscles. Hence it lowers the coronary risk. Cardioprotective effects of
exercise include adiposity, diabetes incidence, lowered blood pressure,
improved coronary endothelial function, lower CRP levels, and appears
to benefit hemostatic variables including tissue plasminogen activator,
fibrinogen, VWF, fibrin D dimer and plasma viscosity. 26
A consistent series of prospective studies have demonstrated an
association between levels of physical activity and reduced rates of
In a prospective Harward study, those men with highest levels of
activity at baseline had a 40% reduction in non-fatal cardiovascular events and
24% reduction in cardiovascular mortality compared with those with sedentary
lifestyle.22
In the women health iniative, walking briskly for 30 mins,
5days/week associated with 30 % reduction in vascular events over a period of
3.5 years follow up.23
The American Heart Association has recommended an exercise
energy expenditure approaching 2000 calories each week, a level of exercise
that can be achieved with modest daily exertion.24
Recent studies indicate that waist / hip ratio, a surrogate marker for
centripetal obesity is associated with coronary risk. This ratio holds good as a
independent factor in both sex. 25
Novel atherosclerotic risk factors 26
Several newer risk markers of atherothrombotic risk are
identified. They are proved by epidemiological studies. They are useful
clinically. They are fibrinogen, lipoprotein (a), plasminogen activation
C reactive protein
CRP is a acute phase reactant. CRP is a member of the pentraxin
family. It plays important role in the human innate response. Apart from
this effect , it directly affects vascular vulnerability. Levels of CRP greater
than 3 mg/L also appears to predict recurrent coronary events.
Lipoprotein(a)
It was first described in detail by Berg et al. Its clinical
importance was described by Mclean et al. They have structural similarity
with apoprotien (a) and plasminogen.
It has LDL particle with apo B-100. This component is linked by
a disulphide bridge to apoprotien (a).
Apoprotien (a) is member of a family of ‘KRINGLE’ containing
proteins. Other members of this family include proteins such as Plasminogen,
Prothrombin, Factor XII, urokinase type Plasminogen activator and
Lipoprotein(a) acts by binding on the endothelium. It competes
with plasminogen. It binds to plasminogen receptor on endothelium. Thus it
reduces the activity of plasminogen. Many epidemiological studies proves
positive relation between lipoprotein(a) and atherogenic risk.
Their plasma concentration is inversely proportional to the size of
apoprotein isoform. Thus small isoforms are associated with higher plasma
Lp(a) concentration.
At birth Lp (a) levels are low and adult levels achieved in two years.
Levels are high in asian and African population. Levels above 30 mg/dl are
significant.
Serum Lp(a) levels elevated in type 2 DM, renal failure, menopause ,
hypothyroidism and malignancy. Height, weight, BMI, diet, weight loss and
HOMOCYSTEINE
Homocysteine was first described by botz and du vizwand in 1932,
however a link to human disease was not suggested until 1962.
Structure of Homocysteine
The person who first described pre mature atherosclerosis in children
and young individuals is Dr. McCully .In 1960s he demonstrated that
atherosclerosis is present in children with disorders of homocysteine
metabolism.
Dr. McCully demonstrated that atherosclerosis could be due to high
homocysteine levels. He postulated the same cause for atherosclerosis in
adults also. He hypothesized that elevated homocysteine levels is the cause
Homocysteine is a Intermediate derivative in the metabolism of
methionine. This amino acid contains thiol containing group. Less than 1%
circulates as free form (reduced state). Nearly 75% is bound to serum
albumin. Around 25 % combines with other thiol containing amino acids or
with itself to form dimer compounds. 28
Homocysteine (reduced) 1%
Protein bound homocysteine mixed disulphide (oxidised) 70-80%
Homocysteine- cysteine mixed disulphide (oxidised) 5-10%
Metabolism of homocysteine
The important 3 processes involved are as follows 28
Demethylation
Transmethylation
Transamination
Demethylation
In Demethylation methionine is converted to homocysteine .
In this process various intermediate metabolites are formed including
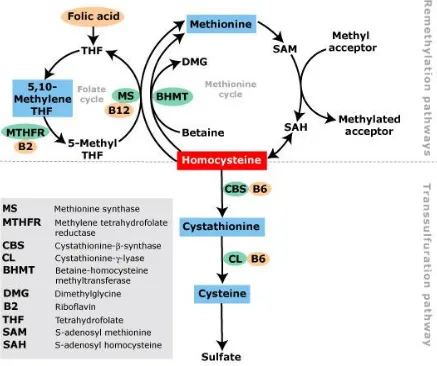
Fig. 1 : Metabolism of Homocysteine
This chart describes the metabolic pathways of Homocysteine in a
nutshell. It describes both remethylation and transsulfuration pathways in our
Transmethylation
In transmethylation pathway homocysteine is again converted to
methionine. Homocysteine is again remethylated to methionine in liver , by
enzyme betaine-homocysteine methyl transferase. This step is catalysed by
methionine synthase . Vitamin B12 is used as a co-factor. Methyl
tetrahydrofolate acts as a substrate.
Transsulfuration
It is the process by which homocysteine is converted to cysteine. This
reaction is irreversible process. In this pathway cystathionine β synthase
which is vitamin B6 dependent acts as catalyst. By this process cystathionine
is formed as intermediate. Finally cystathionine is hydrolysed and it produces
cysteine.
Measurement and Classification of Homocysteine Levels
The normal plasma homocysteine is 5-15 μmoles/L. Plasma
homocysteine level greater than 15 μmoles/L is considered as
The American Heart Association have defined hyperhomocysteinemia
as being divided into29
Moderate : 15-30 μmoles/L
Intermediate : 30 - 100 μmoles/L
Severe : >100 μmoles/L
Various methods of estimation of plasma homocysteine 30
1 High liquid chromatography
2 ELISA
3 Mass spectrometry
4 Fluorescence polaraization immunoassay
Types of hyperhomocysteinemia
They are broadly divided into 2 types of hyperhomocysteinemia.31
1. Primary &
2. Secondary
1. Primary hyperhomocysteinemia
Due to defect in homocysteine metabolism pathways like:
a. Deficiency of Cystathionine beta synthase (CBS) :
It is the commonest cause of hyperhomocystinemia . It is transmitted as
The important clinical features are skeletal deformities, premature
atherosclerosis , mental retardation and dislocation of lens . About one
percent of the general population have cystathionine beta synthase
deficiency, in heterozygous state. They have homocysteine levels elevated in
the range of 20-40 micromol/L.
b. Deficiency of MTHFR (5,10 methylene tetrahydrofolate reductase )
The gene for enzyme MTHFR is mutated. It results in
hyperhomocysteinemia associated with low folic acid.
c. Deficiency of Methylene tetrahydrofolate homocysteine methyl
transferase 31
2. Secondary hyperhomocysteinemia
a. Physiological
Elderly age group
Men
Post menopausal
b. Modifiable factors
use of Tobacco
c. Vitamin deficiency -
Folate
Vit B6 (pyridoxine),
Vit B12 (cobalamine)
d. Systemic disorders
(i) Psoriasis
(ii) Anorexia nervosa
(iii) Systemic lupus erythematosus
(iv) Pernicious anaemia
(v) Hypothyroidism
(vi) Renal failure
(vii) Liver failure
(viii) Organ transplantation
e. Drugs (toxins)
1) Cholestyramine ,Colestipol ,Metformin (affect folate and cobalamin
absorption)
2) Folate antagonists
- Phenytoin
3) Vit B6 antagonists (Theophylline, Oestrogen containing OCP ,Niacin)
4) L-dopa (increases transmethylation)
5) Androgens
6) Cyclosporins ,Fibric acid derivatives (reduces renal function)
7) Nitrous oxide (inactivates methionine synthesis)
Determinants of plasma total homocysteine32
Fasting plasma homocysteine
Sex Male 10.3
Female 8.8
Age (years)
< 45 8.8 45-54 9.2 54-64 9.8 > 65 10.4
Serum creatinine (mol/L)
< 79 8.7 79-87 9.3 87-96 9.3 96-106 9.7 > 106 10.5
Alcohol intake (g/d)
0.1-4.9 9.3 5-14.9 9.4 > 15 10.0
Caffeine intake (mg/d)
< 88 8.9 > 420 9.9
Current cigarette smoking
0 9.3
1-15 9.9 16-25 10.1
≥ 26 11.0
Body mass index (kg/m2)
Dietary intake of folate in a dose of 0.5 to 5 mg reduces
homocysteine levels by 24 %. Vitamin B12 in addition reduces to about 7%.
Renal failure raises plasma homocysteine due to reduced renal
clearance .
Coffee intake and smoking showed positive association with
homocystiene. Moderate alcohol lowers while chronic alcoholics
have increased plasma homocysteine.
Effects of Homocysteine on vascular endothelium 28
It produces damage to vascular endothelial surface & accelerates
atherosclerosis. It is also associated with thrombo embolism. It affects
smooth muscle cells, coagulation factors, connective tissues , plasma
lipoproteins and platelets. It also affects production of nitric oxide.
It stimulates the proliferation of vascular smooth muscule . It
increases DNA synthesis and cyclin A. It causes platelet aggregation and
increases platelet adhesion. The inhibition of Na+ - K+ - ATPase activity by
Hyperhomocysteinemia favours atherosclerosis 34
Endotheial cell dysfunction is prerequisite for development of
atherosclerosis. Homocysteine is toxic to endothelial cell surface by
generating oxygen free radicals. Sulfydryl group reacts to ferric or cupric
ions and gets oxidized to synthesis hydrogen peroxide. This reaction also
produces oxygen free radicals and homocysteine radicals.
Homocysteine gets auto-oxidized to form Homocysteine mixed
sulphides and homocysteine thiosulphates. There by it liberates hydrogen
peroxide and superoxide anion. Hydrogen peroxide implicated in vascular
injury of hyperhomocysteinemia.
The oxidation of LDL by Homocysteine causes vascular injury .
Homocysteine thiolactone a byproduct oxidises native LDL. This step
produces oxidised LDL which when taken up by intimal macrophages of
vascular endothelium forms foam cells. This step initiates the early stage of
atheromatous plaque formation. Homocysteine reduces synthesis of
endothelial derived relaxing factor (NO). NO is a potent antiplatelet
Hyperhomocysteinemia may interfere with antithrombotic and
fibrinolytic mechanisms of the endothelium, making it prothrombotic.
Homocysteine causes collagen deposition in atheromatous plaques . It also
increases of proliferation of vascular smooth muscle cells .
Homocysteine decrease the activity of antioxidant enzymes. This
effect is responsible for proliferation of smooth muscles of vascular
endothelium by increasing their mitotic activity.
Complications of hyperhomocysteinemia31
Hypertension
Cerebrovascular accidents
Ischemic heart disease
Peripheral vascular disease
Venous thromboembolism
Stroke and peripheral vascular disease
Their concentration is elevated in patients with CVA (stroke) and
As regards cerebrovascular disease, eleven clinical studies looked at
causal relationship between homocysteine levels and cerebrovascular
disease. In nine studies, they have significant relationship while two
prospective studies lacked evidence for an association.
Hyperhomocysteinemia and venous thrombosis
Hyperhomocysteinemia can be considered as a factor which favours
venous thromboembolism.
Martin Den Haijer et al.36 studied the plasma homocysteine
concentration of patients with venous thrombosis. It was found to be
elevated. The combination of hyperhomocysteinemia and factor V further
increases the likelihood of venous thromboembolism .
Homocysteine and diabetes mellitus
Type 2 diabetes mellitus patients who had macrovascular disease had
elevated homocysteine levels. It was shown that hyperhomocysteinemia
appears to be a greater risk factor for cardiovascular disease in them, than
Homocysteine and hypertension
Bortolotto LA et al, demonstrated that hypertensive patients with
elevated levels of homocysteine associates positively with arterial stiffness.38
Homocysteine and renal disease
Kidneys play an important role in homocysteine metabolism. Patients
with renal failure have delayed clearance of homocysteine. This effect
increases risk of atherosclerosis.
Homocysteine and ischaemic heart disease
As regards CAD, 17 studies were evaluated, out of which in 14
studies, homocysteine was found to be a significant risk factor. The CAD risk
was around ten percent attributed to be due to elevated homocysteine. It was
studied that reduction of homocysteine levels by 3 μmol/L results in 30%
reduction of risk of ischaemic heart disease.39
Study done by Boushey et al. shows that increase in homocysteine
levels is associated with an increased risk of peripheral arterial disease,
Studies by Arnesan et al illustrate that Homocysteine levels in study
population was elevated than that of age and sex matched controls. This
shows that ,it is an independent risk factor 41
Nygard et al studied 587 angiographically documented cases. He
showed that there is positive relation between between their elevated levels
and mortality. 42
In Asian Indians, Chacko did his studies with CAD and plasma
homocysteine. He stated that plasma homocysteine could not be statistically
proven in Asian populations. 43
Chambers et al. studied UK Indian Asians with CAD and compared
them with Europeans having CAD. They studied 764 male patients (257
Indian Asian and 507 European). Their results revealed that plasma
homocysteine concentrations were higher in Indian Asians compared with
Europeans. 44
Ford et al, analyzed the prospective trails and concluded that there was
20% increase in cardiovascular risk for every 5 μmol/L increase in
Enas A Enas et al found that women with homocysteine levels
elevated above 16 μmol/L have double the risk of acute coronary event .46
Stampher et al, studied about coronary atherogenesis in doctors. His
results are such that a rise in homocysteine concentrations ten to twelve
percent is positively associated with three times the risk of acute coronary
event. 47
Homocysteine and aute coronary event in young adults
Myocardial infarction is claiming a large number of lives in young
patients. Various studies have shown that homocysteine may be significant
marker of risk in young patients lacking conventional risk factors .
In a study by ogawa et al, he discussed the role of homocysteine in
myocardial infarction (young adults) and concluded that increased
concentration of plasma homocysteine is absolutely a risk marker for
myocardial infarction. 48
Dr. Khare A. studied the role of homocysteine in patients with acute
myocardial infarction less than 40 years age. He concluded that elevated
VK Katyal et al., studied 100 young patients(less than 40 years)
admitted with acute MI and found hyperhomocysteinemia to be a significant
contributor towards premature CAD.50
Study conducted by Puri A et al. showed that CAD is associated with
homocysteine. He postulated that it can be taken as a important risk factor
among young CAD patients.51
Stephen M Schwartz et al studied 79 women of age < 45 years
diagnosed with MI and concluded that elevated plasma homocysteine and low
plasma folate are risk factors for MI among young women.52
TREATMENT
The effective way of reducing homocysteine concentration in
plasma is to treat with folates, vitamin B6 and B12. A strong negative
correlation between folic acid levels and their homocysteine levels has been
Guidelines of the American heart association advocate the
principle of screen and treat, i.e., screening for hyperhomocysteinemia is
recommended only in high risk population (personal or family history of
premature atherosclerosis, myocardial infarction, hypertension, diabetes).
It is recommended to keep the homocysteine levels to <10μmol/L in the
high risk group. Those with hyperhomocysteinemia should be treated
with dietary modification followed by vitamin supplementation or
fortification of food with vitamins (400 μgm of folic acid, 2mg of vitamin
B6 and 6μgm of vitamin B12). 53
In the vitamin intervention for prevention of stroke trial, the benefit of
high dose vitamin therapy over vascular events was not established. The
effect on stroke, CHD events, and death could not be proved. 54
Results have shown that folic acid supplementation reduced
plasma homocysteine by 41%, whereas Vit B12 supplement lowered
homocysteine level by 14.8% and both were significant. But vit B6 therapy
The combination of three vitamins reduced plasma homocysteine by
49.8%. 55
FIBRINOGEN
It is a part of coagulation cascade. It regulates blood flow and viscosity.
Now studies shows that elevated plasma concentration of fibrinogen is
associated with vascular events like CVA , thrombo embolic phenomenon and
coronary artery disease.
Nevertheless, the role of fibrinogen in causing, atherosclerosis is
complicated. The atheroma formation is similar in process to thrombogenesis.
This step involves various other thrombogenic factors also. The major
contributor is fibrinogen. Thus it has detrimental effects on vascular
[image:44.612.195.428.514.666.2]endothelium.
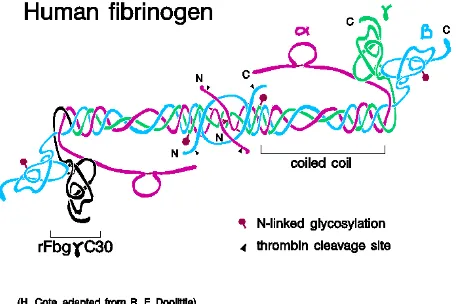
STRUCTURE OF FIBRINOGEN MOLECULE
The fibrinogen is a glycoprotein. Molecular weight around 340 kDa.
Normal plasma concentration is 200 to 400n mg / dL. It is a precursor to
fibrin. Length is 45 nm . Diameter 9 nm. It consists of three pairs of
polypeptide chains . They are namely alpha, beta & gamma chains. They are
held together by disulphide bonds.
The central nodule or E-domain is 5 nm in diameter and contains
the NH2-terminal of all six polypeptide chains forming the NH2-terminal
disulfide knot. The two outer D-domain nodules are composed of the
C-terminal two thirds of both the Bβ and γ chains. Between the E- and
D-domains, there is a stretch of approximately 120 amino acids from each
of the three chains that forms an α-helical structure known as the coiled-coil
domain. This region of the molecule is supported on both sides by a set of
disulfide bonds called disulfide rings. These rings play an important role in
making fibrin mechanically strong and resistant to proteolysis. Structural
elements in each of the individual chains are needed for blood
The Aα chain is a 610-amino acid polypeptide that can be divided into
three distinct domains. The first section of the Aα chain (residues 1-194)
contains a region (residues 45-161) linked to the Bβ and γ chains by disulfide
bonds. This section forms part of the α-helix or coiled coil domain.
This first section also contains fibrinopeptide A (residues 1-16) and the
polymerization site in the E domain.
The Bβ chain is a polypeptide composed of 461 amino acids and is
also divided into three sections. The first 80 residues contain the
fibrinopeptide sequence (residues 1-15) and a site that supports
endothelial cell spreading and proliferation (residues 15-42). The middle
section (residues 81-192) is linked to the Aα and γ chains through disulfide
rings and forms part of the coiled-coil domain.
The γ chain is only 411 amino acids long and is also divided into three
distinct sections. Unlike the Aα and Bβ chains, there is no fibrinopeptide at the
The first 18 amino acids of the γ chain form part of the NH2-terminal
disulfide knot, the middle segment of this polypeptide consists of amino
acids 19-135. This section contains the disulfide rings that link this region to
the Aα and Bβ chains in the coiled-coil domain.
There are 2 distinct forms of γ chains in human plasma
fibrinogen. Approximately 15% of the γ chain contains an extended C
-terminal and are designated γ’ chains. Although Fibrin polymerization and
cross linking of γ’ proceed normally, the γ’ chain does not support platelet
aggregation. The clinical significance of the γ’ chain remains unknown,
however, recent studies suggest that γ’ is a carrier for the zymogen of factor
XIII in circulating blood.
Synthesis57
Plasma fibrinogen is synthesized in the liver by the hepatocytes. It is
released into circulation with half life of nearly 100 hrs. it is degraded at rate
Function56, 57
It is the clotting factor I, according to the system for naming blood
clotting factors. It plays vital role in coagulation pathway. It produces fibrin on
activation.
Results in fibrin which binds to lipoprotein and LDL and retains lipid
moiety in the plaque. It is also important mediator in inflammation and
atherogenesis. It plays pivotal role in thrombogenesis. The possible
mechanisms include increased blood viscosity and enhanced platelet
aggregation. It also causes atherothrombosis by infiltrating the vessel wall.
Thus they favour thrombus formation.
Role in Inflammation
They interact with WBCs by ‘integrins’.The integrins are surface
receptors coated on the leukocytes.Mac1 and alpha X and beta 2 are the
fibrinogen binding receptors.Mac1 is very specific for fibrinogen.
Fibrinogen also bind with intercellular adhesion molecule-1 (ICAM-1) .
Fibrinogen attaches with Mac1 and also interacts with ICAM-1 to cause
adhesion of monocytes over vascular endothelium. Fibrinogen also
upregulates the expression of ICAM-1 or CD54 over the vascular
endothelium.
Fibrinogen favours chemotaxis. Thus it is important in inflammation.
This effect is mediated by binding with integrins receptors of leukocytes. As a
consequence of this activation,the neutrophil activation markers are expressed.
There is also increase in calcium concentration intracellularly.
Fibrinogen favours cell to cell adhesion and also facilitate cell to
collagen (extracellular matrix). Thus it facilitates the inflammatory response.
Role in Thrombogenesis58
There is a normal balance between coagulation and fibrinolytic
pathways.Thrombosis initiated when the balance fails.
Activation of Factor X to Factor Xa is the final step in coagulation
pathway. This in turn converts prothrombin to thrombin. Thrombin facilitates
conversion of fibrinogen to fibrin monomers. They adhere to each other to
form fibrin clot.
Fibrinogen plays definite role in platelet aggregation . they interact with
Role in Atherogenesis58
Fibrinogen plays pivotal role in causing endothelial damage. The fibrin
formed upon activation of fibrinogen , initially acts over the intimal layer of
the vessel wall and it promotes cellular proliferation.
They favour cell migration and cell adhesion. The fibrin degradation
products are the main stimuli for chemotaxis, extracellular matrix synthesis
and their proliferation. This affects the vascular permeability and their tone.
There is clear evidence for large amount of fibrin deposition in the
atherosclerotic lesions in the human blood vessels. They are present either
over the intact surface of plaque or buried within the fibrous cap.
Estimating fibrinogen levels 58
It is done by two methods .
1. Functional methods
The Functional methods involves determining coagulation time. This is
directly related to plasma fibrinogen concentration.Clauss method is widely
accepted method. This is based on the time necessary for coagulation end
2. Direct method
This method quantifies the plasma concentration directly. They are
based on immunological or gravimetric methods. The disadvantage is that they
do not give information about quality of there function.
The normal plasma concentration varies circulating from 200 – 400
mg/dl. The widely accepted method is Clauss method.
Determinants of fibrinogen59
1. Genetics: There is genetic polymorphism which accounts for 30 to 50
percent variation.
2. Gender : According to Monica ausburgs,women generally have their
fibrinogen levels elevated when compared with age matched men. This is
irrespective of pregnancy. It is also independent of use of oral contraceptive
pills.
3. Smoking : There is clear evidence for elevation of fibrinogen associated
with smoking. There is proportional increase of 350mg/dl with each cigarette
smoked. Smoking causes inflammation of pulmonary alveoli and bronchus.
This inturn increases concentration of IL-6 which promotes synthesis of acute
4. Alcohol : Mild to moderate alcohol intake reduces plasma fibrinogen
levels. According to DESIR study, those who do not take alcohol or heavy
drinkers taking more than 70gms/day have more plasma fibrinogen values..
5.Obesity : They have positive relationship with body mass index, waist hip
ratio and waist circumference in both men and women.
6. Exercise : Regular physical activity reduces the level of fibrinogen. This
effect attributes to the cardiovascular benefits of regular physical exercise.
7. Hormonal Influence : The use of oral contraceptive pills is associated
with elevated fibrinogen levels
8. Age : Fibrinogen has a tendency to increase with age. This is attributed to
the delayed clearance from plasma.
9. Role of Vitamins : Dietary intake of Vitamin C reduces plasma
10. Role of Infections: Certain organisms like Helicobacter pylori and
Chlamydia were implicated in causing coronary artery disease.The role of
fibrinogen may be explained following these infections. Its level is also
increased in periodontal infections.
Factors increasing fibrinogen
Old age, women
African and asian race
Over weight and obesity
Smoking
Post menopausal women
Combined oral contraceptives
Heavy alcohol drinkers
Sedentary life style
Factors reducing fibrinogen
younger age group
Caucasians
Japanese race
Smoking cessation
Low to moderate alcohol intake
Regular physical activity
Role of Fibrinogen in acute coronary event
Many statistical analysis and prospective studies clearly shows that
elevated plasma fibrinogen is associated with acute coronary event. This
suggests the possibility of fibrinogen may be considered as a individual risk
factor.59
In one meta analysis, which included a large number of prospective,
cross sectional and case control studies concluded that the risk is about two
times with elevated fibrinogen levels. Thus higher plasma levels are associated
with increased risk of acute coronary event.60
In Framingham study, the cardiovascular risk is directly related to
their plasma fibrinogen levels. The risk of acute vascular event increases with
levels above 4.5gm/dl 61
In European concerted action on thrombosis and disabilities study,
they concluded that plasma fibrinogen can be taken as an independent risk
factor. They provided it for acute coronary event as well as for sudden death.
The relationship with acute coronary syndrome is much stronger. This is
proved statistically when compared with LDL cholesterol.62
Deepa et al, studied prothrombogenic risk factors in south Indian with
CAD and found that prothrombogenic risk factors particularly fibrinogen may
be associated with CAD.63
Fibrinogen and young MI
Khare A et al. studied fibrinogen levels in 120 patients with MI less
than 40 years of age and concluded that fibrinogen is an independent risk
factor.49
Von Eyben et al. studied fibrinogen levels in 22 patients with MI aged
less than 41 years, came to conclusion that fibrinogen was independent risk
factors.64
Elikowski W et al, studied thrombotic risk factor in 40 young survivors
[aged 30-40 yrs] of myocardial infarction and found high fibrinogen levels
Lewandowski k et al, studied 99 male patients aged less than 40 yrs
with MI and found that the frequency of BcII polymorphism of the
beta-fibrinogen gene was significantly higher in MI patients along with higher
plasma concentration of fibrinogen.66
Interventions to reduce its level
Several drugs lower plasma fibrinogen concentrations, including some
beta adrenergic blocking agents, platelet inhibitors, and fibric acid derivatives,
but lifestyle modifications such as exercise and modest alcohol intake may be
the most satisfactory initial treatment of choice.67
Intervention to decrease plasma fibrinogen 59
The most successful in reducing plasma fibrinogen levels includes drugs
like fibrates, plasmapheresis, alcohol intake and most importantly by stopping
smoking.
The other steps which yield doubtful benefits include hormone
replacement in post menopausal women, weight reduction, lowering
hypertension etc., Statins are not useful.
According to Bezafibrate Coronary Atherosclerosis Intervention Trial
MATERIALS AND METHODS
SOURCE OF DATA
Cases for the present study were selected from the inpatients of
ICCU ward, IMCU ward in Thanjavur medical college Hospital, Thanjavur
between Oct 2011 to Nov 2012.
METHOD OF COLLECTION OF DATA
Sample size: 70 cases
Present study involved 70 patient admitted to Thanjavur medical
college Hospital with diagnosis of acute myocardial infarction. A detailed
history and thorough clinical examination was done as per the proforma and
were investigated further.
Inclusion Criteria
1. Patients fulfilling WHO criteria for acute myocardial infarction .
2. At least two of the three elements presenting within 48 hours
a. History of ischemic chest discomfort
b. Typical ECG changes
Exclusion Criteria
1. Patients with renal dysfunction/ Liver disease
2. Patients with thyroid disease.
The following parameters were studied
Smoking : Proper history of smoking obtained in terms of pack years &
smoking index
Diabetes mellitus
1. Known diabetics and their duration of disease.
2. Newly detected DM satisfying WHO criteria
a. Symptoms of diabetes mellitus with random blood glucose >200 mg%
b. Fasting plasma glucose > 126 mg%,
c. 2 hr plasma glucose > 200 mg%
Hypertension
1. Known hypertensives on treatment and their duration of disease
Family history of Ischemic heart disease
Obesity : Patients were classified accordingly as overweight and obese based
on body mass index. BMI = Weight (kg)/height (mt2)
Obesity - BMI > 30
Over weight - BMI 25 to 30
Dyslipidemia
According to NCEP-ATP III guidelines, patients were considered
to have dyslipidemia when
1. Total cholesterol > 200 mg%,
2. HDL < 40 mg%,
3. LDL > 100 mg%
4. Triglycerides > 150 mg%.
Plasma fibrinogen level : The levels were measured quantitatively by
Coagulation method done by SYSMEX 500 series. Serum fibrinogen values
Other investigations
ECG
RBS,
Blood urea
Serum creatinine
Cardiac enzymes – CKMB
Method of Statistical Analysis
The data were analysed by calculating percentages, mean values,
standard deviation and standard error using one-sample T test, independent
samples, chi-square T test and ANOVA – one way test.
All statistical calculations were performed using the software SPSS
RESULTS
In this study 70 patients with evidence of acute myocardial infarction
were evaluated. Novel risk factor fibrinogen studied in comparison with other
[image:61.612.145.473.290.459.2]conventional risk factors.
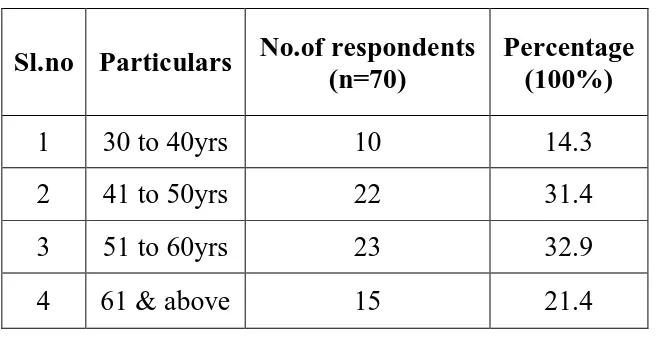
Table – 1 : Age wise Distribution of the cases
Sl.no Particulars No.of respondents (n=70)
Percentage (100%)
1 30 to 40yrs 10 14.3
2 41 to 50yrs 22 31.4
3 51 to 60yrs 23 32.9
4 61 & above 15 21.4
In this study most of the cases were between the age group of 51 to 60
years. Youngest patient in this study was 30 year old.
Chart 1 : Age wise distribution of the cases
0 5 10 15 20 25
30 to 40 yrs 41-50 yrs 51-60 yrs 61 & above
Age
This graph shows age wise distribution of cases . Most of cases
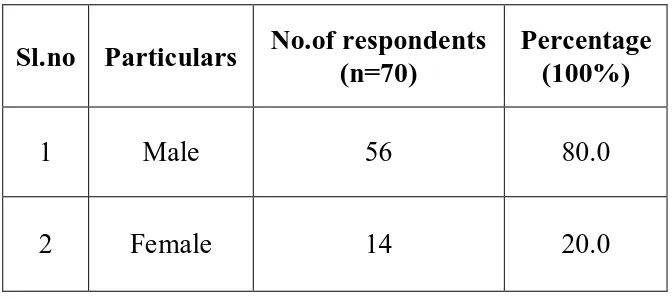
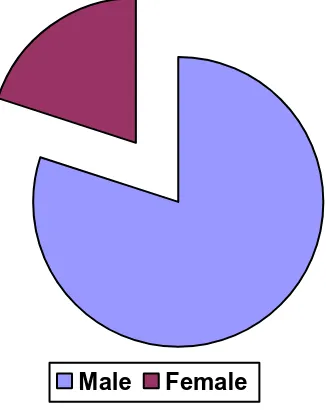
Table – 2 : Sex wise Distribution of the cases
Sl.no Particulars No.of respondents (n=70)
Percentage (100%)
1 Male 56 80.0
2 Female 14 20.0
This was a male dominated study with males comprising 80% of the
Chart 2 : Sex wise Distribution of the cases
Male Female
This pie chart illustrates the sex wise distribution of cases. In our study
[image:64.612.228.391.139.344.2]males contribute to around 80% of cases.
Table - 3 : Difference between gender of the respondents and their P.fibrinogen
T Test
Sl.no P.fibrinogen (mg%) Mean S.D Statistical inference
1 Male (n=56) 439.54 72.104
2
Female (n=14) 444.93 90.308
T=-.238
.813>0.05 Not Significant
Df=68
Statistical test: Student ‘t’ test was used the above table
In our study the mean plasma fibrinogen of females is higher than
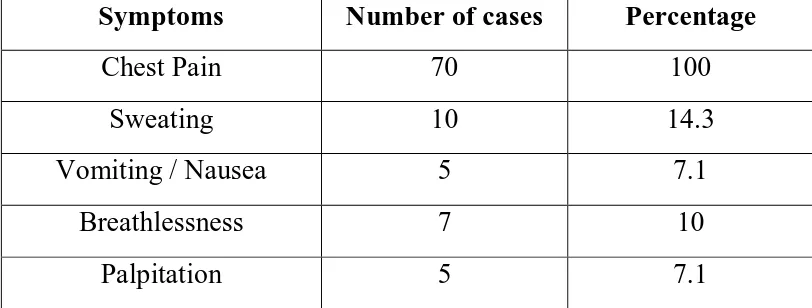
Table – 4 : Symptoms at the time of admission
Symptoms Number of cases Percentage
Chest Pain 70 100
Sweating 10 14.3
Vomiting / Nausea 5 7.1
Breathlessness 7 10
Palpitation 5 7.1
Chest pain was the most common symptom which was present in all
Chart 3 : Symptoms at the time of admission
0 10 20 30 40 50 60 70
Symptoms
Chest pain Sweating Vomiting Breathlessness Palpitation
This bar diagram shows symptom wise distribution of cases. In our study
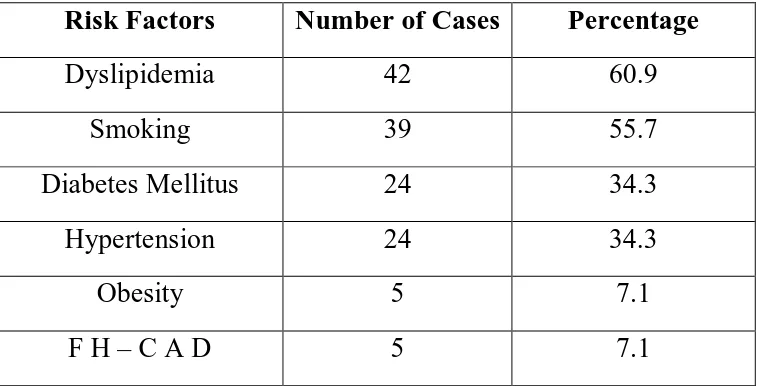
Table –5 : Comparison of risk factors among patients
Risk Factors Number of Cases Percentage
Dyslipidemia 42 60.9
Smoking 39 55.7
Diabetes Mellitus 24 34.3
Hypertension 24 34.3
Obesity 5 7.1
F H – C A D 5 7.1
In this study dyslipidemia (60.9%) was the most common risk factor
followed by smoking (55.7%). Diabetes mellitus and hypertension were
observed in 24 number of patients. Overweight was present among 50 % of
patients and only 5 (7.1%) patient was obese. 34.3% of the study group were
Chart 4 : Comparison of risk factors among patients
0 5 10 15 20 25 30 35 40 45
Sm okin
g
Dia bete
s m elitu
s
Hyp erte
nsio n
Dys lipid
em ia
Obe sity
FH-C AD
Risk factors
This bar chart shows the risk factor wise distribution of cases. In our study
dyslipidemia is the most common risk factor ( 60 .9 %) , followed by
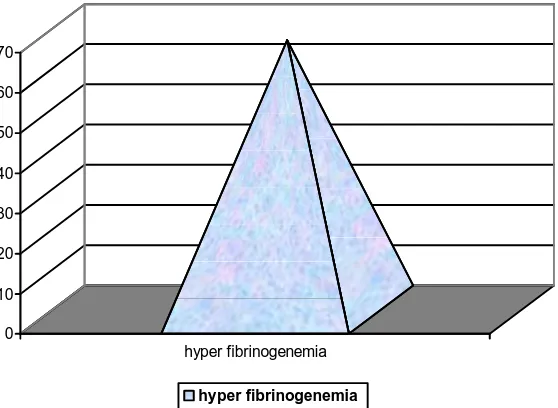
Table –6 : Percentage of cases with hyperfibrinogenemia
Risk factors Number of Cases Percentage
Fibrinogen 47 67.1
In this study significant number of patients (67.1%) had hyperfibrinogenemia.
Chart 5 : Percentage of cases with hyper fibrinogenemia
0 10 20 30 40 50 60 70
hyper fibrinogenemia
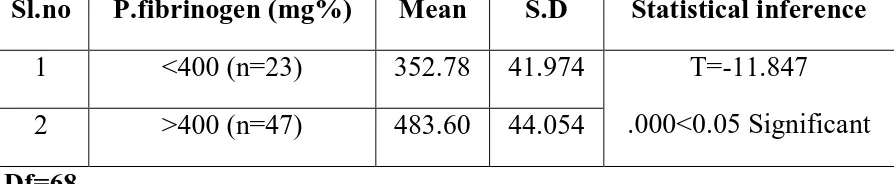
Table –7 : Study of plasma fibrinogen levels in our patients
T-Test
Study of level of P.fibrinogen of the respondents
Sl.no P.fibrinogen (mg%) Mean S.D Statistical inference
1 <400 (n=23) 352.78 41.974
2 >400 (n=47) 483.60 44.054
T=-11.847
.000<0.05 Significant
Df=68
Statistical test: Student ‘t’ test was used the above table
Risk factors Mean Values P value
Fibrinogen (Normal 180-400 mg/dl) 440.61± 75.4 mg/dl 0.000<0.05
In this study mean plasma fibrinogen level was (440.61± 75.4
mg/dl), which was high compared to the normal fibrinogen levels and was
Chart 6: Mean plasma fibrinogen in our study
0 50 100 150 200 250 300 350 400 450
Fibrinogen
Fibrinogen
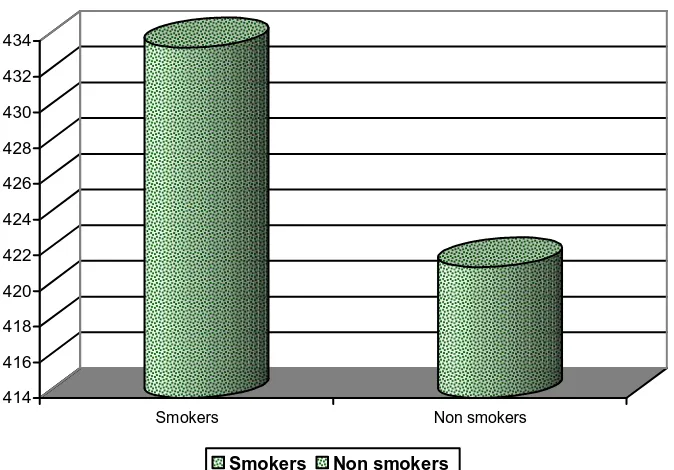
Table – 8 : Comparison of mean plasma fibrinogen levels among smokers and non-smokers
Smokers Non – smokers P value
Fibrinogen (mg/dl) 433.64± 72.08 421.3± 71.02 0.035<0.05
Mean fibrinogen level (433.64mg/dl) was high among smokers when
compared to non-smokers (421.3mg/dl), and was statistically significant
Chart 7 : Comparison of mean plasma fibrinogen level among smokers and non smokers.
414 416 418 420 422 424 426 428 430 432 434
Smokers Non smokers
Table – 9 : Comparison of mean plasma fibrinogen levels among diabetics and non diabetics
Diabetics Non – Diabetics P value
Fibrinogen (mg/dL) 463.33 ± 77.31 428.76± 72.4 0.046<0.05
Diabetics had higher values of fibrinogen (463 mg%) when compared
to non-diabetics (428 mg%) , which was statistically significant. ( p value
0.046 < 0.05 ) .
Chart 8 : Comparison of mean plasma fibrinogen levels among diabetics and non diabetics
410 420 430 440 450 460 470
Diabetic Non Diabetic
Table-10 : Comparison of mean plasma fibrinogen among hypertensives and non hypertensives
Sl.no
P.fibrinogen (mg%)
Mean S.D Statistical inference
1 Hypertensive (n=24) 452.13 78.751
2 Non hypertensive
(n=46) 434.61 73.759
T=.922
.360>0.05 Not Significant
Df=68
Statistical test: Student ‘t’ test was used the above table
The mean plasma fibrinogen in hypertensives ( 452.13 mg/dl ) was high
when compared with non hypertensives ( 434.61 mg/dl ), but this difference is
not statistically significant.
Chart 9: Mean plasma fibrinogen among hypertensives and non hypertensives
425 430 435 440 445 450 455
Hypertensives Non hypertensives
Table 11: Comparison of mean plasma fibrinogen of alcoholics and non
alcoholics
Oneway ANOVA difference between alcohol of the respondents and their P.fibrinogen
Sl.no P.fibrinogen
(mg%) Mean S.D SS
D
f MS
Statistical inference
1 Between
Groups 11616.973 2 5808.486
2 Nil (n=46) 446.85 75.4 19
3 CR (n=13) 443.69 56.6 96
4 OCC (n=11) 410.91 92.8 15
5 Within
Groups 380677.613
6
7 5681.755
F=1.022
.365>0.05
Not Significant
Statistical test: Oneway ANOVA ‘f’ test was used the above table
The mean plasma fibrinogen of chronic alcoholics is higher than occasional
[image:75.612.73.540.206.501.2]Table – 12 : Comparison of mean plasma fibrinogen levels among patients with high LDL level and patients with normal LDL
Sl.no Particulars (LDL mg %)
No.of respondents
(n=70)
Percentage (100%)
1 Below 100 28 40.0
2 100 to 129 26 37.1
3 130 to 159 11 15.7
4 160 & above 5 7.1
Sl.no
P.fibrinogen
(mg%)
Mean S.D SS Df MS
Statistical
inference
1 Between Groups 7622.973 3 2540.991
2 Below 100 (n=28) 428.86 79.774
3 100 to 129 (n=26) 449.15 73.408
4 130 to 159 (n=11) 453.00 69.146
5 160 & above (n=5) 454.80 67.059
6 Within Groups 384671.613 66 5828.358
F=4.436
.031<0.05
Significant
Subjects with high LDL ( > 100 mg %) had their Plasma fibrinogen
Concentration ( 445. 65 mg % ) higher than persons with normal LDL
[image:76.612.64.559.135.653.2]Chart 10 : Comparison of mean plasma fibrinogen levels among patients
with dyslipidemia and patients with normal lipids
415 420 425 430 435 440 445 450 455 460
below 100 100 to 129 130 to 159 160 and above
Table 13 : Comparison of HDL level and mean plasma fibrinogen
T-Test
Difference between level of HDL of the respondents and their P.fibrinogen
Sl.no P.fibrinogen (mg%) Mean S.D Statistical inference
1 Less than 40 (n=15) 456.20 82.755
2
More than 40 (n=55) 436.36 73.507
T=.902
.601>0.05 Not Significant
Df=68
Statistical test: Student ‘t’ test was used the above table
In our study subjects with HDL level above 40 mg/dl ,their plasma
Table – 14 : Comparison of mean fibrinogen levels among patients with
obesity and patients with normal BMI
Sl.no Particulars
No.of respondents
(n=70)
Percentage
(100%)
1 20 to 25 30 42.9
2 25 to 30 35 50.0
3 30 & above 5 7.1
Sl.no P.fibrinogen
(mg%) Mean S.D SS Df MS
Statistical inference
1 Between Groups 29428.819 2 14714.410
2 20 to 25 (n=30) 438.23 73.520
3 25 to 30 (n=35) 432.20 77.393
4 30 & above (n=5) 513.80 24.823
5 Within Groups 362865.767 67 5415.907
F=4.717
.043<0.05
Significant
The mean plasma fibrinogen in BMI < 25 is 438.23 mg/ dl . The
mean plasma fibrinogen in BMI between 25 to 30 is 432.20 mg /dl. In obese
group plasma fibrinogen is around 513.80 mg/dl. The difference is
[image:79.612.60.559.155.567.2]Chart 11 : Comparison of mean fibrinogen levels among patients with
obesity and over weight and patients with normal BMI
380 400 420 440 460 480 500 520
20 to 25 25 to 30 30 & above Fibrinogen
This chart describes the correlation between BMI and the plasma
DISCUSSION
70 patients of with evidence of acute MI admitted to ICCU and
[image:81.612.121.523.244.591.2]IMCU were studied and the following data were compared.
Table - 15 : Comparison of sex wise distribution of the cases
Study Males % Females %
SK mishra et al69 90 10
Khare A et al49 91.67 8.33
AL Khadra et al16 96.9 3.1
Ranjit N72 86 14
Present Study 80 20
Sl.no Particulars
No.of respondents
(n=70)
Percentage (100%)
1 Male 56 80.0
2 Female 14 20.0
The study was predominantly male (80%) dominated. This may be
attributed to the protective effects of estrogen in pre-menopausal women. This
Table - 16 : Comparison of age wise distribution of the cases
Sl.no Particulars No.of respondents (n=70)
Percentage (100%)
1 30 to 40yrs 10 14.3
2 41 to 50yrs 22 31.4
3 51 to 60yrs 23 32.9
4 61 & above 15 21.4
In our study, mean age of the patients was 52.26 years.
Most of the patients were in the age group between51 to 60 years (32.9%).
Study Age (Mean) in years
Present Study 52.26
Romero M et al50 56.4
Table – 17 : Comparison of symptoms at admission
Symptoms Mishra SK et al.69 Patil CN et al.71 Present Study
Chest Pain 83.4% 93.3% 100%
Sweating 61% 50% 14.3%
Vomiting / Nausea 5% 16.7% 7.1%
Breathlessness 29% 16.7% 10%
Palpitation - 3.3% 7.1%
Stroke 0.8% - -
Syncope 6% - -
In our study chest pain (100%) was the most common symptom
followed by sweating (14.3%). Similar findings were noted in study by