Principal,
KMCH College of Pharmacy, Kovai Estate, Kalapatti Road, Coimbatore - 641 048. (T.N)
C
C
E
E
R
R
T
T
I
I
F
F
I
I
C
C
A
A
T
T
E
E
T
Thhiiss iiss toto cecerrttiiffyy tthhaatt ththee didisssseerrttaattiioonn wwoorrkk enenttiittlleedd “BIOANALYTICAL “ METHOD DEVELOPMENT AND VALIDATION OF PIRFENIDONE BY RP-HPLC METHOD AND ITS APPLICATION TO THE DETERMINATION OF DRUG FOOD INTERACTION STUDY IN WISTER RATS”” susubbmmiitttteedd byby
M
Miissss..DDoonnaa SSaarraaKKuurriiaann ((RReegg nnoo:: 2266110077222233)) iiss aa bboonnaaffiiddee wwoorrkk ccaarrrriieedd oouutt bbyy tthhee c
caannddiiddaattee ununddeerr ththee guguiiddaannccee ooff MMrrss..NN..TTaammiillsseellvvi, M.Pharm., i to ThThee TaTammiillNNaadduu D
Drr.. MM..GG..RR.. MeMeddiiccaall UUnniivveerrssiittyy,, ChCheennnnaaii,, inin paparrttiiaall fufullffiillmmeenntt foforr tthhee DeDeggrreeee ofof M
Maasstteerr ooff PPhhaarrmmaaccyy iinn PPhhaarrmmaacceeuuttiiccaall AAnnaallyyssiiss aatt tthhee DDeeppaarrttmmeenntt ooff PPhhaarrmmaacceeuuttiiccaall A
Annaallyyssiiss,, KMKMCCHH CCoolllleeggee ooff PPhhaarrmmaaccyy,, CCooiimmbbaattoorree,, dduurriinngg tthhee aaccaaddeemmiicc yeyeaarr 22001111- -2
200112.2.
Dept. of Pharmaceutical Analysis, KMCH College of Pharmacy, Kovai Estate, Kalapatti Road, Coimbatore - 641048. (T.N)
C
C
E
E
R
R
T
T
I
I
F
F
I
I
C
C
A
A
T
T
E
E
TThhiiss iiss toto cecerrttiiffyy tthhaatt ththee didisssseerrttaattiioonn wwoorrkk enenttiittlleedd “BIOANALYTICAL “ METHOD DEVELOPMENT AND VALIDATION OF PIRFENIDONE BY RP-HPLC METHOD AND ITS APPLICATION TO THE DETERMINATION OF DRUG FOOD INTERACTION STUDY IN WISTER RATS”” ssuubbmmiitttteedd byby
M
Miissss..DDoonnaa SSaarraa KKuurriiaan nisis a abobonnaaffiiddee woworrkk cacarrrriieedd ououtt byby ththee cacannddiiddaattee ununddeerr mymy g
guuiiddaannccee toto ThThee TaTammiill NaNadduu DrDr.. MM..GG..RR.. MeMeddiiccaall UUnniivveerrssiitty,y, ChCheennnnaaii,, inin paparrttiiaall f
fuullffiillmmeenntt ffoorr ththee DeDeggrreeee ofof MaMasstteerr ooff PhPhaarrmmaaccyy inin PhPhaarrmmaacceeuuttiiccaall AAnnaallyyssiiss atat ththee D
Deeppaarrttmmeenntt ofof PhPhaarrmmaacceeuuttiiccaall AnAnaallyyssiiss,, KMKMCCHH CoColllleeggee ooff PhPhaarrmmaaccyy,, CCooiimmbbaattoorree,, d
duurriinngg tthhee aaccaaddeemmiicc yyeeaarr 22001111--2200112.2.
Date: MMrrss..NN..TTAAMMIILLSSEELLVVII,,MM..PPhhaarrmm..,, A
II dodo hheerreebbyy dedeccllaarree tthhaatt ththee ddiisssseerrttaattiioonn woworrkk enenttiittlleedd “BIOANALYTICAL “ METHOD DEVELOPMENT AND VALIDATION OF PIRFENIDONE BY RP-HPLC METHOD AND ITS APPLICATION TO THE DETERMINATION OF DRUG FOOD INTERACTION STUDY IN WISTER RATS” ” susubbmmiitttteedd toto T
Thhee TTaammiillNNaadduu DDrr.. MM..GG..RR.. MMeeddiiccaall UUnniivveerrssiittyy,, CChheennnnaaii,, iinn ppaarrttiiaall ffuullffiillllmmeenntt ffoorr tthhee D
Deeggrreeee ooff MMaasstteerr ooff PPhhaarrmmaaccyy iinn PPhhaarrmmaacceeuuttiiccaall AAnnaallyyssiiss,, wwaass ddoonnee bbyy mmee uunnddeerr tthhee g
guuiiddaannccee ofof MMrrss.. NN.. TTaammiillsseellvvii,, MM..PPhhaarrmm..,, atat tthhee DeDeppaarrttmmeenntt ooff PhPhaarrmmaacceeuuttiiccaall A
Annaallyyssiiss,, KMKMCCHH CoColllleeggee ooff PhPhaarrmmaaccyy,, CCooiimmbbaattoorree,, dudurriinngg tthhee aaccaaddeemmiicc yeyeaarr
2
2001111--2200112.2.
T
Thhiiss iiss toto cecerrttiiffyy tthhaatt ththee didisssseerrttaattiioonn wwoorrkk enenttiittlleedd “BIOANALYTICAL “ METHOD DEVELOPMENT AND VALIDATION OF PIRFENIDONE BY RP-HPLC METHOD AND ITS APPLICATION TO THE DETERMINATION OF DRUG FOOD INTERACTION STUDY IN WISTER RATS” ” SuSubbmmiitttteedd byby
M
Miisss.s. DDoonnaa SSaarraa KKuurriiaann UnUniivveerrssiittyy RReegg.. NNoo:: 2626110077222233 toto TThhee TaTammiill NNaadduu DDrr.. M
M..GG..RR.. MMeeddiiccaall UUnniivveerrssiittyy,, ChCheennnnaaii,, inin paparrttiiaall fufullffiillllmmeenntt ffoorr tthhee DDeeggrreeee ofof MaMasstteerr o
off PPhhaarrmmaaccyy inin PPhhaarrmmaacceeuuttiiccaall AnAnaallyyssiiss isis a a bobonnaaffiiddee wwoorrkk cacarrrriieedd ououtt byby ththee c
caannddiiddaattee aatt tthhee DeDeppaarrttmmeenntt ofof PhPhaarrmmaacceeuuttiiccaall AnAnaallyyssiiss,, KMKMCCHH CoColllleeggee ofof P
Phhaarrmmaaccyy,, CCooiimmbbaattoorree aanndd wwaass eevvaalluuaatteedd bbyy uuss dduurriinngg tthhee aaccaaddeemmiicc yyeeaarr 22001111--2200112.2.
Examination Center: KMCH College of Pharmacy, Coimbatore.
Date:
Internal Examiner External Examiner
This dissertation entitled “BIOANALYTICAL METHOD DEVELOPMENT AND VALIDATION OF PIRFENIDONE BY RPHPLC METHOD AND ITS APPLICATION TO THE DETERMINATION OF DRUG FOOD INTERACTION STUDY IN WISTER RATS” would not have been feasible one without the grace of god who gave me moral till the completion of my project..
First and foremost I am extremely beholden to my esteemed guide, Mrs. N. Tamilselvi, M. Pharm., Department of Pharmaceutical Analysis, for her
constant insight, personal advice, countless serenity and pain taking effort in all stages of study.
With great pleasure I wish to place my indebtedness to our Principal Dr.A.Rajasekaran, M. Pharm., Ph.D., for his support and for giving me an opportunity to do my project work.
I submit my sincere thanks and respectful regard to our beloved Chairman, Dr. Nalla G. Palanisami and Managing Trustee, Dr. Thavamani D. Palanisami for all the facilities that were provided to me at the institution enabling me to do the work of this magnitude.
I also extend my thanks to Mr. J. Dharuman, M.Pharm.,(Ph.D)., HOD, Department of Pharmaceutical Analysis for his timely help and support in the course of the work.
I owe my deep depth of gratitude to our esteemed and beloved staff Mr. G. Ariharasivakumar M.Pharm (Ph.D) Professor, Department of Pharmacology, for his support, timely help and suggestions.
My special thanks to all teaching and nonteaching staff of KMCH College of Pharmacy, who directly or indirectly gave a helping hand to me while carrying out this study.
Above all I dedicate myself before the unfailing presence of God and constant love and encouragement given to me by my beloved Parents and Brother who deserves the credit of success in whatever work I did.
CAN : Acetonitrile
Abs. : Absorbance
AUC : Area under curve
BA : Bioavailability
Conc. : Concentration
CV : Coefficient of variance
0
C : Degree centigrade
e.g. : Example
Fig. : Figure
HPLC : High Performance Liquid Chromatography
i.e. : That is
IS : Internal Standard
M.W. : Molecular weight
MET : Methanol
mg : Milligram
mL : Millilitre
mm : Milli molar
µg : Microgram
pH : Hydrogen ion concentration
% : Percentage
PDA : Photo Diode Array
RF : Response Factor
Rpm : Rotation per minute Rt : Retention time
RSD : Relative standard deviation
T : Time
Tab. : Table
UV : Ultra violet
v/v : Volume by volume
CHAPTER TOPIC PAGE
1. INTRODUCTION 1-23
2. REVIEW OF LITERATURE 24
3. AIM AND OBJECTIVE 25
4. PLAN OF WORK 26-27
5. DRUG PROFILE 28-29
6. METHODOLOGY 30-55
7. RESULT AND DISCUSSION 56-62
8. SUMMARY 63
9. CONCLUSION 64
10. BIBLIOGRAPHY 65-67
ABSTRACT
A simple, precise, accurate, sensitive bioanalytical method has been
developed and validated for pirfenidone by RP-HPLC method and its
application to the determination of drug food interaction study in wister
rats. The separation and quantization of Pirfenidone was achieved on a
Phenomenex C-18 RP column (25 cm x 4.6 mm, 5µm ID) using the mobile
phase in gradient mode constituting of eluant A HPLC grade water
(adjusted to pH 3.5) and eluant B 20% acetonitrile and 15% of methanol in
the ratio of 60: 40(A:B) at a flow rate of 1mL min
-1. Eluted components
were detected at 324 nm. The method showed good linearity for
Pirfenidone in the range of 50–250ng mL
-1, Y=54.97x - 349.5and
correlation coefficient R
2was 0.998 respectively. The limit of quantitation
(LOQ) and limit of detection (LOD) were found to be 12 and 20 ng mL
-1respectively. The developed method shows good accuracy and precision.
For bioanalytical study, parameters like C
max,T
max,AUC
0-t,AUC
0-∞,K
eliand T
1/2were compared by statistical analysis. The statistical analysis
indicated that there is no significant difference in the pharmacokinetic
profile of pirfenidone before and after food. This method was successfully
KMCH College of Pharmacy Page 1
CHAPTER- 1
INTRODUCTION
1-14Pharmaceutical analysis is a specialised branch of chemistry that deals with the identification of compounds and mixtures (qualitative analysis) or the determination of the proportion of the constituents (quantitative analysis). It plays an imperative role in the quality assurance and quality control of the bulk drugs and their formulations. Drug analysis reveals identification, characterization and determination of the drugs in mixtures like dosage forms and biological fluids.
The number of drugs introduced into the market has been rising at very hasty rate. These may be either new drug entities or partial structural modification of the existing drugs.
Newer analytical methods are developed for these drugs because:
The official pharmacopoeia may not disclose an analytical procedure for the drugs or its combination.
Analytical methods may not be available for the drug combination due to interference caused by excipients.
Analytical methods for the quantification of drug or drug combination from biological fluids may not be available.
The recently developed analytical methods have their significance in different fields like
Research and development centre
Quality control department
Approved testing laboratory
Chemical analysis laboratory
KMCH College of Pharmacy Page 2
prescribed standards and quality. It is very essential to assure that the drug will comply with the specific standards throughout the shelf life.
The discovery and development of a new drug costs approximately $1 billion and it may take around 10 years for a drug to reach the market. This is a process of generating compounds and evaluating all their properties to establish the viability of selecting a new chemical entity (NCE) to develop into a safe and efficacious drug. Experimental pharmacokinetics (PK) data from laboratory animals in the nonclinical stage is critical in evaluating a drug candidate prior to the test in the clinical trials, for safety and efficacy evaluation. A key factor in pharmacokinetics is the plasma or tissue concentration of the new drug after its administration to the laboratory animals. Therefore, developing a precise and rapid analytical method for measuring the concentration of a compound in plasma or tissue is the first step to yield the PK of a compound. To minimize the resource expenditures, an appropriate level of bioanalytical support is needed for a drug candidate.
1.1 IMPORTANCE OF BIOANALYTICAL METHODS:
The accurate determination of the concentration of a drug candidate and its resulting metabolites in biological fluids plays an indispensable role in the drug discovery, preclinical and clinical development programs. The drug concentration values determined are used to calculate the pharmacokinetic properties of the candidate drug molecules. In discovery these properties are used to select the most promising candidate compound, from a library or parallel synthesis experiment, to be carried ahead into development.
In development the pharmacokinetic values derived from both Drug Metabolism And Pharmacokinetic Environment( DMPK) and safety assessment studies are used to provide evidence of the dosed compound exposure, evaluate the effect of increased drug dosing on compound exposure and estimate the appropriate dose to be used in the initial human clinical trials. The metabolism of the compound in mammalian species, such as rat, dog and mouse need to be extensively studied and accurately defined in this scenario.
KMCH College of Pharmacy Page 3
New Drug Applications (NDAs), Abbrivated New Drug Applications (ANDAs) and their supplements.
Pharmacokinetics is the quantitative study of drug movement in, through and out of the body. The intensity of the response is related to the concentration of the drug at the site of action, which in turn is dependent on its pharmacokinetic properties.
After oral administration the drug passes through the GIT and enters the systemic circulation undergoes metabolism, ultimately it is excreted as such or in the form of its metabolites. The studies on biological fluids disclose the information relating the quantity of drugs and their metabolites in biological fluids. When concentration of drug in biological matrix is known, then pharmacokinetic parameters are calculated from that.
Bioavailability is defined as the rate and extend to which the active ingredient is absorbed from a drug product and becomes available at the site of action. Bioavailability of active pharmaceutical ingredient should be known and reproducible.
In bio analytical method, the qualitative and quantitative analysis of drug substance and metabolites in biological fluids or tissues are carried out. The assay methods should be precise, accurate and sensitive enough to estimate the drug and metabolite concentration in the biological fluid, for a period of about five elimination half-lives following oral drug administration.
The bioavailability studies should be designed so as to reduce the possible source of variation. The conditions of the study should be standardised as far as possible.
1.2 PHARMACOKINETIC TERMS: Cmax
KMCH College of Pharmacy Page 4
Cmin This is the minimum drug concentration achieved in systemic circulation
following multiple dosing steady state level.
Cpd
This is the predose concentration determined before a dose is given at steady state.
Tmax
This is the time required to achieve the maximum drug concentration in systemic circulation.
AUC0-t
Area under plasma concentration-time curve from 0h to last quantifiable concentration to be calculated using the trapezoidal rule.
AUC0-∞
Area under plasma concentration-time curve from 0h to infinity to be calculates the sum of AUC0-t plus the ratio of the last measurable concentration to the elimination rate constant.
AUC0- Area under plasma concentration-time curve over one dosing interval following single dose for modified dose product.
AUC0 (ss)
Area under plasma concentration-time curve over one dosing interval in multiple dose study at steady state.
Keli
Apparent first order terminal elimination rate constant calculated by a semi log plot of the plasma concentration versus time curve.
T1/2
KMCH College of Pharmacy Page 5
1.3 ANALYSIS OF DRUG IN BIOLOGICAL MEDIA:
The most common samples obtained for bio analysis are blood, urine, and faeces, saliva, bile, breath and tissue. The nature of drug used in the study determines the choice of sampling media. Blood is mostly used in bio analytical methods for identification and quantitative analysis of drugs. Clinical analysis is done mainly on plasma and serum which containing less interfering substance than whole blood.
1.4 EXTRACTION PROCEDURES FOR DRUGS FROM BIOLOGICAL SAMPLES:
Various components may interfere in the detection of drug or its metabolite in biological media and make it complicated. The goal of every extraction process is rapid and effective isolation of compounds from an endogenous biological material by use of minimum amount of solvent. The extraction method determines the sensitivity and selectivity of the assay procedure.
The main objectives of sample preparation prior to chromatographic separation are:
1. The dissolution of analyte in suitable solvent. 2. Removal of interfering compound as possible. 3. Pre-concentration of the analyte.
Depending on the type of biological matrix, the extraction methods can be varied.
The types of extraction methods are: Protein precipitation method.
Liquid-liquid extraction method.(LLE) Solid-phase extraction method.(SPE) Dehydration method.
KMCH College of Pharmacy Page 6
1.4.1 PROTEIN PRECIPITATION METHOD
Protein precipitation method is very simple, economical and effortless than LLE and SPE. Precipitating agents or organic solvents are added to the biological fluid to remove protein by denaturation or precipitation. The precipitating agents are acids like trichloroacetic acid, perchloric acid or organic solvents like acetonitrile, methanol, ethanol, acetone etc. The organic solvents used here should have good solubility of analyte and a property of protein precipitation. This method is suitable in clinical therapeutic drug monitoring and for HPLC method. Three methods of protein precipitation are
By changing the pH of the sample
By addition of organic solvents
Salt induced precipitation
1.4.2 LIQUID –LIQUID EXTRACTION (LLE)
Liquid- liquid extraction is a technique used to extract analytes from liquid matrices. Isolation of analyte from interferences is done by partitioning or distribution of the sample between two immiscible liquids or phases. Partitioning or distribution of a drug between two immiscible liquid phases can be expressed in terms of partition or distribution coefficient, called Partition coefficient. In LLE one phase is aqueous and other is organic solvent. For aqueous phase more hydrophilic compounds are preferred and for organic solvent more hydrophobic compounds are preferred. The two phases used in this method should be immiscible to each other. The solvent should have a low boiling point to facilitate removal at the end of extraction, and a low viscosity to facilitate mixing with the sample matrix. Selectivity is improved by choosing the least polar solvent in which the analyte is soluble. The commonly used extraction solvents are ethyl acetate, diethyl ether, hexane, dichloromethane etc. 1.4.3 SOLID-PHASE EXTRACTION METHOD (SPE)
KMCH College of Pharmacy Page 7
method is also known as liquid solid extraction. Liquid solid extraction is particularly suitable for polar compounds and amphoteric compounds that cannot be extracted easily from water.
The hydrophobic portion of the solute that has little affinity for the water phase is preferentially adsorbed on the resin surface while the hydrophilic portion of the solute remains in the aqueous phase. The solid phase used here is plastic disposable column or cartridge which is packed with 0.1 to 0.5 gm of sorbent like reversed phase material (C-18silica) which has been bonded to a hydrocarbon phases. In this method the liquid sample is added to the cartridge and from that eluent is collected. In this organic solvent consumption is very less and the collection of the analyte is easy.
1.4.4 DEHYDRATION METHOD
Extracts from liquid-liquid extractions often contain water originating from the sample, so sample concentration or clean-up using columns cannot be done directly. Thus, it is necessary to dehydrate the extract. Dehydration is most commonly achieved by using anhydrous sodium sulphate. Samples are dehydrated by adding the anhydrous sodium sulphate directly to the extract and then filtering the dry solvent solution, or passing the samples through a column or funnel packed with anhydrous sodium sulphate.
1.4.5 TURBULENT FLOW CHROMATOGRAPHY (TFC)
It allows on-line extraction of crude biological matrices. It has played an important role in facing all the challenges of bioanalysis. It successfully separate matrix interferences and enabling analysis and detection. The size exclusion
properties of this eliminate the high molecular weight portion of the matrix, and the
salts, while the stationary phase coating retains the analyte through the reverse-phase
and anion-exchange column chemistry. This results in an on-line separation prior to
KMCH College of Pharmacy Page 8
1.4.6 HYBRID EXTRACTION TECHNIQUE
Selective extraction of analyte by using the combination of two or more extraction techniques. This method is adopted to improve the specificity, detection limits and recovery.
1.5 ANALYTICAL TECHNIQUES USED FOR THE QUANTITATIVE
DETERMINATION OF DRUGS IN BIOLOGICAL FLUIDS:
There are different types of methods for quantitative determination of drugs in biological fluids. These methods are selected according to the nature of biological fluid and the drug to be quantified. They are:
a) Methods based on immunoassay procedure
Radioimmunoassay (RIA).
Enzyme-multiplied immunoassay technique.
Enzyme-linked immunosorbent assay (ELISA). b) Microbiological methods.
c) Capillary electrophoresis. d) Chromatographic methods.
Gas chromatography (GC).
High performance liquid chromatography (HPLC).
Liquid chromatography-mass spectroscopy (LC-MS).
Gas chromatography –mass spectroscopy (GC-MS).
Scientifically qualified and properly maintained instruments should be used for the implementation of bio analytical methods in routine drug analysis.
KMCH College of Pharmacy Page 9
1.6 ESTIMATION OF DRUGS IN BIOLOGICAL SAMPLE BY HPLC:
The determination of low concentrations of active ingredients from complex mixtures like biological samples has become more obligatory. Federal regulations have imposed strict limits on the type and concentrations of ingredients. Such requirements demands, rapid and unfailing analytical techniques that have separation and analysis steps combined in a single operation.
High performance liquid chromatography is one of the sophisticated methods for separation of samples from biological fluids. The principle of this technique is adsorption. In this, stationary phase is solid packing material in the column and mobile phase is liquid.
The advantages of HPLC are:
Rapid (analysis can be completed in 20 min or less)
Improved resolution (wide variety of stationary phase). Precise and reproducible.
Uncomplicated recovery of sample, handling and maintenance. Better sensitivity.(various detectors can be employed)
Calculations are done by integrator itself. Perfect for substances of low volatility. Reusable column.
1.7 MODES OF HPLC:
The modes in HPLC are:
Normal phase
Reverse phase
Ion pair chromatography
Ion exchange chromatography
Affinity chromatography
KMCH College of Pharmacy Page 10
In normal phase mode chromatography, the stationary phase is polar and mobile phase is non-polar in nature. Because of the lower affinity towards the stationary phase, the non-polar compounds get eluted first and the polar compounds with higher affinity towards the stationary phase will eluted later. But most of the drugs are polar in nature and they elute slowly, so this mode is not appropriate in pharmaceutical industries.
In reverse phase mode chromatography the stationary phase is non-polar and mobile phase is polar in nature. So, polar compounds elute faster due to their less affinity towards the stationary phase. As most of drugs are polar in nature this mode is more significant in pharmaceutical industries. In this stationary phase used is a non-polar hydrophobic packing of octyl or octa-decyl group bonded with silica gel and mobile phase is a polar solvent. Thus it is used in the separation of the compound of interest in food, chemical, biological and pharmaceutical products.
1.8
INSTRUMENTATION OF HPLC:The different parts in HPLC are:
Mobile phase reservoir
Pumps
Injector
Column
Detector
Data system
KMCH College of Pharmacy Page 11
Fig1: Schematic diagram of HPLC
1.8.1 MOBILE PHASE RESERVOIR:
It is used to store mobile phase. Mostly used type of solvent reservoir is glass bottle provided with special caps. In these glass bottles mobile phase selected is stored and for purging of this suitable gas is used. Purging is done in order to remove the dissolved air in the mobile phase, usually helium gas is used for purging.
1.8.2 PUMPING SYSTEM:
KMCH College of Pharmacy Page 12
can deliver a constant mobile phase composition (isocratic) or an increasing mobile phase composition (gradient).
1.8.3 INJECTOR:
The sample solution is usually introduced into the flowing mobile phase at or near the head of the column using an injection system based on an injection valve design which can operate at high pressure. Such an injection system has a fixed –loop or a variable column device. Automatic devices for introducing samples like auto samplers or microprocessors are used. In HPLC, the liquid samples are directly injected and solid samples are dissolved in suitable solvent and then injected. Injector has two positions i.e. load position and inject position. The sample is injected into the injector in inject position and then, it is passed to the column. Typically the sample volumes are 5 to 20 µL.
1.8.4 COLUMN:
Column acts as the heart of HPLC. HPLC columns are different types and are made up of stainless steel with length of 5, 10, 15 and 25 cm, diameter of 3, 5 or 10µm particles and internal diameter of 4.6mm. Micro bore column are those which have internal diameter 2mm. The column and the mobile phase are maintained at constant temperature, usually at ambient temperature where most of the separations are carried out. Usage and maintenance of the column is done carefully. Mainly the columns are of two types:
Silica based type and Polymer type.
Silica is basic ideal material in HPLC column. It has excellent physiochemical surface properties, mechanical stability and compatible with a wide range of organic solvents. Some silica based columns are C8, C18, C4, C13 and CN.
1.8.5 DETECTOR:
KMCH College of Pharmacy Page 13
UV/visible detector is the most appropriate because of its sensitivity and stability. Such a detector is not suitable for detecting analytes with very weak chromophores. An alternative of the UV/visible type of detector, is the diode array detector which is becoming increasingly popular because of its ability to furnish detailed spectral information. This type of detector acquires absorbance data over a certain UV/visible range and can provide chromatograms at multiple, selectable wave lengths, together with spectra for the eluted peaks. In addition, the detector accompanying computer programs can be used to assess the spectral homogeneity of peaks, which may provide information on the chromatographic purity of the peaks. This can be especially useful in method development validation.
1.8.6 DATA SYSTEM:
The electrical signal from the detector is analyzed by computer system. The data can be stored for further use. The analysis options in these devices contains important features such as overlapping of peaks, resolution run parameters are present. Analytical reports can be customized to the needs of the analyst. It is used to determine the time of elution (retention time) of the sample components (qualitative analysis) and the amount of sample (quantitative analysis).
1.9 MOBILE PHASES USED IN HPLC:
KMCH College of Pharmacy Page 14
1.10
QUANTITATIVE ANALYSIS BY HPLC:Generally three methods are used for the quantitative analysis in HPLC. They are
1) External standard method. 2) Internal standard method. 3) Standard addition method.
1.10.1 EXTERNAL STANDARD METHOD:
In this method standard and sample peak area or height are directly compared. The external standard method can be done by using single standard or up to three different standard solutions. In this method standard and unknown sample are injected and then the concentration of unknown sample can be determined by plotting calibration curve graphically or by numerically using response factors. For good quantification in this method constant chromatographic conditions should be maintained for both standard and sample separation.
1.10.2 INTERNAL STANDARD METHOD:
In this method a known quantity of a compound is added to known amount of sample to give separate peaks, which compensate the loss of compound of interest during sample pre treatment. To overcome various analytical errors addition of internal standard is the commonly used method. The compound selected as internal standard should be completely separate from the sample and should not interfere it. In chromatographic analysis internal standard is added to the compound to be analyzed are desirable, if any loss of compound may occur during handling.
KMCH College of Pharmacy Page 15
added to sample before sample preparation and mix properly. By using response factor (Rf) concentration of sample can be known.
SELECTION OF INTERNAL STANDARD:
A compound added to a sample in known concentration to facilitate the
qualitative identification and/or quantitative determination of the sample components, is
known as internal standard. A compound will be selected based upon polarity and solubility, and chromatographed along with the standard drug. The peak of this compound should be symmetric and well resolved from the peak of the drug.
REQUIREMENTS FOR A PROPER INTERNAL STANDARD:
Well resolved from the compound of interest. Similar retention to the analyte.
Should not be in the original sample.
Should mimic the analyte in sample preparation steps. Commercially available in high purity.
Stable and unreactive with sample or mobile phase. Should have a similar detector response to the analyte.
1.10.3 STANDARD ADDITION METHOD:
In this method, a known amount of standard is added to the sample solution. By plotting calibration curve graphically the quantitative analysis is carried out. This method is used for sample which contains very small quantity of element to be analyzed. This method is used in trace analysis also. By adding the standard to sample solution the peak area is increased and concentration of sample will be computed by interpretation.
1.11 VALIDATION OF BIO ANALYTICAL METHOD DEVELOPMENT:
KMCH College of Pharmacy Page 16
analytical methods are established and disseminated to the pharmaceutical community.
Analytical method validation is the series of demonstration that the analytical procedures are suitable for their intended use provide accurate test results that evaluate a product against its defined specification quality attributes .The U.S. Federal Register states “Validation data must be free to establish that the analytical procedures used in testing fulfil proper of successful reliability”. Any analytical test methods are expected to be used in a Quality Control background but they require an extra level of modification compared to research methods.
Bio analytical method validation comprises all the procedures that display, a particular technique used for quantitative measurement of analytes in a given biological matrix, such as blood, plasma, serum, or urine, is reliable and reproducible for the intended use.
Published methods of analysis are often customized to suit the requirements of the laboratory performing the assay. These modifications should be validated to ensure appropriate performance of the analytical method. When changes are made to a previously validated method, the analyst should implement decision that how much additional validation is necessary. During the course of a distinctive drug development program, a defined bioanalytical method undergoes many modifications. The evolutionary changes to support specific studies and different levels of validation demonstrate the validity of an assay’s performance.
The fundamental parameters for this validation include accuracy, precision, selectivity, sensitivity, reproducibility, and stability. Each analytical method has its own characteristics which may vary from analyte to analyte. So, specific validation criteria are essential to be developed for each analyte.
The process by which a specific bio analytical method is developed, validated and used in routine sample analysis can be divided into:
1. Reference standard preparation for calibration curve
KMCH College of Pharmacy Page 17
3. Application of validated bio analytical method to routine drug analysis and acceptance criteria for the analytical group.
1.12 NEED OF BIOANALYTICAL VALIDATION:
Bioanalytical methods are complex and difficult to validate than the methods used for the quality control of drug products and drug substances because of the nature of the sample. This is because bioanalytical methods include more complex matrices, a large variety of interferences from metabolites, and comparatively low sample volumes. The bioanalytical data needs to be accurate and reliable because they are used for the crucial applications like the calculation of pharmacokinetic parameters that are critical in the review of the performance of a drug or a formulation. So bioanalytical methods need to be thoroughly validated.
1.13 TYPES OF METHOD VALIDATION
Bioanalytical method validation (BMV) is done by three different levels. They are:
Full validation
Partial validation
Cross validation.
1.13.1Full validation:
Full validation is done when developing bio analytical method for first time for a new drug. When metabolites are added to an existing assay for quantification, then Full validation is done.
1.13.2
Partial validation:
KMCH College of Pharmacy Page 18
1.13.3 Cross-validation:
Cross-validation is a comparison of validation parameters when two or more bio analytical methods are used to generate data within the same study or across different studies. An originally validated bio analytical method serves as the reference and the revised bio analytical method is the comparator.
When sample analyses within a single study are conducted at more than one site or more than one laboratory, cross-validation with spiked matrix standards and subject samples should be conducted at each site or laboratory to establish inter laboratory dependability. Cross-validation should also be considered when data generated using different analytical techniques in different studies are included in a regulatory submission.
[image:28.595.112.495.352.704.2]
KMCH College of Pharmacy Page 19
1.14FDA
GUIDELINES
FOR
BIOANALYTICAL
METHOD
VALIDATION:
For bio analytical method validation FDA had given some guidelines to help the scientists in the right track to develop an appropriately validated bio analytical method. They are:
Analyte stability in biological matrix at intended storage and operating conditions should be known.
Standard curve for matrix-based one should contain minimum 5 standards without including blank and it should cover the entire range of concentrations expected.
Essential parameters that are performed for acceptability of bio analytical method are precision, accuracy, selectivity, sensitivity and reproducibility.
Then the lower limit of quantification should serve as lowest concentration on the standard curve and that is not confused with limit of detection.
All these parameters are to be defined during the Full validation of a bio analytical method.
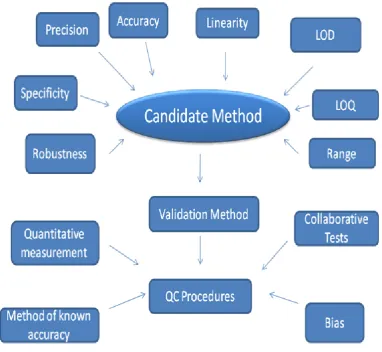
1.15 VALIDATION PARAMETERS:
Different Types of Validation parameters are: Precision
Accuracy
Specificity Selectivity Linearity Range
Limit of Detection (LOD) Limit of Quantification (LOQ) Robustness
KMCH College of Pharmacy Page 20
1.15.1 PRECISION:
Precision is the closeness of individual measurements of the analyte when the procedure is applied repeatedly to multiple samplings of single homogenous sample under prescribed conditions. It is done at three levels such as repeatability, intermediate precision, and reproducibility.
Acceptance Criteria:
Percentage Relative deviation (%RSD) NMT 1 % (Instrument precision)
(%RSD) NMT -2% (Intra- assay precision)1.15.2 ACCURACY:
It is the closeness of mean tests results obtained by the method to true concentration of analyte. Recovery studies are commonly used method for determination of accuracy. It is also named as trueness. The usual range is being 10% above or below the expected range of claim. The % recovery was calculated using the formula,
100 ) ( cov
Re %
bX a b a ery
Where,
a – Amount of drug present in sample b – Amount of standard added to the sample
Acceptance Criteria:
In assay method, mean recovery will be 100%± 2% at each concentration between the ranges of 80-120% of the target concentration.
KMCH College of Pharmacy Page 21
1.15.3 LIMIT OF DETECTION (LOD):
The limit of detection is the lowest concentration of analyte in the sample which can be detected but not quantified under given experimental conditions. The lowest concentration which can be distinguished from the background noise with a certain degree of confidence is defined as limit of detection. Prepare the blank solution as per test method and inject six times into the chromatographic system.
Similarly prepare the linearity solution staring from lowest possible concentration of analyte to 150 % (or as per protocol) of target concentration and establish the linearity curve.
The detection limit (DL) may be expressed as:
LOD = 3.3 X Standard deviation of the response of the blank (σ) Slope
The slope shall be estimated from the calibration curve of the analyte. 1.15.4 LIMIT OF QUANTIFICATION (LOQ):
It is the lowest concentration of analyte in the sample that can be quantitatively determined with suitable accuracy and precision.
In calibration curve it is the lowest concentration point. It is determined by accuracy, by the presence of background signal and by precision i.e. reproducibility of analyte in the method.
Acceptance Criteria:
In Pharmaceutical application, the LOQ is typically set at minimum 0.05% for active pharmaceutical ingredients.
LOQ defined as the lowest concentration providing a RSD of 5%.KMCH College of Pharmacy Page 22
1.15.5 SPECIFICITY:
A method is said to be specific when it produces proper response only for a single analyte in the presence of components that may be expected to present, such as impurities, degradation products, matrix components, etc. It can be demonstrated by performing Placebo /blank interference and forced degradation studies. If the expected impurities or related substances are available, then they should be analyzed along with the analyte or sample to check the system suitability, retention factor, tailing factor and resolution etc. In this peak purity studies are done for specificity.
1.15.6 LINEARITY:
The linearity of an analytical method is its ability to evoke test results that are directly consider to the analyte concentration in samples within a given range. As per ICH definition “the ability to obtain test results which are directly proportional to the concentration of an analyte within given range is known as linearity of an analytical procedure”. By using correlation coefficient this can be tested. Using correlation coefficient is a benefit as it is a relationship between concentration and response data. In this data is analyzed by linear least square regression co-efficient and b of the linear equation,
Y= a X + bBy
the above equation regression r value can be known.For the method to be linear the r value should be close to1. Where Y is the measured output signal, X is the concentration of sample, a is the slope, b is the intercept.
Acceptance criteria:
Coefficient of correlation should be NLT 0.99.
1.15.7 ROBUSTNESS:
KMCH College of Pharmacy Page 23
1.15.8 RUGGEDNESS:
According to the USP is “the degree of reproducibility of test results obtained by the analysis of the same samples under a variety of normal test conditions, such as different labs, different analysts, and different lots of reagents”. The following are the typical method parameters need to test during method validation:
Analyst-to-Analyst variability. Column-to-Column variability. On different days.
K M CH College of Pharm acy Page 24 CHAPTER -2
REVIEW OF LITERATURE
Wang et al21 developed a high-performance liquid chromatographic method for the
estimation of Pirfenidone and its key metabolites in rat plasma. The plasma proteins
were precipitated with perchloric acid (10% v/v) and the supernatant after
centrifugation was determined using high-performance liquid chromatography. A
Lichrospher C-18 column with mobile phase containing acetonitrile-water containing
0.2% acetic acid (23:77, v/v) was used. The flow-rate was 1mL min-1 and measured at
310 nm by UV detector. The developed method was found to be linear at a range of
0.15 to 76.67 µg mL-1. The method was validated for accuracy and precision and
found to be satisfactory. The method was successfully applied for the
pharmacokinetic study of Pirfenidone.
Zhang et al22 developed a high-performance liquid chromatographic method for the
determination of pirfenidone and its related substance. The development was carried
out by using a Diamonsil C-18 column with mobile phase containing
acetonitrile-water containing 0.2% acetic acid (33∶67) at a flow rate of 1mL min-1. The detection
wavelength was 310 nm. The linearity was found to be in a range of 34.38-
171.91mgL-1. The linear equation was A=19205C+8017.3, R2 =0.9999. The RSD
value was found to be 0.16%. The developed HPLC method was simple, sensitive,
specific, and accurate with excellent reproducibility and successfully applied for
determination of pirfenidone.
KMCH College of Pharmacy Page 25
CHAPTER-3
AIM AND OBJECTIVE
Determination of drug concentration in biological fluid is very much important in the field of bioavailability, bioequivalence, drug abuse, pharmacokinetics, toxicological studies, drug research and development, therapeutic drug monitoring and clinical studies.
HPLC is the predominantly used separation technique for the analysis of biological fluids. It is a rapid and sensitive separation technique. The widespread acceptance of this separation method is due to its well-developed characteristics like ruggedness, specificity, linearity, precision and accuracy.
Pirfenidone is a newer pyridine molecule with anti-inflammatory and anti fibrotic activity. It is used in the treatment of pulmonary fibrosis. It is a small non-peptide molecule of low molecular weight 185.2 daltons. It inhibits fibroblast proliferation & differentiation related to collagen synthesis. It also inhibits production & activity of TGF-β. It reduces production of fibronectin & connective tissue growth factor (CTGF).
Pirfenidone is not official in Indian Pharmacopoeia.
From the extensive literature review, there were only two method found for the determination of pirfenidone. The first method was determination of related substance and another method was in biological sample. But this method suffers from some disadvantages like lack of internal standard and lower sensitivity.
Since, there is no method reported to study the effect of food on the pharmacokinetic profile of Pirfenidone in rat plasma, there is a need to develop a more sensitive and cost effective method for the determination of pirfenidone in rat plasma and also to study the effect of food in rat plasma.
KMCH College of Pharmacy Page 26
CHAPTER-4
PLAN OF WORK
Bioanalytical method development
The present work is planned to divide into four phases
Phase-I
Optimization and development of chromatographic
conditions.
Selection of wavelength
Selection of initial separation conditions
Selection of mobile phase (pH, solvent strength, ratio and flow rate)
Nature of the stationary phase
Selection of internal standard
Selection of separation method and agent
Phase-II
Validation of the method
.The developed method were proposed to be validated using the various validation parameters such as,
Accuracy
Precision
Linearity
Limit of detection (LOD) / Limit of quantitation (LOQ)
Selectivity / Specificity
System suitability
KMCH College of Pharmacy Page 27
Phase-III
The amount of pirfenidone present in biological fluids were proposed to be estimated, then analyzing pharmacokinetic study design and data handling.
Phase -IV
Pharmacokinetic Study.
The parameters of pharmacokinetic study is being proposed to be calculated as,
C max – Maximum plasma concentration
T max – Time of maximum plasma concentration
AUC (0-t) – Area under plasma concentrations time curve 0 to 12hrs.
AUC (0-∞) – Area under plasma concentrations time curve 0 to ∞ hrs
T ½ – Elimination half life
K Eli – Elimination constant
KMCH College of Pharmacy Page 28
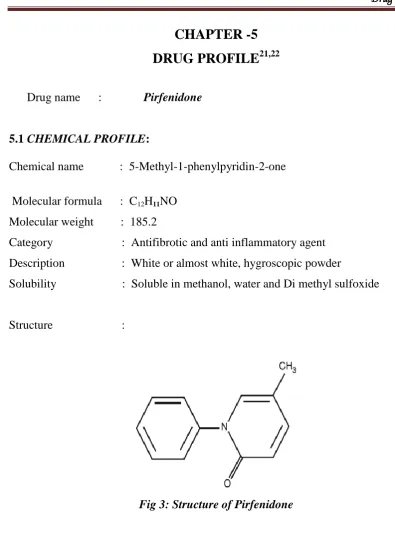
CHAPTER -5
DRUG PROFILE
21,22Drug name : Pirfenidone
5.1 CHEMICAL PROFILE:
Chemical name : 5-Methyl-1-phenylpyridin-2-one
Molecular formula : C12H11NO Molecular weight : 185.2
Category : Antifibrotic and anti inflammatory agent Description : White or almost white, hygroscopic powder
Solubility : Soluble in methanol, water and Di methyl sulfoxide
[image:38.595.99.495.62.600.2]Structure :
Fig 3: Structure of Pirfenidone
5.2 PHARMACOLOGICAL PROFILE:
MECHANISM OF ACTION:
KMCH College of Pharmacy Page 29
inhibits its degradation. It reduces the production of other mediators of fibrogenesis, such as fibronectin and connective tissue growth factor (CTGF).
PHARMACOKINETIC DATA
Half life
: 2 - 2.5hrs Excretion
:Renal Routes
: Oral
ADVERSE REACTIONS:
The most common adverse effects of pirfenidone are photosensitivity, loss of appetite (anorexia), stomach discomfort and nausea and elevated gamma glutamyl transpeptidase levels, AST (SGOT) and ALT (SGPT) levels.
It may also lead to renal impairment and hepatic dysfunctions.
DOSAGE : Available as 200mg and 400mg tablet
CONTRAINDICATIONS:
Pirfenidone is contraindicated in patients with a history of hypersensitivity to the drug component.
DRUG INTERACTIONS:
Pirfenidone clearance is reduced with co-administration of fluvoxamine, which inhibits CYP1A2 and several other CYP isoforms. Strong CYP1A2 inhibitors should therefore be used with caution in patients receiving pirfenidone due to potential for reduced clearance. Pirfenidone clearance is significantly higher in cigarette smokers than non-smokers, presumably due to higher CYP1A2 enzyme activity in smokers.
INDICATIONS:
K M CH College of Pharm acy Page 30 CHAPTER-6
METHODOLOGY
6.1 MATERIALS AND INSTRUMENT USED:
6.1.1 DRUG SAMPLE & STUDY PRODUCTS:
Pirfenidone standard was procured from Cipla Ltd, Himachal Pradesh, India.
Test product : Pirfenex (Pirfenidone 200mg Tablet)
Company : Cipla Ltd.
6.1.2 CHEMICALS AND SOLVENTS USED FOR ESTIMATION: •HPLC Water - Qualigens, Mumbai, India
•Acetonitrile - Rankem, Mumbai, India.
•Methanol - Finar, Ahmadabad, India
•Distilled water - Double Distilled water. •Orthophosphoric acid - SD fine chem. Ltd, Mumbai.
6.1.3 INSTRUMENTS USED:
•Elico pH meter LI 127.
•Shimadzu LC-20 AT HPLC.
•SPD-M20A Prominence diode array detector.
•Shimadzu 1600 LC-UV Spectrophotometer.
•Sonica ultrasonic cleaner.
•Solvent filtration unit – Millipore.
•Shimadzu electronic balance AY 220.
K M CH College of Pharm acy Page 31
6.2 OPTIMIZATION OF CHROMATOGRAPHIC CONDITION FOR THE
ESTIMATION OF PIRFENIDONE
6.2.1SELECTION OF WAVELENGTH
An UV spectrum of 10 µg mL-1 pirfenidone in water was recorded by
scanning in the range of 200 nm to 400 nm. From the UV spectrum wavelength of
324nm was selected. At this wave length Pirfenidone showed maximum absorbance.
6.2.2 SELECTION OF CHROMATOGRAPHIC METHOD
Selection of proper chromatographic method depends on the nature of the
sample or its properties like ionic/ionisable/neutral character, its molecular weight and
solubility. The drug selected for the present study was polar in nature hence, reverse
phase HPLC or ion-pair or ion–exchange chromatography method may be used.
Because of its simplicity and appropriateness for initial separations reverse phase
HPLC method was selected.
6.2.3 INITIAL CHROMATOGRAPHIC CONDITIONS FOR SEPARATION
Standard solution: 10µg mL-1 of pirfenidone solution was prepared in
HPLC grade water.
Equipment:
System : Shimadzu gradient HPLC
Pump : LC – 20AT prominence solvent
delivery system
Detector : SPD-M20A Prominence Diode array
detector
Injector : Rheodyne 7725i with 20µl loop
Chromatographic conditions 1:
Stationary phase : Phenomenex C-18 column (25 cm x 4.6 mm, 5µm ID)
Mobile phase : Solvent A–water
Solvent B-Acetonitrile
K M CH College of Pharm acy Page 32
Wavelength of detection : 324nm.
Flow rate : 1.0mL min-1.
Sample size : 20µL.
Needle wash : HPLC grade water.
Temperature : Room temperature (250C)
At the above chromatographic conditions Pirfenidone was eluted at the
retention time of 2.8 min. The peak observed was broad and asymmetric, thus not
selected for further studies.
Chromatographic condition 2:
Stationary phase : Phenomenex C-18 Column(25 cm x 4.6 mm,
5µm ID)
Mobile phase : Solvent A–water pH 5.5
(adjusted with orthophosphoric acid)
Solvent B- Acetonitrile
Solvent ratio : 55:45 (A: B)
Wavelength of detection : 324nm.
Flow rate : 1.0mL min-1.
Sample size : 20µL.
Needle wash : HPLC grade water.
Temperature : Room temperature (250C)
Pirfenidone was eluted at retention time of 3.1 min with peak fronting, hence
not selected for further method development.
Chromatographic condition 3:
Stationary phase : Phenomenex C-18 Colum(25 cm x 4.6 mm,
5µm ID)
Mobile phase : Solvent A–water pH 4.5
(adjusted with orthophosphoric acid)
Solvent B- Methanol: Acetonitrile (10:25)
Solvent ratio : 50:50 (A: B)
K M CH College of Pharm acy Page 33
Flow rate : 1.0mL min-1.
Sample size : 20µL.
Needle wash : HPLC grade water.
Temperature : Room temperature (250C)
Pirfenidone was eluted at retention time of 3.7 min with peak tailing and no
peak was observed for internal standard.
Chromatographic condition 4:
Stationary phase : Phenomenex C-18 Colum (25 cm x 4.6 mm,
5µm ID)
Mobile phase : Solvent A–water pH 3.5
(adjusted with orthophosphoric acid)
Solvent B- Methanol: Acetonitrile (15:20)
Solvent ratio : 55:45 (A: B)
Wavelength of detection : 324nm.
Flow rate : 1.0mL min-1.
Sample size : 20µL.
Needle wash : HPLC grade water.
Temperature : Room temperature (250C)
Pirfenidone was eluted at retention time of 4.7 min with peak tailing, hence
not selected for further method development.
Chromatographic condition 5:
Stationary phase : Phenomenex C-18 Column (25 cm x 4.6 mm,
5µm ID)
Mobile phase : Solvent A–water pH 3.5
(adjusted with orthophosphoric acid)
Solvent B- Methanol: Acetonitrile (15:20)
Solvent ratio : 60:40 (A: B)
Wavelength of detection : 324nm.
K M CH College of Pharm acy Page 34
Sample size : 20µL.
Needle wash : HPLC grade water.
Temperature : Room temperature (250C)
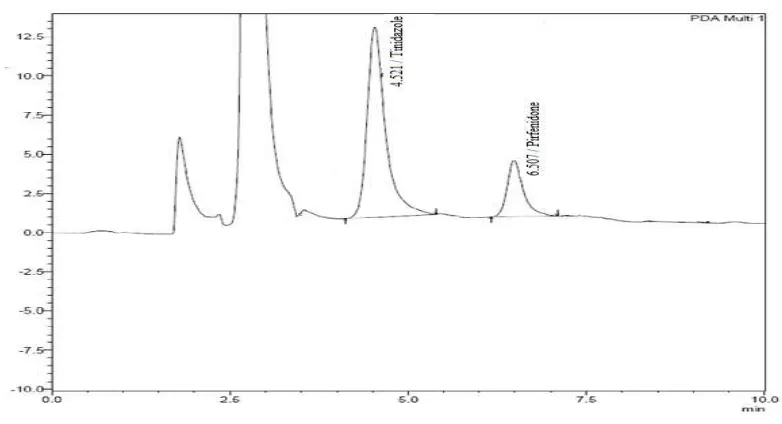
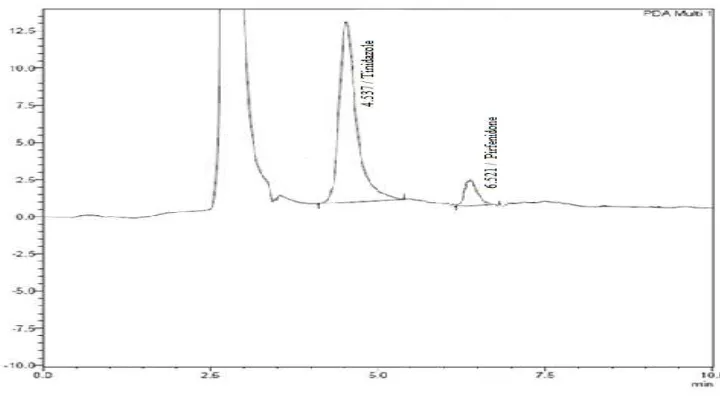
Pirfenidone was eluted at 6.5min and internal standard at 4.5min with perfect
peak properties, hence the above chromatographic condition was selected for further
studies.
6.24 Effect of pH
Using 20% of acetonitrile, 15% of methanol and water of different pH ranging
from 3.5, 4.5, 5.5 at 324nm, the standard solution was runned up to 20 min at a flow
rate of 1.0 mL min-1. The retention time of pirfenidone was 6.5, 4.7, 3.7 minutes
respectively. The chromatogram obtained for pH 3.5 was symmetrical in shape, so for
the present study, pH of 3.5 was selected.
6.2.5 Effect of ratio of mobile phase
Methanol,acetonitrile and water with 50:50, 45:55 and 40:60 (B:A) ratios
were used as the mobile phase. At 50:50 and 45:55 ratios the peaks were asymmetric.
At 40:60 (B:A) ratio, symmetric peaks were eluted at 6.5 min and 4.5 min for
pirfenidone and internal standard (tinidazole) respectively. Thus for the present study
40:60 ratio of methanol(15%), acetonitrile(20%) and water was selected as the
mobile phase.
6.2.6 Effect of flow rate
Chromatograms were recorded at a flow rate of 0.5, 1.0 and 1.5mL min-1 with
the mobile phase ratio at (40:60 v/v) Methanol (15%), acetonitrile (20%): water (pH
3.5). At flow rate of 1.0mL min-1, the peaks were sharp and separated with good
resolution. Hence, flow rate of 1mL min-1 was kept constant for the present analysis.
6.2.7 SELECTION OF INTERNAL STANDARD
A known concentration of Tinidazole, geftinib and tinofovir were selected and
chromatographed along with the standard drug. The selection was based upon polarity
K M CH College of Pharm acy Page 35
symmetric and well resolved from the peak of the pirfenidone. Hence, for the present
study tinidazole was selected as the internal standard.
6.2.8 Fixed chromatographic conditions
The following chromatographic conditions were used for the estimation of
pirfenidone.
Stationary phase : Phenomenex C-18 Column (25 cm x 4.6 mm, 5µm ID)
Mobile phase : Solvent A- Water pH 3.5 (adjusted with
orthophosphoric acid)
Solvent B -Methanol (15%) : Acetonitrile (20%)
Solvent ratio : 60:40 (A: B)
Detection : 324 nm
Flow rate : 1.0 mL min-1
Sample size : 20µL.
Temperature : Room temperature (250C)
6.3 BIOANALYTICAL STUDY DESIGN
The study adheres to “Principles of Laboratory Animal Care” and is approved
by the animal care committee IAEC/CPSEA-Institutional animal ethics /Committee
for the purpose of control and supervision of experiments on animals
(KMCRET/M.PHARM/13/2011-12).
6.4 PHARMACOKINETIC STUDY DESIGN
Animals for study : Rat
Healthy Wister rats (male) of weight 150-250 grams were taken and grouped.
The rats were taken from KMCH college of pharmacy animal house, which were
quarantined a week before. Rats are divided in to three groups, group A and group B
and group C. Group A is control (4 rats), group B is set of fasted animals (10 rats) and
group C is set of animals without fasting (10 rats).According to body weight of each
K M CH College of Pharm acy Page 36 6.5 PREPARATION OF STOCK SOLUTION
Twenty tablets of pirfenidone were weighed and average weight was
calculated. Weighed accurately tablet powder equivalent to 200mg and transferred
into a 5 mL volumetric flask . Made up the volume with sufficient distilled water.
6.6 SAMPLE WITHDRAWAL
According to the body weight of each animal the drug solution was given
through oral gavage. Group (B) animals were kept fasted overnight. Blood samples
were withdrawn at specified pre-determined time intervals from 0.5 to 6.0 h using
retro orbital nerve puncture. The blood samples were immediately transferred to
collection tubes containing Disodium EDTA and shaken well, centrifuged using ultra
cooling micro centrifuge at 5000 rpm to separate plasma. The separated plasma
samples were transferred to a labelled air tight sample tubes and kept in deep freezer
for further analysis.
6.7 SEPARATION METHOD
6.7.1 PROTEIN PRECIPITATION METHOD
The separation method used here is protein precipitation. Precipitating agents
(Diethyl ether and ethyl acetate) were added to the sample, and the precipitate was
removed by centrifugation. The supernatant solution was collected and kept for
evaporation. After complete evaporation sufficient amount of mobile phase was added
to reconstitute the sample. The reconstituted sample was then injected into the HPLC
column.
To 200µL of plasma sample, 200µL of standard drug solution, 200µL of
internal standard,100µL of diethyl ether and 100µL of ethyl acetate were added.
Then it was centrifuged for 10 min at 5000 rpm. The same procedure was repeated
with Acetonitrile and methanol and percentage recovery was calculated for all
precipitating agents. According to percentage recovery, mixture of diethyl ether and
K M CH College of Pharm acy Page 37
6.8 ESTIMATION OF PIRFENIDONE IN PLASMA
For the estimation of pirfenidone in rat plasma, Shimadzu LC-20 HPLC
system with the following chromatographic conditions was used:
Stationary phase : Phenomenex C-18 column (5µm,25cm×4.6mm ID)
Mobile phase : Solvent A- Water pH 3.5 (adjusted with orthophosphoric
acid)
Solvent B -Methanol (15%) : Acetonitrile (20%)
Solvent ratio : 60:40 % v/v
Detection wavelength : 324nm
Flow rate : 1.0 mL min-1
Sample size : 20 µL
Needle wash : water HPLC
Column temperature : Room temperature of above 25˚c
6.9 PREPARATION OF STANDARD STOCK SOLUTION
Stock solution of pirfenidone and internal standard 1000µg mL-1 were
prepared separately using mobile phase. Weigh accurately 10mg of pirfenidone and
internal standard into two separate 10mL volumetric flask and the volume was made
up to 10 mL with the mobile phase.
From the standard stock solution, 10µg mL-1 solution was prepared by diluting
1mL to 100mL with mobile phase. 1mL of the above solution was diluted to 10mL
with mobile phase to get a concentration of 1µg mL-1. Further solutions were made
from the above solution by diluting 0.5, 1.0, 1.5, 2.0 and 2.5mL standard solutions to
10mL in a standard flask with mobile phase to get concentrations of 50, 100, 150, 200
K M CH College of Pharm acy Page 38 6.10 PREPARATION OF STANDARD GRAPH
To 200µL of blank plasma, 100µL of working standard solution of pirfenidone
was added to yield a final respective concentration as 50,100,150,200 and 250ng mL-1
of pirfenidone in plasma. To each calibration standard 100 µL of 1000ng/mL of
tinidazole (internal standard) solution was added and vortexed. To these calibration
standards, 100µL of precipitating agent (mixture of ethyl acetate and diethyl ether)
was added, and centrifuged for 15 min at 5000 rpm. After centrifugation the clear
supernatant liquid was collected and kept for evaporation. After complete evaporation
the residue was reconstituted with mobile phase. A volume of 20µL was injected into
the HPLC column and chromatograms were recorded. Standard calibration graph was
plotted using peak area of pirfenidone against its concentration.
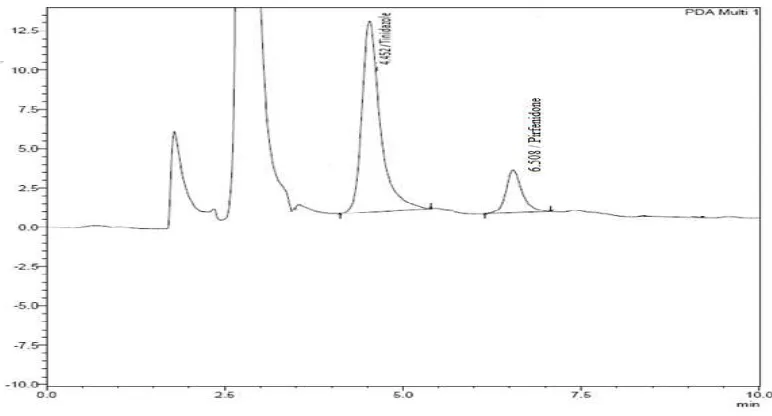
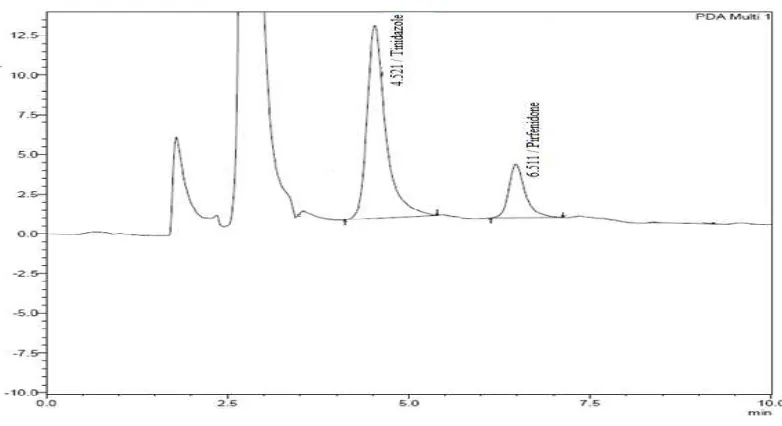
6.11 ESTIMATION OF PIRFENIDONE IN RAT PLASMA:
To 200µL of plasma (collected from rat at predetermined time interval after
drug administration), 100µL of internal standard solution and 100µL of precipitating
agent (mixture of ethyl acetate and diethyl ether) were added and centrifuged for 15
min at 5000 rpm. After centrifugation the clear supernatant liquid was collected and
kept for evaporation. After complete evaporation it was reconstituted with mobile
phase. A volume of 20µL was injected into the HPLC column with the optimized
chromatographic conditions and chromatograms were recorded.
The retention time of pirfenidone and the internal standard (Tinidazole) were
6.5 and 4.5 min respectively.
6.12VALIDATION OF THE METHOD:
Validation is an important step to be carried out after method development. It
is to ensure that the developed method was suitable for the intended purpose.
6.12.1 ACCURACY:
It is the closeness of mean tests results obtained by the method to true
concentration of analyte. It is also named as trueness. The usual range is being 10%
K M CH College of Pharm acy Page 39
To 200µL of plasma, 100µL of standard drug solution, 100µL of internal
standard solution and 100µL of precipitating agent (mixture of ethyl acetate and
diethyl ether ) were added and centrifuged for 15 min at 5000 rpm. After
centrifugation, the clear supernatant liquid was collected and kept for evaporation.
After complete evaporation residue was reconstituted with mobile phase. A quantity
of 20µL was injected into the HPLC column and analysed. The absolute recovery of
pirfenidone was estimated by comparing the response factor of the drug obtained from
the plasma with that obtained from the direct injection of drug in mobile phase.
The response factor obtained from an amount of the drug added to and
extracted from the biological matrix, compare to the response factor obtained for the
true concentration of the pure authentic standard is known as the recovery of a drug in
an assay.
Recovery studies were carried out for three levels at six times and the
percentage recovery, mean standard deviation and coefficients of variation were
calculated.
6.12.2 PRECISION:
Precision is the closeness of individual measurements of the analyte when the
procedure is applied repeatedly to multiple samplings of single homogenous sample
under prescribed conditions. Intraday and interday precision studies were conducted.
The intraday precision was evaluated by analysis of plasma sample containing
drug at three different concentration containing the internal standard using nine
replicate determinations for three occasion were injected and chromatogram was
recorded.
The inter -day precision was similarly evaluated over a period of two week
and the response factor and RSD were calculated, from that the mean concentration,
K M CH College of Pharm acy Page 40 6.12.3 RECOVERY STUDIES:
The relative recovery of drug from plasma was calculated by comparing the
readings of concentration obtained from the plasma containing drug to that of equal
concentration from standard sample. Recovery studies were carried out six times for
sample concentration at three levels within the calibration curve.
6.12.4 LINEARITY AND RANGE:
The linearity of an analytical method is its ability to evoke test results that are
directly consider to the analyte concentration in samples within a given range.
Range is the interval between the upper and lower concentration of the analyte
in the sample such that it should have a suitable level of precision, accuracy and