0022-538X/96/$04.00
1
0
Copyright
q
1996, American Society for Microbiology
Neutralization Serotypes of Human Immunodeficiency Virus
Type 1 Field Isolates Are Not Predicted by Genetic Subtype
JONATHAN WEBER,
1EVA-MARIA FENYO
¨ ,
2SIMON BEDDOWS,
1PONTIANO KALEEBU,
1ÅSA BJO
¨ RNDAL,
2AND THEWHO NETWORK
FORHIV ISOLATION
ANDCHARACTERIZATION†
Department of Communicable Diseases, Imperial College School of Medicine at St. Mary’s, London W2, United
Kingdom,
1and Microbiology and Tumour Biology Centre, Karolinska Institute, Stockholm, Sweden
2Received 18 September 1995/Accepted 22 May 1996
Human immunodeficiency virus type 1 (HIV-1) primary isolates from four geographical locations in
Thai-land, Brazil, Rwanda, and Uganda, representing genetic subtypes A, B, C, D, and E, were examined for
autologous and heterologous neutralization by panels of human HIV
1polyclonal plasma. In independent
linked experiments in three laboratories using diverse methodologies and common reagents, no defined pattern
of genetic subtype-specific neutralization was observed. Most plasma tested were broadly cross-neutralizing
across two or more genetic subtypes, although the titer of neutralization varied across a wide range. We
conclude that the genetic subtypes of HIV-1 are not classical neutralization serotypes.
Human immunodeficiency virus type 1 (HIV-1) is
character-ized by remarkable genetic diversity (6, 12), which has been
classified phylogenetically into one main group of HIV-1
iso-lates (group M) and one outlier group (group O) (18). The
main group currently consists of eight genetic subtypes, A to H
(21). Typically, intrasubtype nucleotide sequences vary by 5 to
15% and intersubtype sequences vary by up to 30% (21). We
have addressed the biological significance of these genetic
sub-types in relation to vaccine development. The Global
Pro-gramme on AIDS of the World Health Organization (WHO)
has collaborated in the development of potential field sites for
future phase III trials of HIV/AIDS vaccines in Rwanda,
Uganda, Thailand, and Brazil (26). To better define the HIV-1
strains circulating in these countries, an international network
of laboratories undertook the task of isolating and extensively
characterizing the HIV-1 strains in each site. At least 30 HIV-1
isolates from each site have been genetically subtyped by the
heteroduplex mobility assay (7), and representative strains
have been sequenced in the V3, C2/V3, and/or complete gp120
or gp160 region (10). In this survey, Rwandan isolates were all
genetic subtype A; Ugandan isolates were genetic subtype A or
D; and Brazilian isolates were predominantly genetic subtype
B, including a B
9
variant, with rare C and F subtypes identified.
The Thailand isolates were predominantly genetic subtype E,
with a Thai B variant identified in a small minority (26).
Ac-cording to phylogenetic classification, all of these isolates
be-long to the main group of HIV-1 isolates (18, 21).
To determine whether these genetic subtypes based on
phy-logenetic analyses of nucleotide sequences also define
func-tional neutralization types (classical serotypes), the
immuno-typing
group
of
the
WHO
Network
examined
the
neutralization of representative HIV-1 field isolates from
ge-netic subtypes A to E. Type-specific antisera raised to
recom-binant Env proteins do not neutralize field isolates passaged in
peripheral blood mononuclear cells (PBMCs) (4, 20); however,
field isolates can be neutralized by polyclonal sera from HIV
1subjects (1, 3). Sera from HIV
1subjects infected with diverse
genetic subtypes exhibit type specificity in terms of Env peptide
binding (5). Thus, the neutralization titers of autologous and
heterologous plasma samples were assayed in a checkerboard
fashion, using the WHO panel of field isolates from genetic
subtypes A to E; the plasma samples were mostly obtained
from subjects who had seroconverted within 2 years prior to
blood collection. Initial studies were carried out with pooled
plasma from each geographical location, and subsequent
checkerboard analyses were undertaken with individual plasma
samples. Identical aliquots of well-characterized viral stocks of
primary field isolates, passaged one to two times through
do-nor PBMCs, were used in all assays. Common reagents were
used in three laboratories to assess the reproducibility of each
assay format and hence the validity of testing in separate
lab-oratories.
MATERIALS AND METHODS
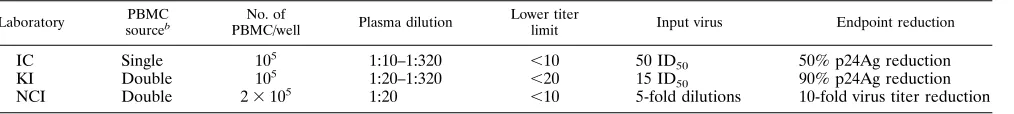
Each of the three participating laboratories (Imperial College, London, United Kingdom [IC], Karolinska Institute, Stockholm, Sweden [KI], and Na-tional Cancer Institute, Bethesda, Md. [NCI]) used their own techniques and controls (Table 1); a common positive control plasma (FDA#2) was used in each laboratory, and a panel of common plasma and viruses was studied to compen-sate for interlaboratory variation. Positive controls from each participating lab-oratory were selected from HIV1subjects previously shown to have high-titer neutralizing antibodies against subtype B field isolates in PBMCs. All assays used 3-day phytohemagglutinin (PHA)-stimulated donor PBMCs, with viral produc-tion measured by p24 antigen (p24Ag) enzyme-linked immunosorbent assay (ELISA). In two laboratories (IC and KI), neutralization assays were carried out with serial twofold dilutions of heat-inactivated plasma in multiple replicates, with a fixed quantity of input virus (50 tissue culture infective doses for IC and 15 for KI). Neutralization titers were defined after 7 days of incubation as the reciprocal of the highest dilution of plasma giving 50% (IC) or 90% (KI) reduc-tion in p24Ag compared with an HIV-negative control plasma. The third labo-ratory (NCI) used an infectivity reduction format, with a fixed dilution of plasma (final dilution, 1:20) and fivefold dilutions of viral stock. Neutralization titer in
† Participants of the WHO Network for HIV Isolation and
Characterization who contributed to this study: S. Osmanov, W.
Heyward, and J. Esparza (Global Programme on AIDS, World Health
Organisation, Geneva, Switzerland); B. Galvao-Castro (Oswaldo Cruz
Foundation, Salvador, Brazil); P. van de Perre and E. Karita (National
HIV/AIDS Reference Laboratory, Kigali, Rwanda); C. Wasi
(Depart-ment of Microbiology, Mahidol University, Bangkok, Thailand); S.
Sempala, B. Tugume, and B. Biryahwaho (Uganda Virus Research
Institute, Entebbe); H. Ru
¨bsamen-Waigmann, H. von Briesen, R.
Es-ser, and M. Grez (Georg-Speyer-Haus Chemotherapeutisches
Fors-chungsinstitut, Frankfurt, Germany); H. Holmes, A. Newberry, S.
Ranjbar, and P. Tomlinson (National Institute of Biological Standards
and Control, London, United Kingdom); J. Bradac (Division of AIDS,
National Institute of Allergy and Infectious Diseases, Bethesda, Md.);
Continued on following page
7827
on November 9, 2019 by guest
http://jvi.asm.org/
this assay was determined by the log10reduction of viral infectivity by the test plasma compared with an HIV2plasma control. A 10-fold reduction of infec-tivity was considered neutralization. A number of washing techniques were adopted to abrogate interference from input anti-p24 antibody on the p24Ag ELISA readout (2); the IC laboratory also used an anti-p24 antibody from a Ty.p24.VLP vaccine study (24) in which the anti-p24 antibody titer is in a range similar to that found in clinical samples.
Neutralization assays and ID50determinations carried out at IC and KI. (i) Primary virus titration.In the IC laboratory, virus isolates were titrated in five replicates from 1:5 to 1:15,625 with 1053-day PHA (5mg/ml; Sigma)-stimulated donor PBMCs from a single donor, in RPMI 1640 (Gibco) with 15% fetal calf serum (FCS; Seralab), interleukin-2 (IL-2; 10 IU/ml; MRC-ADP), and antibiot-ics, in 96-well round-bottom plates (Corning). The supernatant was changed on days 1 and 3, and 100ml of supernatant was taken on day 7 for HIV-1 p24Ag determination by in-house ELISA (15). The viral 50% infective dose (ID50) was calculated by the Reed-Muench formula.
The KI laboratory used a virus titration technique (2) similar to that described above except that (i) PBMCs from two different donors were stimulated with 2.5 mg of PHA (Difco) per ml and (ii) medium containing 10% FCS (Gibco), 5 IU of recombinant IL-2 (Amersham) per ml, and 2mg of Polybrene (Sigma) per ml was used throughout. The in-house ELISA is described in reference 23.
(ii) Neutralization assay.In the IC laboratory, the plasma was heat inactivated at 568C for 30 min and serially diluted in duplicate from 1:5 to 1:160 in a 50-ml volume. Virus was added at a constant 50 ID50, the plates were incubated for 1 h at 378C, and then 105PHA-stimulated PBMCs were added, to make a final volume of 200ml. The plates were washed on days 1 and 3, and the supernatant was taken at day 7 for p24Ag assay. The controls used were wells with cells only, virus only, and cells and virus with no plasma. The neutralizing titer of a partic-ular plasma and virus was defined as the reciprocal of the highest dilution giving a 50% reduction in p24Ag by ELISA compared with the HIV2plasma control. Neutralization assays in the KI laboratory were run simultaneously with ID50 titrations, using three virus dilutions for each plasma sample (2). The plasma were diluted in triplicate directly in the plate, in a total volume of 75ml. Five steps of twofold dilutions, starting with 1:10, were used. Virus was then added in an equal volume, and the test carried out as at IC. The negative virus controls consisted of five wells with virus but no cells and five wells with cells but no virus. A serum from an asymptomatic Swedish subject selected for high-titer neutral-izing antibodies (SE1785) was used as positive serum control. Neutralization was evaluated with 15 infective doses. The neutralizing titer of a plasma was defined
as the reciprocal of the highest dilution giving a 90% reduction in absorbance value in the p24Ag assay.
Infectivity reduction assay (NCI).The same pool of normal donor PBMCs was used for each panel of plasma. All plasmas were heat inactivated at 568C for 30 min and then centrifuged at 4,000 rpm for 15 min. FDA#2 plasma was obtained through Ogden Bioservices Inc., and normal human serum was from the same pooled serum lot (Gibco, Grand Island, N.Y.). For each assay, a mock-treated virus only (no cells) control was included to establish that residual p24 was effectively diluted to remove background p24. PHA-stimulated PBMCs were treated with Polybrene and prepared as described above. Wash medium (RPMI 1640, 15% FCS, 1%L-glutamine, 1% penicillin/streptomycin) was added to the A and H rows of a V-bottom microtiter culture plate to minimize evaporation loss from inner wells. PBMCs were dispensed at 20ml (23105) to the appro-priate wells of the culture plate. Heat-inactivated geographic plasmas were diluted at threefold the desired final concentration of 1:20 with heat-inactivated normal human serum, and 20ml of the diluted plasma was added to five replicate wells for each virus dilution. Virus titrations were performed at four- or fivefold dilutions, depending on the range of dilutions necessary to achieve an endpoint with all test samples. Viral dilutions were prepared in a separate plate at three times the final desired dilution, and then a 20-ml volume of the diluted virus (five wells per dilution) was added to the cells and plasma for a final volume of 60ml in the infectivity assay. The virus-alone control wells contained 40ml of coculture medium (wash medium plus 32 IU of IL-2 per ml) instead of PBMCs and antibody. The plate was placed in an incubator, and cells were cultured overnight (16 to 18) at 378C, 5% CO2, and 95% humidity. The next morning, 2.0 ml of wash medium was added to each corresponding well of a 96-well Cube 2ube (DBM, Valencia, Calif.) for each culture plate to be washed. The 60-ml volume of cells and supernatant from V-bottom culture plates was gently resuspended and transferred to the Cube 2ube. Following the transfer, each well of the V-bottom culture plate was rinsed with 200ml of wash medium taken from the Cube 2ube wells. The Cube 2ube plates were then centrifuged for 15 min at 2203g, and 1.9
ml of wash medium was removed by aspiration. This step was performed twice more. After the third and final wash, the cells were gently resuspended in the remaining 100ml and transferred from the Cube 2ube to an appropriately labeled 96-well U-bottom microtiter culture plate. Each well of the Cube 2ube was rinsed with 100ml of coculture medium containing twice the normal con-centration of IL-2, the rinse was added to the appropriate wells of the microtiter plate to create a final volume of 200ml, and the plates were placed in a 5% CO2 incubator. On day 4, the cells and supernatant were gently resuspended in all wells, a 125-ml sample was removed, and the original culture plate was refed with 150ml of fresh coculture medium. The day 4 supernatant was saved in a 96-well plate for p24Ag capture analysis. At day 7, the original culture plate was centri-fuged for 15 min at 2203g and 150ml of supernatant was transferred to a 96-well plate for p24Ag capture analysis (Dupont ELISA kit).
Calculation of neutralization index or relative difference was performed as follows. For each virus isolate used in infectivity reduction assays, a parallel titration was performed in the presence of NHS alone as a reference for virus growth. Each well in a viral dilution assay was scored plus or minus by comparing its p24 count with a cutoff. The cutoff used was mean background plus 3 standard deviations. ID50s and associated errors were then calculated by one of three methods, the model fit, the curve fit, or Spearman-Karber, with the computer program ID-50, which can run on Macintosh or IBM computers under Windows 2.1, as previously described (22).
RESULTS
A comparison of the input virus concentration, number of
PBMCs, and titration of plasma among the laboratories is
shown in Table 1.
Pooled plasma neutralization (IC).
Initially, pools of plasma
samples from each geographical location, representing
Rwanda (A), Brazil (B), Thailand (E/B), and Uganda (A/D),
with an additional subtype B plasma pool from UK HIV
1subjects, were made. Neutralization was studied in the IC
lab-TABLE 1. Comparison of neutralization assays in the three laboratories
aLaboratory PBMC
sourceb
No. of
PBMC/well Plasma dilution
Lower titer
limit Input virus Endpoint reduction
IC
Single
10
51:10–1:320
,
10
50 ID
50
50% p24Ag reduction
KI
Double
10
51:20–1:320
,
20
15 ID
50
90% p24Ag reduction
NCI
Double
2
3
10
51:20
,
10
5-fold dilutions
10-fold virus titer reduction
aParameters of input virus, cells, and plasma are shown for each of the three laboratories. In all cases, 96-well plates were used, the endpoint was 7 days, and p24
was measured.
bRefers to number of donors used following cell separation and activation.
Continued from preceding page
F. McCutchan, J. Louwagie, and P. Hegerich (Henry M. Jackson
Foundation Laboratory, Walter Reed Army Institute of Research,
Rockville, Md.); C. Lopez-Galindez, I. Olivares, and J. Dopazo
(Centro Nacional de Biologı´a Celular y Retrovirus, Instituto de Salud
Carlos III, Madrid, Spain); J. I. Mullins, E. L. Delwart, and H. M.
Bachmann (Department of Microbiology and Immunology, Stanford
University School of Medicine, Stanford, Calif.); J. Goudsmit and F.
de Wolf (Human Retrovirus Laboratory, University of Amsterdam,
Amsterdam, The Netherlands); B. H. Hahn, F. Gao, and L. Yue
(Department of Medicine, University of Alabama, Birmingham); S.
Saragosti (Institut Cochin, Paris, France); G. Schochetman, M. Kalish,
C.-C. Luo, R. George, and C.-P. Pau (Centers for Disease Control and
Prevention, Atlanta, Ga.); J. Weber, R. Cheingsong-Popov, P.
Kaleebu, and S. Beddows (St. Mary’s Hospital Medical School,
Lon-don, United Kingdom); P. Nara (Virus Biology Unit, National Cancer
Institute, Frederick, Md.); E.-M. Fenyo
¨ (Karolinska Institute,
Stock-holm, Sweden); J. Albert (Swedish Institute for Infectious Disease
Control, Stockholm); G. Myers and B. Korber (Los Alamos National
Laboratory, Los Alamos, N.Mex.).
on November 9, 2019 by guest
http://jvi.asm.org/
[image:2.612.60.567.82.139.2]oratory as outlined in Table 1. No type specificity of
neutral-ization was demonstrated by these pools on 10 virus isolates
from genetic subtypes A, B, and D, while plasma pooled from
the UK produced the highest titers of cross-neutralization
(Ta-ble 2). This finding led us to conclude that neutralization assays
would have to be performed with individual plasma samples.
Autologous and heterologous neutralization.
Checkerboard
panels of neutralization of autologous and heterologous
vi-ruses and plasmas were then undertaken in the two
participat-ing laboratories (Tables 3 and 4). In Table 3 (IC), which shows
neutralization titers of seven plasma samples against five field
isolates from genetic subtypes A to D, high-titer autologous
neutralization (1:80) is seen only for one plasma-virus
combi-nation (RW009). Autologous neutralization was weak (
#
1:20)
or absent in four of five pairs. The broadest
cross-neutraliza-tion is observed with the FDA#2 plasma and with the subtype
B U.K. control plasma M36321 (from a London patient with
AIDS), which neutralized four of five and five of five field
isolates, respectively, irrespective of genetic subtype. The
con-trol anti-p24 plasma was consistently negative, which illustrates
the effectiveness of the washing techniques. Table 4 (KI) shows
the neutralization titers of 12 plasma samples against eight
field isolates representing genetic subtypes A to E. Autologous
neutralization is weak or absent, with only UG037, RW009,
and UG038 showing high (1:80) titers. No genetic
subtype-specific pattern is discernible from these data. Instead, broadly
cross-neutralizing activity was demonstrated in five cases.
SE1785 (the Swedish positive control serum; presumed
sub-type B), RW008, and TH022 neutralized seven of eight viruses
tested, spanning all five subtypes. Neutralization titers were
generally low (1:20 to 1:40) with the TH022 plasma and high
with SE1785 (1:80 to
.
1:320), two to eight times higher than
with RW008. Thus, SE1785 was the broadest and most potent
cross-neutralizing reagent in this panel. Next-best plasma
sam-ples were TH026 and FDA#2, both neutralizing six of eight
viruses. TH026 failed to neutralize subtype C, while FDA#2
failed to neutralize subtype D.
The IC and KI laboratories used their own neutralization
assay methodologies; however, assays based on the growth of
primary viruses in donor PBMCs are subject to biological
vari-ation, of the order of 0.6 log
10, which has been found
repeat-edly in studies requiring the quantitative cocultivation of
HIV-1 (9, 17). Interassay variation within the IC laboratory
ranged over
6
1 dilution on seven replicates of a common
primary virus and plasma pair (data not shown). Neutralization
titers on virus stocks and plasma samples common to both
laboratories and a third collaborating laboratory (NCI) are
shown in Fig. 1. Figures 1A to E show representative plasma
from subjects infected by genetic subtypes A to E; titers against
the five field isolates representing genetic subtypes A, B, C,
and D are generally low; laboratories are consistent within
6
1
dilution for 60 of 66 assays (91%). In Fig. 1F, the titers of the
FDA#2 plasma against the five field isolates show a range of
neutralization over approximately 0.6 log
10for any
plasma-virus combination; each laboratory scored a different plasma-virus
highest. Only one virus (UG024) was not neutralized by
FDA#2, and this finding was consistent in each laboratory.
These data demonstrate that the titers of neutralization are
comparable to within 0.6 log
10, irrespective of assay
method-ology, and that high-titer and low-titer plasma samples are
recognized comparably by all laboratories. This variation is
similar to that seen in the comparative neutralization study by
D’Souza et al. (8).
DISCUSSION
These data, from three laboratories with independent but
comparable assays and common reagents, demonstrate that
the pattern of neutralization of HIV-1 field isolates is not
simply related to genetic subtype. The checkerboards
under-taken at IC and KI show no clear pattern of neutralization in
relation to genetic subtype. While it is possible to identify
monospecific plasma, the cross-reactivity of primary virus
neu-TABLE 2. Pooled plasma neutralization titers
aSubtype Pooled plasma origin
Endpoint neutralization titer for indicated WHO primary virus isolate and genetic subtype
A B D
UG029 UG031 RW009 BR014 BR020 BR021 TH014 UG024 UG038 UG046
A/D
Uganda
20
40
20
20
80
20
80
10
10
10
A
Rwanda
80
80
40
40
80
40
80
20
20
40
B
Brazil
10
10
10
10
20
10
10
—
—
—
E/B
Thailand
—
20
10
10
20
10
10
—
—
10
B
United Kingdom
20
80
40
80
.
320
80
.
320
20
20
40
a
[image:3.612.54.559.84.179.2]Endpoint titers (50% p24Ag reduction), from the IC laboratory, of plasma pools from the four sites against 10 field isolates from genetic subtypes A, B, and D, with a U.K. plasma pool from HIV1homosexual men (n55) infected with the B subtype as a control. —, neutralization titer of,10.
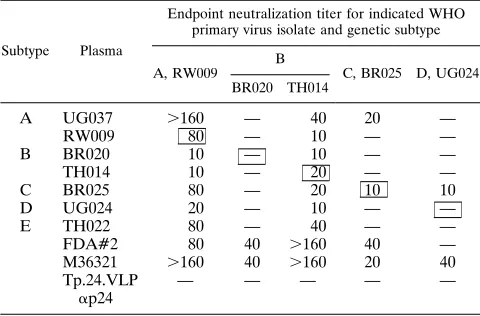
TABLE 3. Autologous and heterologous neutralization titers (IC)
aSubtype Plasma
Endpoint neutralization titer for indicated WHO primary virus isolate and genetic subtype
A, RW009 B
C, BR025 D, UG024
BR020 TH014
A
UG037
.
160
—
40
20
—
RW009
80
—
10
—
—
B
BR020
10
—
10
—
—
TH014
10
—
20
—
—
C
BR025
80
—
20
10
10
D
UG024
20
—
10
—
—
E
TH022
80
—
40
—
—
FDA#2
80
40
.
160
40
—
M36321
.
160
40
.
160
20
40
Tp.24.VLP
a
p24
—
—
—
—
—
aFull checkerboard of autologous and heterologous endpoint neutralization
titers (50% p24Ag reduction) of seven plasmas from subjects infected by genetic subtypes A to E against five viruses isolated from the same subjects. —, titer of ,10. The boxed figures show autologous neutralization. FDA#2 was a common positive control pooled plasma first produced by the U.S. Food and Drug Ad-ministration, derived on three occasions from a single HIV1homosexual male from the United States, and presumed to be subtype B. Plasma M36321 was a positive control plasma from a U.K. HIV1homosexual male with AIDS, and the Ty.p24.VLP plasma was from a vaccine study with a p24Ag in healthy HIV2 volunteers (14). The methodology was identical to that used for Table 2.
on November 9, 2019 by guest
http://jvi.asm.org/
[image:3.612.316.556.488.646.2]tralization across genetic subtypes is the dominant
interpreta-tion of these data.
These results are entirely consistent with the data published
by Weiss et al. in 1985 (25), from a study using
laboratory-adapted viruses in immortalized T-cell lines, which
demon-strated that sera from U.K. and Ugandan HIV-1
1subjects
were equally capable of neutralizing North American or
Afri-can HIV-1 isolates. In that study, sera either failed to
neutral-ize or exhibited broad neutralization across all viruses tested.
Similarly, viruses either were relatively resistant to
neutraliza-tion or were neutralized equally by all potent plasmas. In the
present study also, plasma samples showed differences in the
capacity to neutralize. One-third of the plasma samples can be
said to be broadly cross-neutralizing, with the selected positive
control plasmas M36321 (IC), FDA#2 (tested by both
labora-tories), and SE1785 (KI) found to be the most potent. The rest
of the plasmas show a spectrum of neutralizing activities, with
BR020 plasma being the weakest. With respect to the viruses,
the RW009 isolate appeared to be the most sensitive to
neu-tralization and was neutralized by all nine plasmas tested at IC
and by 12 of 14 plasma tested at KI. In contrast, the UG024
isolate showed relative resistance to neutralization and was
neutralized by 2 of 9 (IC) and 6 of 14 (KI) plasmas. Like
plasmas, viruses showed a spectrum of sensitivities rather than
falling into clear-cut groups. This difference from the study by
Weiss et al. (25) may be explained by the larger amount of
material tested and by the fact that primary isolates were tested
on PBMCs.
More recently, Mascola et al. have reported that the B and
E subtypes in Thailand may be discrete neutralization
sero-types (13). Sera from subjects infected by B and E genetic
subtypes are the most discrete and diverse in V3 peptide
bind-ing assays (5, 19); however, subtype E plasmas analyzed in our
studies were generally weak neutralizers of all viruses, while
potent subtype B plasmas reproducibly neutralized subtype E
virus. Our results are in line with those reported by Kostrikis et
al. (11) and Moore et al. (16); i.e., no neutralization pattern
consistent with genetic subtypes can be documented, even
when a large number of sera and isolates are tested. With
respect to the V3 peptide binding data, subtype B and E
viruses represent the far poles of an antigenic spectrum,
mak-ing the weak cross-neutralization seen in Table 4 even more
significant.
The env sequence-derived genetic subtypes can be
repre-sented by peptides representing V3 consensus sequences; sera
from HIV
1subjects bind to these V3 peptides representing
subtypes A to E in a type-specific manner (5). As binding can
be shown to be at least in part subtype specific, the presence of
cross-neutralization rather than type-specific neutralization
suggests that the V3 epitope does not contribute significantly
to the capacity of human HIV
1sera or plasma to neutralize
field isolates of HIV-1 in PBMCs. Interestingly, another study
using chimeric viruses carrying the gp120 portion of the
enve-lope from primary HIV-1 isolates on the HXB2 backbone led
to a similar conclusion (14). The cross-neutralizing activity in
human sera appeared to be directed to epitopes outside gp120.
This observation remains to be confirmed by further study but
may be highly significant to future vaccine development.
[image:4.612.61.558.83.259.2]In accordance with other studies (11, 16), we may conclude
that the genetic subtypes based on the phylogeny of env
se-quences are not classical neutralization serotypes. The
impli-cations of these findings for vaccine research are both
encour-aging and frustrating. First, even at the level of first-passage
field isolates of HIV-1 from potential phase III vaccine field
TABLE 4. Autologous and heterologous neutralization titer (KI)
aSubtype Plasma
Endpoint neutralization titer for indicated WHO primary virus isolate and genetic subtype
A B
C, BR025
D
E, TH/BKK10
UG037 RW009 BR020 TH014 UG024 UG038
A
UG037
80
40
20
—
40
—
—
—
RW008
40
80
80
—
40
20
160
40
RW009
—
80
—
—
ND
—
—
—
B
BR003
—
40
20
80
—
—
20
320
BR020
80
20
—
—
—
—
—
—
TH014
ND
20
—
—
ND
—
—
ND
TH026
40
40
20
20
—
20
—
320
C
BR025
20
—
—
—
ND
—
20
—
D
UG024
—
40
20
—
—
20
20
40
UG038
20
40
—
80
—
80
80
—
E
TH011
40
—
—
—
—
—
—
20
TH022
40
20
40
—
20
20
20
20
FDA#2
80
40
80
160
.
320
—
—
160
SE1785
160
160
160
80
.
320
80
—
320
aFull checkerboard of autologous and heterologous endpoint neutralization titers (90% p24Ag reduction) of 12 plasma samples against eight viruses, partly from
the same subjects. —, titer of,10; ND, not done. Autologous neutralization is shown by the boxed figures. FDA#2 is a positive control plasma (see Table 3); SE1785 is a positive control serum from a Swedish HIV1homosexual male, presumed to be subtype B, selected because of prior evidence of broad neutralizing activity against primary isolates.
FIG. 1. Interlaboratory comparison of neutralization. The neutralization titers of six plasma samples from subjects infected with genetic subtypes A to E were compared among the three laboratories, using five common first- or second-passage field isolates from genetic subtypes A, B, C, and D. The laboratories (h, IC;Ç, KI;E, NCI) used independent methodologies as outlined in Table 1. Shown are neutralization titers of virus isolates RW009 (subtype A), BR020 (subtype B), TH014 (subtype B), BR025 (subtype C), and UG024 (subtype D) against plasmas RW009 (subtype A) (A), TH014 (subtype B) (B), BR025 (subtype C) (C), UG024 (subtype D) (D), TH022 (subtype E) (E), and FDA#2 (F). Endpoint neutralization titers in the IC and KI assays (Tables 3 and 4) are shown on the left-hand y axis; the titers in the infectivity reduction assay (NCI) are shown on the right-hand y axis (methodology in Table 1). The cutoff for the IC data is,10, and that for the KI data is,20 (Table 1); for the purposes of these comparisons, negative values are taken as#10.
on November 9, 2019 by guest
http://jvi.asm.org/
on November 9, 2019 by guest
http://jvi.asm.org/
sites, cross-neutralizing epitopes dominate in HIV
1human
sera and plasmas. However, to date antibodies to these
epitopes have not been induced by immunization with
recom-binant proteins. If an immune response to these epitopes is
important in conferring protection against HIV and can be
elicited by immunization, the considerable genetic variation of
HIV-1 may not preclude a successful HIV vaccine.
ACKNOWLEDGMENTS
The WHO Network was created by Jose
´ Esparza and Saladin
Os-manov (GPA, WHO, Geneva, Switzerland); the repositories were
managed by Jim Bradac (NIAID, Bethesda, Md.) and Harvey Holmes
(NIBSC, London, United Kingdom), and the viruses were originally
isolated by Helga Ru
¨bsamen-Waigmann (Frankfurt, Germany), to all
of whom we are most grateful.
The comparative assays at NCI were undertaken by P. Nara, with
technical support provided by A. Fowler and V. Polonis.
The work at IC was supported by the Medical Research Council,
WHO, the Hadwen Trust, the Jefferiss Research Trust, and the Kulika
Trust. The work at KI was supported by grants from the Swedish
Medical Research Council, the Swedish National Board for Industrial
& Technical Development, the Swedish Agency for Research
Co-operation with Developing Countries, and WHO.
REFERENCES
1. Albert, J., B. Abrahamsson, K. Nagy, E. Aurelius, H. Gaines, G. Nystrom,
and E. M. Fenyo¨.1990. Rapid development of isolate-specific neutralising antibodies after primary HIV-1 infection and consequent emergence of virus variants which resist neutralisation by autologous sera. AIDS 4:107–112. 2. Albert, J., E. Bjo¨rling, A. von Gegerfelt, G. Scarlatti, Y. J. Zhang, E. M.
Fenyo¨, and R. Thorstensson.1993. Antigen detection is a reliable method for evaluating HIV/SIV neutralization assays. AIDS Res. Hum. Retroviruses
9:501–504.
3. Ariyoshi, K., E. Harwood, R. Cheingsong-Popov, and J. Weber. 1992. Is clearance of HIV-1 viraemia at seroconversion mediated by neutralising antibodies? Lancet 340:1257–1258.
4. Berman, P., S. Beddows, L. Riddle, P. Kaleebu, D. Eastman, F. Wurm, T.
Gregory, R. Cheingsong-Popov, and J. Weber.Relationship between genetic subtype and antigenic structure of HIV-1 envelope glycoproteins assessed with antisera to rgp120 from diverse isolates. AIDS, in press.
5. Cheingsong-Popov, R., S. Lister, D. Callow, P. Kaleebu, S. Beddows, and J.
Weber.1994. Serotyping HIV-1 through antibody binding to the V3 loop: relationship to viral genotype. AIDS Res. Hum. Retroviruses 10:1379–1385. 6. Coffin J. 1986. Genetic variation in AIDS viruses. Cell 45:1–4.
7. Delwart, E. L., E. G. Shpaer, J. Louwagie, F. E. McCutchan, M. Grez, H.
Rubsamen-Waigmann, and J. I. Mullins.1993. Genetic relationships deter-mined by a DNA heteroduplex mobility assay: analysis of HIV-1 env genes. Science 262:1257–1261.
8. D’Souza, M. P., G. Milman, J. A. Bradac, D. McPhee, C. V. Hanson, R. M.
Hendry, and Collaborating Investigators.1995. Neutralization of primary HIV-1 isolates by anti-envelope monoclonal antibodies. AIDS 9:867–874. 9. Fiscus, S. A., V. DeGruttola, P. Gupta, D. A. Katzenstein, W. A. Meyer III,
M. L. LoFaro, M. Katzman, M. V. Ragni, P. S. Reichelderfer, and R. W. Coombs.1995. Human immunodeficiency virus type 1 quantitative cell mi-croculture as a measure of antiviral efficacy in a multicenter clinical trial. J. Infect. Dis. 171:305–311.
10. Gao, F., L. Yue, S. Craig, C. L. Thornton, D. L. Robertson, F. E. McCutchan,
J. A. Bradac, P. M. Sharp, B. H. Hahn, and the WHO Network for HIV
Isolation and Characterisation.1994. Genetic variation of HIV type 1 in four World Health Organization-sponsored vaccine evaluation sites: gener-ation of functional envelope (glycoprotein 160) clones representative of sequence subtypes A, B, C and E. AIDS Res. Hum. Retroviruses 10:1359– 1369.
11. Kostrikis, L. G., Y. Cao, H. Ngal, J. P. Moore, and D. D. Ho. 1996. Quan-titative analysis of serum neutralization of human immunodeficiency virus type 1 from subtypes A, B, C, D, E, F, and I: lack of direct correlation between neutralization serotypes and genetic subtypes and evidence for prevalent serum-dependent infectivity enhancement. J. Virol. 70:445–458. 12. Louwagie, J., F. McCutchan, M. Peeters, T. P. Brennan, E. Sanders-Buell,
G. A. Eddy G. van der Groen, K. Fransen, G. M. Gershy-Damet, R. Deleys, and D. S. Burke.1993. Phylogenetic analysis of gag genes from 70 interna-tional HIV-1 isolates provides evidence for multiple genotypes. AIDS 7:769– 780.
13. Mascola, J., J. Louwagie, F. McCutchan, C. L. Fischer, P. A. Hegerich, K. F.
Wagner, A. K. Fowler, J. G. McNeil, and D. S. Burke.1994. Two antigenically distinct subtypes of human immunodeficiency virus type 1: viral genotypes predicts neutralization serotype. J. Infect. Dis. 169:48–54.
14. McKeating, J. A., Y.-J. Zhang, C. Arnold, R. Frederiksson, E.-M. Fenyo¨, and P. Balfe.Chimeric viruses expressing primary envelope glycoproteins of human immunodeficiency virus type 1 show increased sensitivity to neutral-ization by human sera. Virology, in press.
15. Moore, J. 1992. MRC ADP reagent catalogue. Medical Research Council, London.
16. Moore, J. P., Y. Cao, J. Leu, L. Qin, B. Korber, and D. D. Ho. 1996. Inter-and intraclade neutralization of human immunodeficiency virus type 1: ge-netic clades do not correspond to neutralization serotypes but partially correspond to gp120 antigenic serotypes. J. Virol. 70:427–444.
17. MRC/ANRS Delta Virology Committee. Unpublished data.
18. Myers, G., A. B. Robson, J. A. Berzofsky, and T. F. Smith (ed.). 1991 and 1992. Human retroviruses and AIDS. A compilation of nucleic acid and amino acid sequences. Los Alamos National Laboratory, Los Alamos, N.Mex.
19. Ou, C. Y., Y. Takebe, B. G. Weniger, S. Yamazaki, H. D. Gayle, N. L. Young,
and G. Schochetman.1993. Independent introduction of two major HIV-1 genotypes into distinct high risk populations in Thailand. Lancet 341:1171– 1174.
20. Sawyer, L., M. T. Wrin, L. Crawford-Miksza, B. Potts, Y. Wu, P. A. Weber,
R. D. Alfonso, and C. V. Hanson.1994. Neutralisation sensitivity of human immunodeficiency virus type 1 is determined in part by the cell in which the virus is propagated. J. Virol. 68:1342–1349.
21. Sharp, P. M., D. L. Robertson, F. Gao, and B. H. Hahn. 1994. Origins and diversity of human immunodeficiency viruses. AIDS 8(Suppl. 1):S27–S42. 22. Spouge, J. L. 1992. Statistical analysis of sparse infection data and its
impli-cations for retroviral treatment trials in primates. Proc. Natl. Acad. Sci. USA
89:7581–7585.
23. Sundqvist, V. A., J. Albert, E. Ohlsson, J. Hinluka, E. M. Fenyo¨, and B. Wahren.1989. Human immunodeficiency virus type 1 p24 production and antigenic variation in tissue culture of isolates with various growth charac-teristics. J. Med. Virol. 29:170–175.
24. Weber, J. N., R. Cheingsong-Popov, D. Callow, S. Adams, G. Patou, K.
Hodgkin, S. Martin, F. Gotch, and A. Kingsman.1995. Immunogenicity of the yeast recombinant p17/p24:Ty virus-like particles (p24-VLP) in healthy volunteers. Vaccine 13(9):831–834.
25. Weiss, R. A., P. R. Clapham, R. Cheingsong-Popov, A. G. Dalgleish, C. A.
Carne I. V. D. Weller, and R. S. Tedder.1985. Neutralisation of human T-lymphotropic virus type III by sera of AIDS and AIDS-risk patients. Nature (London) 316:68–72.
26. WHO Network for HIV Isolation and Characterisation. 1994. HIV type 1 variation in World Health Organization-sponsored vaccine evaluation sites: genetic screening, sequence analysis, and preliminary biological character-ization of selected viral strains. AIDS Res. Hum. Retroviruses 10:1327–1345.