0022-538X/96/$04.00
1
0
Copyright
q
1996, American Society for Microbiology
Dynamics and Modulation of Human Immunodeficiency Virus
Type 1 Transcripts In Vitro and In Vivo
PATRIZIA BAGNARELLI,
1* ANNA VALENZA,
1STEFANO MENZO,
1RICCARDO SAMPAOLESI,
1PIETRO E. VARALDO,
1LUCA BUTINI,
2MARIA MONTRONI,
2CARLO-FEDERICO PERNO,
3STEFANO AQUARO,
3DOMINIQUE MATHEZ,
4JACQUES LEIBOWITCH,
4CLAUDIA BALOTTA,
5ANDMASSIMO CLEMENTI
6Istituto di Microbiologia
1and Centro di Immunologia Clinica,
2Universita
` di Ancona, Ancona, Dipartimento di
Medicina Sperimentale e Scienze Biochimiche, Universita
` di Roma (Tor Vergata), Rome,
3Clinica delle Malattie
Infettive, Universita
` di Milano, Milan,
5and Dipartimento di Scienze Biomediche, Universita
` di Trieste,
Trieste,
6Italy, and Centre d’Immuno-Virologie, H. Raymond Poincare´, Garches, France
4Received 10 June 1996/Accepted 5 August 1996
The dynamics of human immunodeficiency virus type 1 (HIV-1) transcription was analyzed in vitro and in
vivo by using a specific molecular approach which allows accurate quantitation of the different classes of viral
mRNAs. Unspliced (US) and multiply spliced (MS) HIV-1 transcripts were assayed by competitive reverse
transcription (cRT)-PCR, using a single competitor RNA bearing in tandem internally deleted sequences of
both template species. Acute HIV-1 infection of primary peripheral blood mononuclear cells (PBMCs),
monocytes/macrophages cells, and the A3.01 T-lymphocyte-derived cell line was studied; both classes of HIV-1
mRNAs increased exponentially (
r
2> 0.98) at days 1 to 3 and 1 to 4 postinfection in HIV
IIIB-infected A3.01 cells
and PBMCs, respectively, whereas monocytes/macrophages infected with monocytotropic HIV
BaLexhibited a
linear (
r
25
0.81 to 0.94) accumulation of US and MS transcripts. Following induction of chronically infected
ACH-2 cells, MS transcripts increased 2 h postinduction and peaked at 5 h (doubling time, 58 min), while at
24 h, US mRNAs increased 3,053-fold compared with basal time (doubling time, 137 min). To address the
biopathological significance of HIV-1 expression pattern during infection progression, pilot cross-sectional and
longitudinal analyses were carried out with samples from untreated and treated HIV-1-infected patients. In
almost all untreated (recently infected, long-term nonprogressor, and progressor) patients, MS transcript
levels followed the general trend of systemic HIV-1 activity. In patients under treatment with powerful
antiretroviral compounds, viral MS transcripts rapidly fell to undetectable levels, indicating that in vivo, levels
of MS mRNAs in PBMCs are closely associated with the number of newly infected cells and suggesting a new
role for the quantitative analysis of HIV-1 transcription in infected patients.
Current knowledge of the molecular biology and virus-host
interactions of lentiviruses suggests that this subgroup of
hu-man retroviruses is highly heterogeneous (18, 19, 41, 45). Visna
virus, the prototype of lentiviruses, causes progressive disease
after a protracted asymptomatic phase (44); its target cell in
natural host is the monocyte/macrophage (M/M), and
estab-lishment of an efficient viral expression is slow, requiring not
only expression of the visna virus rev gene (79) but also cell
maturation (17). Conversely, a primate lentivirus (the simian
immunodeficiency virus SIVsmmPBj14) causes disease and
death of infected pig-tailed macaques within days and displays
unique replicative characteristics consistent with acute
infec-tion (13, 34, 35, 76).
The natural history and pathogenesis of human
immunode-ficiency type 1 (HIV-1) infection are complex, multistep, and
multifactorial processes that depend on a multitude of viral
and host factors and on their interactions (21, 26, 38, 39, 60,
82–84). A considerable body of molecular data indicates that
both HIV-1- and host cell-specific (transcriptional and
post-transcriptional) mechanisms are involved in the regulation of
viral expression and replication (2, 10, 12, 22, 27–30, 42, 51, 52,
54, 58, 61, 62, 66, 70, 71, 80) and demonstrates that HIV-1
genes are expressed through the complex splicing of a single
mRNA precursor, leading to three major classes of transcripts:
unspliced (US), singly spliced (SS), and multiply spliced (MS)
(9, 71). In vitro, reactivation of latent HIV-1 infection is
char-acterized by an early increase in MS transcripts, followed by a
rise in SS and US viral messengers (22, 42, 43, 50, 51, 70, 75).
In the last few years, semiquantitative and quantitative
mo-lecular methods have been used to assess viral RNA expression
levels in peripheral blood mononuclear cells (PBMCs) and
lymph node mononuclear cells and cell-free HIV-1 genomic
RNA copy numbers in plasma (HIV-1 viremia) from infected
subjects at different clinical stages (4, 5, 7, 14, 15, 49, 59, 64, 69,
73, 74). The data have unequivocally shown that HIV-1 US
transcripts are detectable in PBMCs and lymph node
mono-nuclear cells at virtually any stage of the infection, as are
cell-free viral genomes in plasma (HIV-1 viremia).
Neverthe-less, quantitative studies have indicated that significantly
in-creased HIV-1 viremia and transcriptional activity in PBMCs
parallel disease progression in a large proportion of infected
patients (7, 36, 57). Recent studies have established that
anal-ysis of HIV-1 plasma viremia may provide crucial help not only
for understanding AIDS pathogenesis but also for clinical
management of infected subjects and monitoring specific
anti-HIV-1 therapies (3, 6–8, 47, 48, 63, 69, 81). More recently, the
prognostic role of HIV-1 viremia has been emphasized (55).
Overall, these reports have suggested that the assessment of
HIV-1 genome copy numbers in plasma samples offers both a
theoretical and a practical advantage over any other molecular
or biological parameter of evaluation of systemic viral activity
* Corresponding author. Mailing address: Istituto di Microbiologia,
Universita
` di Ancona, via Pietro Ranieri, I-60131 Ancona, Italy.
Phone: 39 71 5964850. Fax: 39 71 5964852.
7603
on November 9, 2019 by guest
http://jvi.asm.org/
in vivo (central nervous system excluded) (16). Conversely,
conflicting results were obtained in studies aimed at
determin-ing the correlation (if any) between particular patterns of viral
mRNAs expression in PBMCs and disease progression.
Blocked early-stage HIV-1 RNA expression (documented by
high ratio of MS to US viral mRNAs) was found in a group of
symptomless HIV-1-infected subjects in an early report (77).
Subsequent research has failed to confirm that the blocked
state is associated to lack of (or very slow) infection
progres-sion and has suggested that high levels of intracellular viral
(US and MS) mRNAs in PBMCs are predictive of a decrease
in peripheral CD4
1T-cell count (72). More recently, other
studies have demonstrated that both the shift from a
predom-inantly MS HIV-1 mRNA pattern to a predompredom-inantly US
pattern (57) and/or the increase in US viral RNA in PBMCs
are associated with a decline in CD4
1T-cell numbers (36).
Moreover, changes in the splicing pattern of HIV-1 RNA have
been detected in patients following administration of specific
anti-HIV-1 compounds (37). In this context, it is crucial at
present to establish (i) the exact biopathological correlates of
the different molecular determinants of HIV-1 activity in vivo
(cell-free viremia, viral transcripts in PBMCs and
transcrip-tional activity, and dynamic ratio of MS to US HIV-1 mRNAs),
since these indices may reflect different aspects of the
virus-host relationship, (ii) whether these molecular indexes allow
direct identification of a threshold of malignant and
irrevers-ible disease progression, and (iii) the precise diagnostic role of
these indices during therapy with specific anti-HIV-1
com-pounds.
We describe here a qualitative and quantitative analysis of
HIV-1 RNA expression that uses a novel application of
com-petitive reverse transcription (cRT)-PCR. A single competitor
RNA template (bearing in tandem deleted HIV-1 sequences
for both gag and tat-rev-nef) was designed to be used in this
study, thus ensuring reliable quantitation of the two classes of
viral mRNAs in perfect agreement with the general concept of
cRT-PCR (14, 15). In vitro and in vivo applications of this
method were performed. In vitro experiments showed the
rel-evant dynamic features of HIV-1 mRNAs during acute
infec-tion of A3.01 cells, primary PBMCs, and M/M and after
in-duction of chronically infected ACH-2 cells. Clinical samples
from two populations of HIV-1-infected patients were also
assayed in pilot cross-sectional and longitudinal studies:
un-treated (recently infected, typical progressor, and long-term
nonprogressor [LTNP]) patients and patients under treatment
with a combination of specific anti-HIV-1 compounds.
MATERIALS AND METHODS
Virus stocks.HIVIIIB, used to infect A3.01 and PBMCs, was obtained from H9
acutely infected cells at day 8 postinfection (p.i.). Cell-free virus present in the supernatant was filtered through a 0.2-nm-pore-size filter, aliquoted, and stored at2808C. The genome concentration as determined by cRT-PCR was 43109
HIV-1 genomes per ml, corresponding to 570 ng of p24 antigen (Du Pont de Nemours, Boston, Mass.) and 6.1 310550% tissue culture infective doses
(TCID50) in A3.01 cells.
HIVBaL, used for experiments with M/M, was a kind gift of R. C. Gallo. Its
concentration was 2.13108genomes (corresponding to 35 ng of p24 antigen)
per ml and 5,000 TCID50, as assessed in primary M/M. Five-day adherent M/M
derived from blood of healthy seronegative donors were used to prepare and expand the viral stock of HIVBaLas described in detail elsewhere (68).
Cells and cell cultures.A3.01 (31) and ACH-2 (32) T-cell lines were main-tained in growth medium (RPMI 1640 supplemented with 10% fetal calf serum). Cells were split weekly at 23105and 53104, respectively. Cultures were
incubated at 378C under a 5% CO2atmosphere.
A3.01 cells were infected with four different concentrations of the HIV-1IIIB
viral stock (63109to 63106HIV-1 genome molecules per 1.5 ml). Briefly, 63
106cells were suspended in a small volume of medium and added to four tubes
containing the different virus concentrations, the final volume being 3 ml per tube. Adsorption was allowed to occur for 2 h, and then the cell-free virus was carefully washed out (three times with growth medium). Viable cells were
counted in a hemocytometer after trypan blue dye exclusion staining, resus-pended in growth medium at a concentration of 23105per ml, and seeded (2
ml per well) in a 24-well tissue culture plate (Corning Costar Corp., Cambridge, Mass.). Cells were harvested after 7, 24, 48, 72, and 96 h and at day 7 p.i. The first subculture was performed at day 7 p.i. and subsequently every 7 days for 6 weeks. The chronically infected ACH-2 cell line was induced with phorbol 12-myris-tate 13-ace12-myris-tate (PMA). The cell suspension was adjusted to 23105cells per ml,
and three aliquots (1 ml each) were immediately pelleted and resuspended in denaturing solution (see below) for RNA extraction (time zero). PMA was added to the remaining cell suspension at a final concentration of 10 nM. Induced cells were seeded in a 24-well tissue culture plate (1 ml per well); harvesting of cell samples was performed in duplicate 1, 3, 5, 7, 15, and 24 h after induction. Viable cells were counted, pelleted, and resuspended in denaturing solution.
PBMCs were obtained after centrifugation over a Ficoll density gradient of 50 ml of whole blood from two healthy donors; cells were washed twice with RPMI 1640; the concentration was adjusted to be 106cells per ml of growth medium
supplemented with phytohemagglutinin (2mg/ml). Stimulation was carried out for 48 h; afterward, the medium was discarded, cells were washed three times with RPMI 1640, and the concentration was adjusted to 53105cells per ml of
medium supplemented with recombinant interleukin-2 (IL-2; 50 U/ml). Cells were incubated overnight in the presence of IL-2, the medium was then dis-carded, cells were washed and counted as described above, and 3.23107PBMCs
were infected in a final volume of 3.5 ml with HIV-1IIIBviral stock at a
multi-plicity of infection (MOI) of 25 genome molecules per cell. Adsorption was allowed for 2 h; then the cell-free virus was thoroughly washed out, and cells were counted, resuspended in growth medium containing IL-2 (50 U/ml) at a concen-tration of 53105cells per ml, and seeded (1 ml per well) in a 24-well culture
plate. Cells were harvested after 7, 24, and 33 h and at days 2, 3, 5, 7, and 12 p.i. Subculture was performed on day 3. Viable cells were counted at each harvest-ing, pelleted and aliquoted in duplicate, resuspended in denaturing solution, and frozen at2808C until RNA extraction was completed. Cell-free supernatants were also collected and immediately frozen at2808C.
For primary M/M cultures, PBMCs were plated in six-well plates (Falcon-Becton-Dickinson, Franklin Lakes, N.J.) at a density of 1.53107per well. After
5 days, nonadherent cells were removed by repeated gentle washing with RPMI 1640 medium at 378C as described elsewhere (68). M/M obtained with this procedure were then challenged with 10, 100, and 1,000 TCID50of HIVBaL,
corresponding to 0.1, 1, and 10 genome molecules per cell. After 2 h, the excess virus was carefully removed by repeated washings, and M/M were cultured in complete medium. The medium was replaced the day before cell harvesting (see below). At days 2, 3, 6, 8, and 14, M/M were washed twice with ice-cold phos-phate-buffered saline, detached from the wells by gentle scraping (no cells were still attached to the plastic surface after the detachment procedure), centrifuged, resuspended, counted twice, and centrifuged again. Pellets were resuspended in denaturing solution containing 4 M guanidinium isothiocyanate for RNA extrac-tion and stored at2808C. To minimize experimental variation, all RNA samples from the same donor were run together.
HIV-1-infected patients.Twenty-eight consecutive HIV-1-infected subjects (11 females and 17 males) were enrolled for this study at the Center of Immunology, University of Ancona (Ancona, Italy) on the basis of absence of any antiretro-viral treatment. According to Centers for Disease Control and Prevention (CDC) staging (11), 16 patients (5 females and 12 males) were in stage A1, 7 (4 females and 3 males) were in stage A2, 1 (female) was in stage A3, and 4 (one female and 3 males) were in stage B2. Thirteen subjects (3 females and 10 males) were intravenous drug users, 9 (7 females and 2 males) had heterosexual contacts with an HIV-1-infected partner, 5 were homosexuals, and 1 (female) had re-ceived blood transfusions. The mean age was 31.9 years (standard deviation, 4.3), with no significant difference among subjects at different CDC classes. The time since first laboratory diagnosis of HIV-1 infection averaged 5.2 years (minimum, 0.6; maximum, 10), with no significant difference among the CDC classes. Two patients in CDC class A1 had been recently infected (i.e., had recently serocon-verted, 7 to 9 months before enrollment, as demonstrated by routine serology). According to MACS parameters (78), four patients at CDC class A1 were LTNPs; the other 22 patients were bona fide considered typical progressors (46). A second blood sample was obtained from 10 of these patients after an average 13.4 months (8 CDC class A1, 1 A2, and 1 B2, 5 typical progressors, 3 LTNPs, and 2 recently infected at the time of enrollment).
Six patients treated with a combination of three specific anti-HIV-1 com-pounds (ritonavir, zidovudine [AZT], and zalcitabine [dideoxycytidine {ddC}]) at the Center of Immuno-Virology, Hoˆpital R. Poincare´ (Garches, France), were followed up for 6 months. Patients received ritonavir (600 mg twice daily) from day 1; AZT and ddC (600 and 2.5 mg daily, respectively) were administered with ritonavir starting from day 15. Samples (plasma and PBMCs) were collected at time zero, every 2 weeks during the first month, and subsequently every 4 weeks over a period of 6 months.
Nucleic acid purification.Total intracellular RNA and cell-free genomic RNA were extracted from pelleted cell cultures, peripheral lymphocytes from infected subjects, cell culture supernatants, and plasma samples. A single-step purification method was used for all samples as described elsewhere (4). RNA pellets were resuspended in diethylpyrocarbonate-treated water, and the volume was adjusted as follows: in the case of intracellular RNA, volume was adjusted to be equivalent to 23105cells per 10ml (clinical samples) or 105per 10ml (cell cultures); in the
on November 9, 2019 by guest
http://jvi.asm.org/
case of cell-free viral RNA, volume was adjusted to be equivalent to 100ml (plasma samples) or 1ml of cell culture supernatant per 10ml of RNA solution.
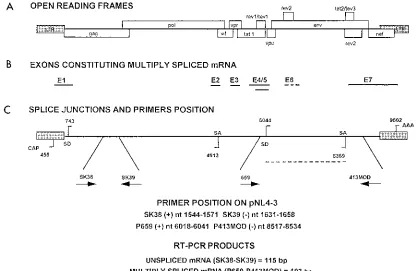
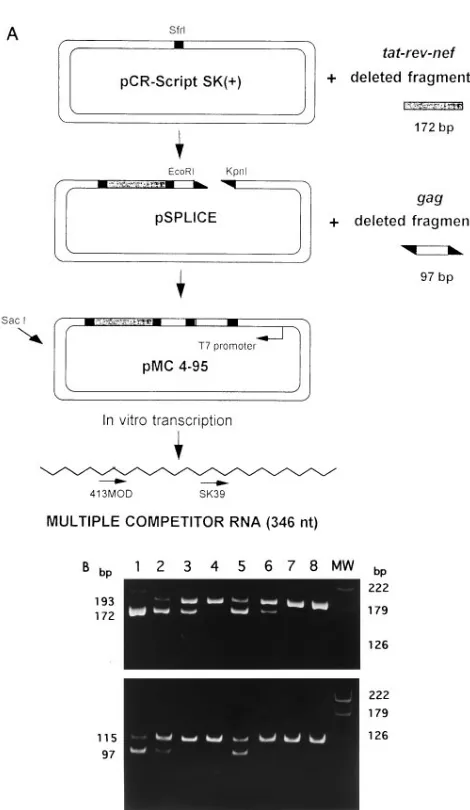
Cloning strategy for the multiple competitor.Sequences of two HIV-1 coding regions were selected for cRT-PCR, as shown in Fig. 1. A specific HIV-1 gag sequence encompassed by the SK38-SK39 primer pair was used to quantify US HIV-1 mRNAs, while a sequence encompassing the splice junction between exon 4/5 and exon 7, amplified by primer 659 (positions 6018 to 6041 on the pNL4-3 map) (1) and primer 413MOD (positions 8534 to 8517 on the pNL4-3 map), was chosen as representative of transcripts of tat, rev, and nef HIV-1 regulatory genes. These wild-type viral sequences were quantified by cRT-PCR using a competitor RNA bearing deleted sequences for both HIV-1 RNA species. The strategy for mutagenesis and cloning of recombinant multiple competitor, pMC, is summa-rized in Fig. 2A. Briefly, RNA purified from PBMCs of an infected patient was amplified by RT-PCR using primer 659 and the 413Dantisense primer (positions 8534 to 8479, including a 21-base deletion from positions 8509 to 8489), thus yielding a deleted version of the original sequence. This fragment (final size, 172 bp) was cloned in the pCR-Script plasmid vector (Stratagene, La Jolla, Calif.) 39 of the T7 RNA polymerase promoter, as demonstrated by sequence analysis of the cloning product, called p-SPLICE. The unspliced competitor fragment present in pSKAN (56) was amplified by using primers bearing a restriction site (SK39-EcoRI and SK38-KpnI). This product was cleaved with both restriction endonucleases and ligated into EcoRI-KpnI restriction sites of pSPLICE, 39of the T7 RNA polymerase promoter; the exact insertion of the two deleted frag-ments was checked by sequence analysis of the cloning product. Large amounts of this plasmid, called pMC, were purified on a cesium chloride gradient.
Synthesis and quantitation of competitor RNA molecules.One microgram of
SacI-cleaved pMC was transcribed in vitro, using the riboprobe system -T7
(Promega, Madison, Wis.) as recommended by the manufacturer except for time of transcription (4 h). The resulting RNA was suspended in diethylpyrocarbon-ate-treated water; aliquots were immediately frozen in dry ice and stored at 2808C. Gel electrophoresis and spectrophotometric analysis were carried out to determine the quality and concentration of competitor RNA; 6.53mg of RNA was obtained from 1mg of pMC.4.95. As shown in Fig. 2A, the competitor RNA (364 nucleotides) was reverse transcribed by using both SK39 and 413MOD antisense primers (cDNAs were amplified by using SK38-SK39 and 659-413MOD primer sets, respectively). The efficiencies of reverse transcription and PCR amplification were very similar for the two species. To control the efficacy of the DNase treatment performed after in vitro transcription, the multiple competitor RNA was checked for the presence of contaminating plasmid DNA
(calculated by endpoint dilution PCR amplification of RNA, with no reverse transcription), and no DNA molecule was amplified in 600,000 RNA molecules. Precise quantitation of competitor RNA copy numbers is of crucial impor-tance for cRT-PCR reliability, since inaccurate use of competitors constitutes a major source of errors in this reaction. Use of a single competitor RNA in the comparative quantitation of the two classes of viral messengers was instrumental, in this study, in facilitating the evaluation of competitor RNA concentration and integrity. This was achieved not only by spectrophotometric analysis and gel electrophoresis but also by Poisson distribution of positive RT-PCRs at the competitor RNA endpoint dilution. An additional control was carried out by challenging a fixed amount of competitor RNA against different concentrations of wild-type HIV-1 genomic RNA (from supernatant of infected H9 cells, pviously quantified by endpoint dilution and Poisson distribution of positive re-actions) in a cRT-PCR assay (data not shown). Once the exact concentration of competitor RNA was ascertained, a vial of the stock solution was diluted to contain about 0.53105molecules perml, and 10-ml aliquots were distributed in
separate siliconized vials, which were immediately stored at2808C. One vial was thawed whenever a cRT-PCR run was performed, and the competitor RNA concentration was adjusted as described below.
cRT-PCR amplification.Absolute quantitation of US and MS HIV-1 mRNAs was achieved by cRT-PCR amplification of wild-type RNA (total intracellular RNA from infected cells) and known amounts of pMC-derived competitor RNA. Quantitation of the two HIV-1 RNA species was performed in separate com-petitive reactions. US transcripts were assayed by using the SK38-SK39 primer pair, thus obtaining two amplicons corresponding to wild-type RNA (115 bp) and competitor RNA (97 bp). MS transcripts were assayed by using the 659-413MOD primer pair, the reaction products being 193 and 172 bp for wild-type and competitor sequences, respectively. For cRT-PCR, different concentrations of competitor RNA (ranging from 6,250 to 50 molecules in 2ml) and a constant amount of wild-type RNA (10ml per reaction tube) were distributed in two separate series of tubes together with 100 U of Moloney murine leukemia virus reverse transcriptase (Bethesda Research Laboratories, Gaithersburg, Md.), 25 pmol of antisense primer (SK39 or 413MOD), 500 nM each deoxynucleoside triphosphate, 20 U of RNase inhibitor (Boehringer), 1.5 mM MgCl2, 50 mM
[image:3.612.98.514.69.340.2]NaCl, and 10 mM Tris-HCl (pH 8.3) (final volume, 20ml). Afterward, cRT was performed at 378C for 15 min. After denaturation at 948C (3 min), 30ml of 13 PCR buffer containing 2.5 U of Taq DNA polymerase and 25 pmol of sense primer (SK38 or 659) were added. The amplification profile was the same for the two PCRs (15 s at 948C; 15 s at 608C; 60 s at 728C) and was repeated for 50 cycles. FIG. 1. HIV-1 sequences selected for analysis of virus transcription by cRT-PCR. (A) Organization of the HIV-1 genome (open boxes show locations of the open reading frames coding for HIV-1 proteins). LTR, long terminal repeat. (B) HIV-1 exons observed in multiply spliced viral mRNA (exons E1, E2, and E3 are noncoding). (C) Locations of major splice donors (SD; D1 and D4) and acceptors (SA; A2 and A7) in the pNL4-3 proviral molecular clone (positions in pNL4-3 and orientations of primers are indicated by arrows). The sizes of wild-type cRT-PCR products are given in base pairs.
on November 9, 2019 by guest
http://jvi.asm.org/
The reactions for US and MS transcripts were carried out in parallel in the same thermal cycler (GeneAmp PCR System 9600; Perkin-Elmer), to avoid different processing of wild-type and competitor RNA. After PCR, 5ml of amplification products was loaded on 10% polyacrylamide minigel, and electrophoresis was carried out at 190 V for 45 min for US products (to separate the 115-bp wild-type
fragment from the 97-bp competitor template) or for 60 min for MS products (to separate the 193-bp wild-type sequence and the 172-bp competitor-derived frag-ment) (Fig. 2B). Competitive analysis was performed as described previously (56).
Other methods.Proviral HIV-1 DNA was quantified in PBMCs of patients under treatment with specific antiretroviral compounds by using cPCR as de-scribed elsewhere (4, 7, 56). HIV-1 p24 antigen was assayed in cell cultures supernatants by using a commercially available enzyme immunoassay (Du Pont de Nemours, Wilmington, Del.) as instructed by the manufacturer. CD41T-cell counts were carried out by using flow cytometry and commercial reagents from Ortho Diagnostic Systems Inc. (Raritan, N.J.). Primers used in this study were synthesized in our laboratory, using solid-phase phosphoramidite chemistry in a DNAsm oligonucleotide synthesizer (Beckman).
Statistical analysis.Because of the asymmetric distribution of data, nonpara-metric statistical methods were used. The Kruskal-Wallis test was used for comparison of the levels of molecular indexes of viral activity and CDC staging. The Mann-Whitney test was used for comparison of and statistical inference between LTNPs and typical progressors. Finally, the relative strength of corre-lation between CD41counts and levels of molecular parameters was evaluated by Spearman analysis.
RESULTS
In vitro studies.
The dynamics of specific HIV-1 mRNAs
was analyzed during acute infection of A3.01 cells and primary
PBMCs infected with HIV-1
IIIBand of M/M infected with
HIV-1
BaL. Figure 3 shows the temporal features of HIV-1
mRNA synthesis after A3.01 infection with HIV-1
IIIBat
dif-ferent MOIs. MS messengers were detectable 7 h p.i. at MOIs
of 100 and 1,000 (364 and 2,608 viral genome molecules per
10
5cells, respectively). Both MS and US mRNAs increased
exponentially at days 1 to 3 (r
2.
0.98) in all curves, the latter
being constantly higher (about 1 log unit) at virtually all points.
US transcripts reached plateau phase in 21 (at an MOI of 1
HIV-1 genome per cell), 14 (MOI, 10 and 100), and 3 days
(MOI, 1,000), their highest levels of production (10
8to 10
9molecules per 10
5cells) being similar in all curves regardless of
the MOI. A slight decline in viral transcripts of both classes
was detected at days 21 (MOI, 1,000), 35 (MOI, 100), and 42
(MOIs, 1 and 10). The release of cell-free virus paralleled the
transcript dynamics, a plateau being detected between days 21
and 28 in all curves (data not shown). The genome molecule/
HIV-1 p24 antigen ratio was virtually stable at all MOIs values
(data not shown). In this experiment, 1 ng of HIV-1 p24
anti-gen corresponded on average to 10
7viral genome molecules, in
line with previous data (53).
Figure 4A shows the kinetics of HIV-1 mRNAs in primary
PBMCs infected with HIV-1
IIIBat an MOI of 25 HIV-1
ge-nomes per cell. CD4
1T cells were 51% of the total population
at time zero and fell to 35% at day 7 p.i. As in A3.01 infection,
MS transcripts were undetectable 7 h p.i., and as in A3.01
infection, the dynamics of both species followed an exponential
trend of accumulation from day 1 to 4 (r
2.
0.99). It was
interesting that in this early phase, the curve of viral transcripts
in primary PBMCs perfectly paralleled the dynamics of
mRNAs in A3.01 cells at an MOI of 10, the MS/US ratios also
being very similar (0.022 and 0.036 in PBMCs and A3.01 cells,
respectively). After day 4, this ratio decreased as US mRNAs
remained stable at the plateau level and MS transcripts
de-clined to 2.5 log units below that level.
Figure 4B shows the temporal features of viral transcription
during acute infection of M/M with different concentrations
(0.1, 1, and 10 HIV-1 genome molecules per cell) of HIV-1
BaL.
A difference among the different MOIs could be appreciated
only at day 2 for both MS and US mRNAs, the remaining part
of the curves being virtually identical at the different MOIs,
thus diverging significantly from curves of A3.01 infection (in
the latter case, we observed that the kinetics of molecular
determinants, but not their maximum level, is MOI dependent
[Fig. 3]). Interestingly, the temporal dynamics of M/M
infec-FIG. 2. (A) Cloning strategy for plasmid pMC and synthesis of competitor RNA. An MS fragment was internally deleted by RT-PCR mutagenesis (see Materials and Methods) and inserted into the SrfI site of pCR-Script. Upon transformation of Epicurian Coli XL1-blue MRF9Kan supercompetent cells, bacteria from one colony were selected and grown to recover plasmid pSPLICE. The 97-bp deleted fragment present in the previously described pSKAN (56) was amplified with primers SK38-SK39 bearing EcoRI and KpnI, respectively, at 59 ends. The products obtained and the plasmid pSPLICE were digested with these enzymes, recovered from the agarose gel, and ligated together. Upon transfor-mation of supercompetent cells, bacteria from one colony were grown and large amounts of plasmid pMC 4-95 were recovered on a CsCl gradient. An aliquot of the plasmid was cleaved at the SacI site and transcribed in vitro by using T7 RNA polymerase. (B) Quantitation of specific HIV-1 MS (top) and US (bottom) mRNAs by cRT-PCR. Acutely infected (with HIV-1IIIB) A3.01 cells were
ana-lyzed at days 1 (lanes 1 to 4) and 2 (lanes 5 to 8) p.i. Four different fivefold dilutions of pMC-derived competitor RNA (from 6,250 to 50 molecules; lanes 1 to 4 and 5 to 8) were challenged with a constant amount of intracellular RNA equivalent to 105cells. One-tenth of the amplified products was loaded on 10%
polyacrylamide gel and analyzed with a videodensitometer after ethidium bro-mide staining. The amplified wild-type sequences are observed as the upper 193-bp (MS) and 115-bp (US) bands. The deleted competitor fragments (ob-tained by using a single competitor RNA) are observed as the lower 172- and 97-bp bands originated by the different primer sets for MS and US sequences, respectively. Lane MW, molecular weight markers.
on November 9, 2019 by guest
http://jvi.asm.org/
[image:4.612.60.295.59.464.2]tion exhibited a linear increase in viral transcripts of both
classes (r
25
0.81 to 0.94), thus diverging from A3.01 and
PBMC infections with HIV-1
IIIB. Indeed, PBMCs infected
with 25 copies of HIV-1
IIIBRNA per cell reached a maximum
accumulation of US and MS transcripts at day 4 p.i. (Fig. 4A),
highly comparable to the level observed in M/M infection (0.1,
1.0, and 10 HIV-1
BaLRNA copies per cell) at day 14 regardless
of the MOI.
Chronically infected ACH-2 cells were induced with 10 nM
PMA (Fig. 5). In this experiment, a rapid (but transient) shift
of the MS/US ratio peaked 5 h postinduction, when MS
mRNAs were 37-fold higher than at time zero (doubling time,
58 min). US mRNAs increased exponentially, reaching 24 h
postinduction a level 3,053-fold higher than that determined at
basal time (doubling time, 137 min).
[image:5.612.139.479.72.391.2]In vivo studies.
Quantitation of cell-free HIV-1 genome
FIG. 3. Transcriptional profile of A3.01 cells infected with HIV-1IIIB. A3.01 cells were infected with MOIs (evaluated as viral genome copy numbers) of 1 (A), 10
(B), 100 (C), and 1,000 (D). Dynamics of specific HIV-1 MS (E) and US (F) transcripts was monitored for 6 weeks p.i.
FIG. 4. (A) Acute infection of primary PBMCs with HIV-1IIIB.
Phytohem-agglutinin-stimulated PBMCs from two healthy donors were treated overnight with 50 U/ml of recombinant IL-2 and infected with HIV-1IIIBat an MOI of 25
genome molecules per cell. After infection, cells were grown in the presence of recombinant IL-2 (50 U/ml)-supplemented medium. Symbols represent MS (E) and US (F) viral transcripts. (B) Acute infection of M/M with different concen-trations of HIV-1BaL. Primary M/M were infected with HIV-1BaLvirus stock at
[image:5.612.61.297.533.651.2]MOIs of 0.1 (F), 1 (■), and 10 (å). Dynamics of specific HIV-1 MS (open symbols) and US (solid symbols) mRNAs are shown starting from day 2 p.i.
FIG. 5. Modulation of the HIV-1 transcription pattern after induction of ACH-2 cells with PMA (10 nM). The dynamics of MS (open circle) and US (solid circle) mRNAs are shown. The increment of US transcripts followed an expo-nential trend (y53,261ze0.303x; r250.999).
on November 9, 2019 by guest
http://jvi.asm.org/
[image:5.612.375.496.575.692.2]copy numbers in plasma (HIV-1 viremia) and of US and MS
transcripts in PBMCs was performed in samples from 28
un-treated HIV-1-infected patients. The results, graphically
sum-marized in Fig. 6, show that molecular parameters of viral
activity are related to each other and with CD4
1cell counts.
All patients tested positive for cell-free HIV-1 genomic RNA
and intracellular US viral messengers, while MS transcripts
were undetectable in PBMCs of 5 of 28 patients (four of the
five in class A1). In line with a previous report by us (3), there
was a high degree of correlation (scatter plots are shown in Fig.
6) both when molecular indexes were compared with each
other and when they were compared with CD4
1T-cell counts
(P value invariably lower than 0.02, using Spearman
correla-tion analysis). In contrast, there was no correlacorrela-tion between
the MS/US ratio and either CD4
1cell counts (Fig. 6D) or any
molecular index of viral activity (data not shown). When
eval-uated on the basis of CDC classification, levels of the
molec-ular parameters under study followed the CDC staging but did
not diverge significantly in the 28 patients, as determined by
the Kruskal-Wallis nonparametric test. HIV-1 viremia ranged
from 133 to 97,103 molecules per ml (median, 2,837) for 16
CDC A1 patients, from 1,548 to 115,901 (median, 6,939) for 7
CDC A2 patients, and from 2,213 to 134,901 (median, 51,969)
for 4 CDC B2 patients; similarly, median values of US and MS
mRNAs increased with CDC staging, being 29 and 20
mole-cules per 2
3
10
5PBMCs in CDC class A1 patients, 101 and 82
molecules in CDC class A2 patients, and 534 and 408
mole-cules in CDC B2 patients. All of the four LTNP subjects
evidenced low and stable levels of viremia and US transcripts;
likewise, MS mRNAs tested either negative or at the lowest
levels. Similarly, levels of both classes of messengers were low
or undetectable in two recently infected patients.
Ten of our 28 patients (5 typical progressors, 3 LTNPs, and
2 recently infected subjects) were followed up from 12 to 14
months after the first sampling. The results of this longitudinal
analysis are reported in Table 1. A general loss of CD4
1T cells
was observed in all but one (patient 4) of the typical
progres-sors, the mean loss being 6.1 cells per month; nonetheless, all
patients remained asymptomatic. Two patients (2 and 3)
un-derwent an immunological progression, as revealed by CD4
1T-cell counts, and had moved from CDC class A1 to A2. In
patient 2, a decrease of all molecular indices (compared with
the high levels at the first sampling) paralleled the loss of 179
CD4
1T cells per
m
l of blood (mean variation per month,
FIG. 6. Molecular determinants of HIV-1 activity in 28 untreated patients. Levels of MS and US HIV-1 mRNAs and cell-free genome copy numbers are related to each other and to CD41T-cell counts. The lines superimposed are derived by nonlinear exponential regression analysis of the data. The correlation coefficient (R) is shown in each panel.
on November 9, 2019 by guest
http://jvi.asm.org/
2
12.8). In patient 3, the negligible decline of CD4
1T-cell
count coincided only with a slight variation in plasma viremia.
Finally, patient 5 (CDC class B2) lost 114 CD4
1T cells per
m
l
(mean variation per month,
2
9.5); in this case, the dynamics of
cell-free virus in plasma and US transcripts in PBMCs
paral-leled infection progression (mean variation per month,
1
2,487
HIV-1 genome copy numbers and
1
45 viral RNA molecules
per 2
3
10
5PBMCs, respectively), while MS transcripts had
remained at a virtually high and stable level after 12 months.
Six patients were monitored during treatment with a
com-bination of three specific antiretroviral compounds, ritonavir
(a protease inhibitor) and the nucleoside analogs AZT and
ddC (Table 2). Patients who received ritonavir from day 1 and
also AZT and ddC from day 15 were studied at time zero and
every 2 weeks during treatment. In these cases, a dramatic
exponential decrease of HIV-1 viremia and a decline of US
mRNAs in PBMCs were documented during the first few
weeks of treatment. Notably, MS messengers fell to
undetect-able levels in all patients within 2 to 12 weeks, paralleling the
decrease of cell-free virus. Although a slight drop was observed
during the therapy, detectable amounts of HIV-1 provirus copy
numbers were observed in all patients at any point in time,
indicating that although viremia is at very low levels, these
patients harbor great quantities of transcriptionally inhert
HIV-1 DNA.
DISCUSSION
A specific PCR-based strategy was used in this study to
analyze the qualitative and quantitative temporal features of
HIV-1 expression in vitro and to address the question of the
correlation of a particular dynamic pattern of HIV-1 mRNAs
in PBMCs with viral load, response to antiretroviral
com-pounds, and T-cell decline. This quantitative method (using a
competitor RNA bearing deleted sequences for both gag and
tat-rev-nef viral mRNAs in tandem) differs substantially from
those used in other approaches to this analysis, including (i)
competitive PCR amplification, after reverse transcription of
wild-type viral mRNAs, using a DNA, not RNA, competitor,
(ii) cRT-PCR using different competitors for US and MS viral
transcripts, and (iii) quantitative PCR-based analysis using an
external standard reference curve (36, 57, 72). Indeed, the use
of a single competitor RNA to quantify different wild-type
sequences offers both a theoretical (being consistent with the
general concept of cRT-PCR) (14, 16) and a practical (since
both wild-type RNA species are challenged against identical
amounts of competitor RNA) advantage over any other
mo-lecular approach used in comparative quantitative studies.
[image:7.612.59.556.82.319.2]The dynamic pattern of HIV-1 transcription was analyzed in
different cell culture models. After induction of chronically
infected ACH-2 T cells, a brief modulation process specific to
MS transcripts was detected. While these data confirm the
well-known general features of HIV-1 activation in these cells,
the results (i) describe a temporal profile for viral transcripts
quite different from that observed in studies using other
mo-lecular methods and (ii) show that after induction, HIV-1
expression reaches levels significantly higher than previously
reported. Indeed, earlier work documented a fivefold
induc-tion of HIV-1 producinduc-tion by analysis of viral specific reverse
transcriptase and p24 protein levels (20, 24, 33). Subsequent
molecular analysis (by Northern [RNA] blotting or
semiquan-titative RT-PCR) (58) found an increase in virion assembly
correlated with an enhanced (about 25-fold) level of US
tran-scripts. The data shown here document that a sharp increase in
MS transcripts is detectable during the first 5 h after induction
(with a doubling time of 58 min), while a gradual and
expo-nential increase in US mRNAs reaches a level 3,053-fold
higher than the basal level at 24 h. By contrast, analysis of
HIV-1 transcription in acutely infected cells (PBMCs,
T-de-rived cell lines, and M/M) failed to detect an early and a late
phase of HIV-1 RNA expression under our experimental
con-ditions. During acute infection, the relative US/MS ratio
re-mained virtually constant, and the transcriptional pattern
as-sociated with the transition from acute to chronic infection did
not change. The differential results between acutely and
per-sistently infected cells may be due to the heterogeneity of
PBMC and A3.01 cell populations with respect to time of
TABLE 1. Follow-up analysis of untreated patients
Patient no. Follow-up time (mo)
CD41T cells
HIV-1 genomes/ml of plasma
US mRNA/23105
PBMCs
MS mRNA/23105
PBMCs
MS/US ratio
Typical progressors
1
0
673
57,619
1,018
200
0.20
13
560
1,718
39
66
1.69
2
0
558
63,582
1,284
684
0.53
14
379
32,359
373
72
0.19
3
0
505
412
8
0
0.00
14
451
885
8
0
0.00
4
0
343
3,131
13
82
6.31
13
399
10,887
11
7
0.64
5
0
385
77,766
729
184
0.25
12
271
107,607
1,273
175
0.14
LTNP
6
0
770
9,677
19
8
0.42
14
744
416
19
6
0.32
7
0
628
184
4
8
2.00
13
572
180
0
0
0.00
8
0
604
3,274
44
0
0.00
13
795
800
29
0
0.00
Recently infected
9
0
607
1,900
23
28
1.22
14
585
60
2
0
0.00
10
0
409
14,200
73
0
0.00
14
533
2,185
22
0
0.00
on November 9, 2019 by guest
http://jvi.asm.org/
infection, which hampered the detection of a very short-lived
phenomenon; otherwise, ACH-2 cells could be restrictive to
Rev function (so that a high MS transcript level is necessary
before US mRNA expression can start), while PBMCs and
A3.01 cells are not restrictive, and US and MS messengers
increase at equivalent rates. An exponential accumulation of
both classes of viral transcripts was documented in the early
phase of HIV-1 acute infection (days 1 to 3), while a slight
decline in US and MS mRNAs was observed at 21 to 42 days,
depending on the MOI (Fig. 3). These data suggest that a
proportion of A3.01 cells become chronically infected in
cul-ture, and consequently viral transcriptional activity undergoes
an overall decrease. Analysis of cell culture doubling time (not
shown) corroborates this observation, since after an
MOI-dependent early increase in doubling times (probably due to a
high rate of cell death), cell replication rates improved in all
cultures: after 42 days, growth kinetics of all infected cultures
were very similar and comparable with that of uninfected cells.
During infection of primary PBMCs, a considerable difference
between MS and US messengers was documented after day
4 p.i.; at the end of the exponential trend (Fig. 4A), US
mRNAs remained in these cells at a plateau level (and were up
to 400 times more abundant than MS mRNAs), while levels of
MS transcripts decreased. These data suggest that after HIV-1
infection of a heterogeneous cell population, MS copy
num-bers are more influenced by the number of newly infected cells
than US transcript copy numbers.
Certain HIV-1 isolates are able to infect and replicate in
nondividing cells of the M/M lineage; integration of HIV-1
provirus seems to be a step essential for productive infection of
primary human macrophage cultures (23). Interestingly, in
pri-mary M/M infected with HIV
BaL, the expression pattern of
viral genes had characteristics similar to those of A3.01 cells
infected with HIV-1
IIIB, even though a linear (and not
[image:8.612.61.556.84.463.2]expo-nential, as in T lymphocytes) accumulation of viral transcripts
was observed in M/M; these results are in line with the peculiar
kinetics of M/M infection (slow and progressive) (68).
None-theless, these results document that highly efficient HIV-1
transcription is possible in M/M cells, in agreement with the
mounting evidence that these cells perform a central role in the
pathogenesis of HIV-1 infection (25, 40). Our data also
indi-cate that reliable methods for studying the dynamics of viral
transcription in vitro may be instrumental in understanding the
differential ability of HIV-1 strains to replicate in tissue
mac-rophages and its consequences in disease development and
efficacy of antiviral therapies.
TABLE 2. Follow-up analysis of drug-treated
apatients
Patient no.
Follow-up time (wk)
CD41T cells
HIV-1 genomes/ml of plasma
US mRNA/23105
PBMCs
MS mRNA/23105
PBMCs
Provirus particles/ 23105PBMCs
101
0
73
176,620
19
8
140
2
259
3,638
15
2
94
8
514
47
10
1
98
16
377
10
0
0
22
24
323
0
0
0
4
36
0
0
0
18
105
0
120
437,830
868
6
186
2
198
5,851
179
6
94
4
188
793
146
4
114
12
173
18
13
0
54
20
214
10
18
0
58
31
0
4
0
44
36
0
3
0
54
108
0
180
1,134,885
1,208
361
462
2
186
1,533
155
4
518
4
223
548
149
5
372
12
166
463
80
0
252
20
192
29
45
1
226
206
0
252
25,000
10
4
46
2
277
34
4
0
44
4
323
0
2
0
14
8
270
0
7
0
20
16
358
0
9
0
10
24
333
0
4
0
24
32
0
4
0
14
505
0
48
32,747
506
3
522
2
66
1,360
153
0
490
4
79
394
146
0
472
12
140
10
53
0
290
20
117
18
28
0
192
28
10
10
0
208
36
0
33
0
140
602
0
281
411,636
359
2
668
2
326
181
230
0
548
4
384
1,603
88
0
350
12
392
77
42
0
296
20
359
10
14
0
166
28
0
6
0
318
36
0
24
0
250
aSee Materials and Methods.
on November 9, 2019 by guest
http://jvi.asm.org/
Infection with HIV-1 can lead to different patterns of
dis-ease progression, namely, rapid progression, typical
progres-sion, and long-term nonprogression (46). The high degree of
variability in the rates of disease progression is not clearly
understood, and it has been suggested that both efficiency of
the host immune response and viral phenotypic and genotypic
features can variably contribute to the clinical progression of
HIV-1 disease. In the last few years, several independent
re-ports have indicated that during the variably long, clinically
latent phase that characterizes HIV-1 infection, the turnover
of cell-free virus and infected cells is much higher than
previ-ously believed (47, 67, 81). There is general consensus on the
correlation of clinical progression with increasing levels of
HIV-1 activity, as reflected by increased mean values of
bio-logical and molecular determinants of viral expression and
replication (7, 36, 57). By contrast, viral load is low and stable
in LTNP patients (46, 65). Whether the relevant clinical
fea-tures of LTNP patients are a reflection of a more efficient
immune response or the consequence of infection with less
pathogenic (or nonpathogenic) HIV-1 strains is an important
matter for debate. A recent longitudinal study of HIV-1
vire-mia in samples from progressor patients concluded that this
index of systemic viral activity is a more reliable predictor of
progression to AIDS than is the number of CD4
1T cells (55).
In this study, the pattern of viral transcripts was also assayed
in PBMCs from infected subjects with different degrees of
CD4
1T-cell depletion and from patients undergoing antiviral
therapy. In a cross-sectional study of 28 asymptomatic patients,
we documented a significant direct correlation between the
levels of MS and US transcripts (P
5
0.0011) and an inverse
correlation between both parameters and CD4
1T-cell counts;
interestingly, cell-free HIV-1 genome copy numbers were
cor-related not only with US mRNAs (P
5
0.0001) but also with
MS mRNAs (P
5
0.0198) (Fig. 6E to G). In contrast, no
correlation was observed between MS/US ratios and CD4
counts (Fig. 6D). Moreover, sharp differences in both US and
MS HIV-1 transcript levels between 4 LTNP and 22 typical
progressor patients (Mann-Whitney analysis; P
5
0.023 and
0.039, respectively) emerged in the cross-sectional study. In
our short-term longitudinal study, signs of immunological
pro-gression could be observed in four of the five asymptomatic
patients who showed different patterns of HIV-1 expression in
PBMCs (Table 1). High levels of systemic viral activity
(paral-leled by a substantial drop of CD4
1T cells) were observed in
two of the five progressors (patients 2 and 5), while cell-free
viremia and intracellular transcripts displayed a different
dy-namics.
During the early phase of treatment with an association of
three antiretroviral compounds, we documented that MS
tran-scripts drop to undetectable levels within a few weeks and
parallel the dramatic fall of US messengers and cell-free virus
(Table 2). Notably, the data indicate that while the antiviral
treatment is highly efficient in reducing cell-free virus and viral
transcripts in PBMCs, provirus copy numbers do not diminish
much during the therapy; this finding suggests that proviral
HIV-1 DNA should have been cleared by the host’s
mecha-nism which is normally responsible for the CD4 cell turnover
during HIV-1 infection.
As recently observed, the viral decay observed in patients
treated with protease inhibitors is a composite of different
effects, including clearance of cell-free virions and decrease of
virus-producing cells (47, 81). After a potent protease inhibitor
is administered, infection of new cells by previously produced
infectious virus may occur for a few days (until infectious
virions produced before therapy are completely cleared); this is
consistent with the delay in antiviral effect documented by
close measurements of viral load during therapy (67). In this
context, the kinetics of molecular indexes in patient 108
de-serve attention; in this case, the calculated half-lives of US and
MS mRNAs and cell-free virus in plasma were 9.1, 4.27, and
2.94 days, respectively. The rapid drop of MS transcripts is very
consistent with the estimated life span (2.2 days) of
produc-tively infected cells, thus suggesting that this index is closely
associated with the presence of newly infected cells. This
as-sociation is perfectly in line with the results from in vitro
experiments shown here (in particular, with acute infection of
primary PBMCs) and suggests a new interpretation of the
direct analysis of HIV-1 transcription carried out in vivo,
point-ing to a reliable evaluation of virus-host relationship and
indi-cating that only individual follow-up may supply relevant
in-formation of changes in virus activity in untreated and treated
patients.
ACKNOWLEDGMENTS
This study was supported in part by grants from the Italian Istituto
Superiore di Sanita
` (ISS), 9
8
Progetto AIDS. R.S. is recipient of an ISS
(Progetto AIDS) fellowship.
REFERENCES
1. Adachi, A., H. E. Gendelman, S. Koenig, T. Folks, R. Willey, A. Rabson, and
M. A. Martin.1986. Production of acquired immunodeficiency-associated retrovirus in human and nonhuman cells transfected with an infectious molecular clone. J. Virol. 59:284–291.
2. Arya, S. K., C. Guo, S. F. Josephs, and F. Wong-Staal. 1985. Trans-activator gene of human T-lymphotropic virus type III (HTLV-III). Science 229:69– 73.
3. Bagnarelli, P., D. Mathez, D. Paul, C. Katlama, P. de Truchis, A. Valenza,
M. Clementi, and J. Leibowitch.1996. Dynamics and compartmentalization of HIV-1 biotypes in vivo. AIDS Sci. 1:81–90.
4. Bagnarelli, P., S. Menzo, A. Manzin, M. Giacca, P. E. Varaldo, and M.
Clementi.1991. Detection of human immunodeficiency virus type 1 genomic RNA in plasma samples by reverse transcription polymerase chain reaction. J. Med. Virol. 34:89–95.
5. Bagnarelli, P., S. Menzo, A. Valenza, A. Manzin, M. Giacca, F. Ancarani, G.
Scalise, P. E. Varaldo, and M. Clementi.1992. Molecular profile of human immunodeficiency virus type 1 infection in symptomless patients and in patients with AIDS. J. Virol. 66:7328–7335.
6. Bagnarelli, P., S. Menzo, A. Valenza, S. Paolucci, S. Petroni, G. Scalise, R.
Sampaolesi, A. Manzin, P. E. Varaldo, and M. Clementi.1995. Quantitative molecular monitoring of human immunodeficiency virus type 1 activity dur-ing therapy with specific antiretroviral compounds. J. Clin. Microbiol. 33: 16–23.
7. Bagnarelli, P., A. Valenza, S. Menzo, A. Manzin, G. Scalise, P. E. Varaldo,
and M. Clementi.1994. Dynamics of molecular parameters of human im-munodeficiency virus type 1 activity in vivo. J. Virol. 68:2495–2502. 8. Baumberger, C., S. Kinloch-de-Loes, S. Yerly, B. Hirschel, and L. Perrin.
1993. High levels of circulating RNA in patients with symptomatic HIV-1 infection. AIDS 7(Suppl. 2):S59–S64.
9. Bruggeman, L. A., M. M. Thomson, P. J. Nelson, J. B. Kopp, J. Rappaport,
P. E. Klotman, and M. E. Klotman.1994. Patterns of HIV-1 mRNA expres-sion in transgenic mice are tissue-dependent. Virology 202:940–948. 10. Butera, S. T., B. D. Roberts, L. Lam, T. Hodge, and T. M. Folks. 1994.
Human immunodeficiency virus type 1 RNA expression by four chronically infected cell lines indicates multiple mechanisms of latency. J. Virol. 68: 2726–2730.
11. Centers for Disease Control and Prevention. 1993. Revised classification system for HIV infection and expanded surveillance case definition for AIDS among adolescents and adults. Morbid. Mortal. Weekly Rep. 41:1–19. 12. Chang, D. D., and P. A. Sharp. 1990. Messenger RNA transport and HIV rev
regulation. Science 249:614–615.
13. Chen, Z. W., Z. C. Kou, L. Shen, J. D. Regan, C. I. Lord, M. Halloran, D.
Lee-Parritz, P. N. Fultz, and N. L. Letvin.1994. An acutely lethal simian immunodeficiency virus stimulates expansion of V beta 7- and V beta 14-expressing T lymphocytes. Proc. Natl. Acad. Sci. USA 91:7501–7505. 14. Clementi, M., P. Bagnarelli, S. Menzo, A. Valenza, A. Manzin, and P. E.
Varaldo.1993. Clearance of HIV-1 viremia after seroconversion. Lancet
341:315–316.
15. Clementi, M., A. Manzin, P. Bagnarelli, S. Menzo, P. E. Varaldo, and G.
Carloni.1992. Human immunodeficiency virus type 1 and hepatitis B virus transcription in peripheral blood lymphocytes from co-infected subjects. Arch. Virol. 126:1–9.
16. Clementi, M., S. Menzo, P. Bagnarelli, A. Valenza, S. Paolucci, R.
on November 9, 2019 by guest
http://jvi.asm.org/
olesi, A. Manzin, and P. E. Varaldo.1996. Clinical use of quantitative molecular methods in studying human immunodeficiency virus type 1 infec-tion. Clin. Microbiol. Rev. 9:135–147.
17. Clements, J. E., R. J. Wall, O. Narayan, D. Hauer, R. Schoborg, D. Sheffer,
A. Powell, L. M. Carruth, M. C. Zink, and C. E. Rexroad.1994. Development of transgenic sheep that express the visna virus envelope gene. Virology
200:370–380.
18. Clements, J. E., and F. Wong-Staal. 1992. Molecular biology of lentiviruses. Semin. Virol. 3:137–146.
19. Clements, J. E., and M. C. Zink. 1996. Molecular biology and pathogenesis of animal lentivirus infections. Clin. Microbiol. Rev. 9:100–117.
20. Clouse, K. A., D. Powell, I. Washington, G. Poli, K. Strebel, W. Farrar, P.
Barstad, J. Kovacs, A. S. Fauci, and T. M. Folks.1989. Monokine regulation of human immunodeficiency virus-1 expression in a chronically infected human T-cell clone. J. Immunol. 142:431–438.
21. Coffin, J. M. 1995. HIV population dynamics in vivo: implication for genetic variations, pathogenesis, and therapy. Science 267:483–489.
22. Cullen, B. R., and W. C. Greene. 1989. Regulatory pathways governing HIV-1 replication. Cell 58:423–426.
23. Englund, G., T. S. Theodore, E. O. Freed, A. Engelman, and M. A. Martin. 1995. Integration is required for productive infection of monocyte-derived macrophages by human immunodeficiency virus type 1. J. Virol. 69:3216– 3219.
24. Ensoli, B., P. Lusso, F. Schacter, S. F. Josephs, J. Rappaport, F. Negro, R. C.
Gallo, and F. Wong-Staal.1989. Human herpesvirus-6 increases HIV-1 ex-pression in co-infected T cells via nuclear factors binding to the HIV-1 enhancer. EMBO J. 8:3019–3027.
25. Ensoli, F., A. Cafaro, V. Fiorelli, B. Vannelli, B. Ensoli, and C. J. Thiele. 1995. HIV-1 infection in primary human neuroblasts. Virology 210:221–225. 26. Fauci, A. S. 1993. New concepts in the immunopathogenesis of HIV
infec-tion. N. Engl. J. Med. 328:327–335.
27. Feinberg, M. B., D. Baltimore, and A. D. Frankel. 1991. The role of Tat in the human immunodeficiency virus life cycle indicates a primary effect on transcriptional elongation. Proc. Natl. Acad. Sci. USA 88:4045–4049. 28. Feinberg, M. B., R. F. Jarret, A. Aldovini, R. C. Gallo, and F. Wong-Staal.
1986. HTLV-III expression and production involve complex regulation at the levels of splicing and translation of viral RNA. Cell 46:807–817.
29. Felber, B. K., C. M. Hadzopoulou, C. Cladaras, T. Copeland, and G. N.
Pavlakis.1989. Rev protein of human immunodeficiency virus type 1 affects the stability and transport of the viral mRNA. Proc. Natl. Acad. Sci. USA
86:1495–1499.
30. Fisher, U., S. Meyer, M. Teufel, C. Heckel, R. Luhrmann, and G. Rautmann. 1994. Evidence that HIV-1 Rev directly promotes the nuclear export of unspliced RNA. EMBO J. 13:4105–4112.
31. Folks, T. M., S. Benn, A. Rabson, T. Theodore, M. D. Hoggan, M. Martin, M.
Lightfoote, and K. Sell.1985. Characterization of a continuous T-cell line susceptible to the cytopathic effect of the acquired immunodeficiency syn-drome (AIDS) associated retrovirus. Proc. Natl. Acad. Sci. USA 82:4539– 4543.
32. Folks, T. M., K. A. Clouse, J. Justement, A. Rabson, E. Duh, J. H. Kehrl, and
A. S. Fauci.1989. Tumor necrosis factor alpha induces expression of human immunodeficiency virus in a chronically infected T-cell clone. Proc. Natl. Acad. Sci. USA 86:2365–2368.
33. Folks, T. M., J. Justement, A. Kinter, S. Schnittmann, J. Orenstein, G. Poli,
and A. S. Fauci.1988. Characterization of a promonocyte clone chronically infected with HIV and inducible by 13-phorbol-12-myristate acetate. J. Im-munol. 140:1117–1122.
34. Fultz, P. N. 1994. SIVsmmPBj14: an atypical lentivirus. Curr. Top. Micro-biol. Immunol. 188:65–76.
35. Fultz, P. N., and P. M. Zack. 1994. Unique lentivirus-host interactions: SIVsmmPBj14 infection of macaques. Virus Res. 32:205–225.
36. Furtado, M. R., L. A. Kingsley, and S. M. Wolinsky. 1995. Changes in the viral mRNA expression pattern correlate with a rapid rate of CD41T-cell number decline in human immunodeficiency virus type 1-infected individu-als. J. Virol. 69:2092–2100.
37. Furtado, M. R., R. Murphy, and S. M. Wolinsky. 1993. Quantitation of human immunodeficiency virus type 1 tat mRNA as a marker for assessing the efficacy of anti-retroviral therapy. J. Infect. Dis. 167:213–216. 38. Gallo, R. C. 1995. Human retroviruses in the second decade: a personal
perspective. Nat. Med. 1:753–759.
39. Gaynor, R. 1992. Cellular transcription factors involved in the regulation of HIV-1 gene expression. AIDS 6:347–363.
40. Gilles, P. N., J. L. Lathey, and S. A. Spector. 1995. Replication of macroph-age-tropic and T-cell-tropic strains of human immunodeficiency virus type 1 is augmented by macrophage-endothelial cell contact. J. Virol. 69:2133– 2139.
41. Gonda, M. A. 1994. Molecular biology and virus-host interactions of lenti-viruses. Ann. N.Y. Acad. Sci. 724:22–42.
42. Greene, W. C. 1990. Regulation of HIV-1 gene expression. Annu. Rev. Immunol. 8:453–475.
43. Guatelli, J. C., T. R. Gingeras, and D. D. Richman. 1990. Alternative splice acceptor utilization during human immunodeficiency virus type 1 infection of
cultured cells. J. Virol. 64:4093–4098.
44. Haase, A. T. 1986. Pathogenesis of lentivirus infections. Nature (London)
322:130–136.
45. Haase, A. T. 1994. The role of active and covert infections in lentivirus pathogenesis. Ann. N.Y. Acad. Sci. 724:75–86.
46. Haynes, B. F., G. Pantaleo, and A. S. Fauci. 1996. Toward an understanding of the correlates of protective immunity to HIV infection. Science 271:324– 328.
47. Ho, D. D., A. U. Neumann, A. S. Perelson, W. Chen, J. M. Leonard, and M.
Markowitz.1995. Rapid turnover of plasma virions and CD4 lymphocytes in HIV-1 infection. Nature (London) 373:123–126.
48. Holodniy, M., L. Mole, D. Margolis, J. Moss, H. Dong, E. Boyer, M. Urdea,
J. Kolberg, and S. Eastman.1995. Determination of human immunodefi-ciency virus RNA in plasma and cellular viral DNA genotypic zidovudine resistance and viral load during zidovudine-didanosine combination therapy. J. Virol. 69:3510–3516.
49. Jurriaans, S., G. J. Weverling, J. Goudsmit, J. Boogaard, M. Brok, D. van
Strijp, J. Lange, M. Koot, and B. van Gamen.1995. Distinct changes in HIV type 1 RNA versus p24-antigen levels in serum during short-term zidovudine therapy in asymptomatic individuals with and without progression to AIDS. AIDS Res. Hum. Retroviruses 11:473–479.
50. Kim, S. Y., R. Bryn, J. Groopman, and D. Baltimore. 1989. Temporal aspects of DNA and RNA synthesis during human immunodeficiency virus infection for differential gene expression. J. Virol. 63:3708–3713.
51. Klotman, M. E., S. Kim, A. Buchbinder, R. A. De, D. Baltimore, and F.
Wong-Staal.1991. Kinetics of expression of multiply spliced RNA in early human immunodeficiency virus type 1 infection of lymphocytes and mono-cytes. Proc. Natl. Acad. Sci. USA 88:5011–5015.
52. Laspia, M. F., A. P. Rice, and M. B. Mathews. 1989. HIV-1 Tat protein increases transcriptional initiation and stabilizes elongation. Cell 59:283– 292.
53. Layne, S. P., M. J. Merges, M. Dembo, J. L. Spouge, S. R. Conley, J. P.
Moore, J. L. Raina, J. H. Renz, H. R. Gelderblom, and P. L. Nara.1992. Factors underlying spontaneous inactivation and susceptibility to neutraliza-tion of human immunodeficiency virus. Virology 189:695–714.
54. Malim, M. H., J. Hauber, S. Y. Le, J. V. Maizel, and B. R. Cullen. 1989. The HIV-1 rev trans-activator acts through a structured target sequence to acti-vate nuclear export of unspliced viral mRNA. Nature (London) 338:254–257. 55. Mellors, J. W., C. R. Rinaldo, P. Gupta, R. M. White, J. A. Todd, and L. A.
Kingsley.1996. Prognosis in HIV-1 infection predicted by the quantity of virus in plasma. Science 272:1167–1170.
56. Menzo, S., P. Bagnarelli, M. Giacca, A. Manzin, P. E. Varaldo, and M.
Clementi.1992. Absolute quantitation of viremia in human immunodefi-ciency virus infection by competitive reverse transcription and polymerase chain reaction. J. Clin. Microbiol. 30:1752–1757.
57. Michael, N. L., T. Mo, A. Merzouki, M. O’Shaughnessy, C. Oster, D. S.
Burke, R. R. Redfield, D. L. Birx, and S. A. Cassol.1995. Human immuno-deficiency virus type 1 cellular RNA load and splicing patterns predict disease progression in a longitudinally studied cohort. J. Virol. 69:1868–1877. 58. Michael, N. L., P. Morrow, J. Mosca, M. Vahey, D. S. Burke, and R. R.
Redfield.1991. Induction of human immunodeficiency virus type 1 expres-sion in chronically infected cells is associated primarily with a shift in RNA splicing patterns. J. Virol. 65:1291–1303.
59. Michael, N. L., M. Vahey, D. S. Burke, and R. R. Redfield. 1992. Viral DNA and RNA expression correlate with the stage of human immunodeficiency virus (HIV) type 1 infection in humans: evidence for viral replication in all stages of HIV disease. J. Virol. 66:310–316.
60. Nabel, G., and D. Baltimore. 1987. An inducible transcription factor acti-vates expression of human immunodeficiency virus in T cells. Nature (Lon-don) 326:711–713.
61. Neumann, M., J. Harrison, M. Saltarelli, E. Hadziyannis, V. Erfle, B. K.
Felber, and G. N. Pavlakis.1994. Splicing variability in HIV type 1 revealed by quantitative RNA polymerase chain reaction. AIDS Res. Hum. Retrovi-ruses 10:1531–1542.
62. O’Reilly, M. M., M. T. McNally, and K. L. Beemon. 1995. Two strong 59 splice sites and competing suboptimal 39splice sites involved in alternative splicing of human immunodeficiency virus type 1 RNA. Virology 213:373– 385.
63. Pantaleo, G., and A. S. Fauci. 1994. Tracking HIV during disease progres-sion. Curr. Opin. Immunol. 6:600–604.
64. Pantaleo, G., C. Graziosi, and A. S. Fauci. 1993. The role of lymphoid organs in the pathogenesis of HIV infection. Semin. Immunol. 5:157–163. 65. Pantaleo, G., S. Menzo, M. Vaccarezza, C. Graziosi, O. J. Cohen, J. F.
Demarest, D. Montefiori, J. M. Orenstein, C. Fox, L. K. Schrager, J. B. Margolick, S. Buchbinder, J. V. Giorgi, and A. S. Fauci.1995. Studies on subjects with long-term nonprogressive human immunodeficiency virus in-fection. N. Engl. J. Med. 322:209–216.
66. Peng, H., T. A. Reinhart, E. F. Retzel, K. A. Staskus, M. Zupancic, and A. T.
Haase.1995. Single cell transcript analysis of human immunodeficiency virus gene expression in the transition from latent to productive infection. Virol-ogy 206:16–27.
67. Perelson, A. S., A. U. Neumann, M. Markowitz, J. M. Leonard, and D. D. Ho.