(
1H-MRS) OF INTRACRANIAL LESIONS:
Assessment of differences between tumours andTumour like lesions & its applicability in brain lesion characterization
Thesis Submitted to
The Tamil Nadu Dr.M.G.R.Medical University, Chennai for the award of the Degree of
Doctor of Philosophy by
Dr.N.CHIDAMBARANATHAN
DEPARTMENT OF NEUROLOGY & NEUROSURGERY, APOLLO HOSPITALS, 21, GREAMS LANE,
This is to certify that the thesis entitled “Proton Magnetic Resonance Spectroscopy (1H-MRS) of Intracranial Lesions: Assessment of differences between Tumours and Tumour like lesions & its applicability in brain lesion characterization” is an original research work done by me, and it was not used previously either partly or fully for the award of any
Degree, Diploma, Associate ship, fellowship or other similar title.
Place: Chennai-6
Date:
Dr N Chidambaranathan,
This is to certify that the thesis entitled “Proton Magnetic Resonance
Spectroscopy (1H-MRS) of Intracranial Lesions: Assessment of differences between Tumours and Tumour like lesions & its applicability in brain lesion
characterization” submitted by Dr.N.CHIDAMBARANATHAN for the Award of
the degree of Doctor of Philosophy in Medicine, is a bonafide record of research
done by him during the period of study under our supervision and guidance, and that
it has not formed the basis for the award of any Degree, Diploma, Associate ship,
Fellowship or other similar title. We also certify that this thesis is his original
independent work. We recommend that this thesis should be placed before the
examiners for their consideration for the award of the Ph.D Degree.
GUIDE CO-GUIDE
Prof.PRITHIKA CHARY
MD, DM, Ph D, MNAMS (Neurology) MCh (Neurosurgery)
Senior Consultant Neurologist and Neurosurgeon,
APOLLO HOSPITALS, 21, Greams Lane, CHENNAI -600 006.
Prof.K.GANAPATHY
MS[Neuro], FAMS, FICS, FACS, Ph D Senior Consultant Neurosurgeon, APOLLO SPECIALITY HOSPITALS 320 Anna Salai Teynampet,
CHENNAI -600 035
Place: Chennai
This Thesis is dedicated to my Parents Swaminathan Natesan, Punithavalli Natesan
and all my Teachers especially
LateProf. ARCOT GAJARAJ and Late Dr. IQBAL AHMED
I am indebted to my father for living, but to my teacher for living well
– Alexander the Great
This work would not have materialised but for the support and
guidance from Dr PRITHIKA CHARY, my Guide and Supervisor who has been a constant source of inspiration and endless encouragement. I am greatly
indebted to her for making this study possible.
I am extremely grateful to my Co-Guide, Dr K GANAPATHY for the unstinted help, guidance and supervising my research work in an untiring
manner.
I express my sincere thanks to Dr V S MALLIKARJUN and
Dr MITRAGHOSH, consultant pathologists, for their useful interaction and for providing histo-pathological reports.
I am indebted to my radiology colleagues Dr V MALATHI and
Dr S NOOR BASHA for their professional support and for helping me in every possible way.
I have been most fortunate in securing the guidance and advice of
Mr THENNARASU of the Department of Bio-Statistics, Sankar Nethralaya, Chennai who was instrumental in carrying out the relevant statistical work.
I owe special thanks and gratitude to Mr M S MURALI
MURUGAVEL, Assistant Professor, Indian Institute of Technology Madras, for helping me in data analysis.
I thank my colleague Dr JAYARAJ GOVINDARAJ for all the help rendered
Imaging Sciences, Department of Neurology and Neurosurgery have helped me in his or her own way. I am grateful to each of them for their stimulating
questions and keen interest in the subject.
I thank all the staff in the Medical Record Section, Apollo Main Hospitals and Apollo Speciality Hospitals, Chennai, for their ever readiness to
help me at every stage.
My sincere thanks to Dr Radha Rajagopalan, Director of Medical Education and Dr Sathyabhama, Director of Medical Services and Members of the Ethical committee for facilitating my progress in carrying out this
study.
I express my deep appreciation & heartfelt thanks to Padma Vibushan
Dr Pratap C Reddy, Chairman, Apollo Hospitals Group and Mrs Preetha Reddy, Managing Director for all their constant support and encouragement. This work would not have been possible without strong support at
home from my wife and each member of my family who provided a
conducive atmosphere and cheerfully put up with all my procrastinations.
Last but not the least, my deep gratitude goes to each one of the patients
and their relatives in the study who unmindful of personal inconvenience
allowed me to scan & acquire data several times, thus contributing
significantly in my attempt to enrich current scientific knowledge.
Coming together is a beginning,
Keeping together is progress,
Working together is success – Henry Ford
SL. NO. CONTENTS PAGE
Chapter 1 INTRODUCTION 1-7
Chapter 2 AIMS AND OBJECTIVES 8-9
2.1. Need for this study 8
2.2. Hypothesis 8
2.3. Objectives 9
Chapter 3 REVIEW OF LITERATURE 10-64
3.1 History 10-15
3.2. Basic physics of MRI and MRS 16-24
3.3. Difference between MRS and MRI 24-25
3.4. Important Brain Metabolites 26-30
3.5 Diagnostic Performance: MRS and MRI versus MRI alone
31
3.6. Neoplastic Versus Non-Neoplastic Lesions. 32-43
3.7 High- versus Low-Grade Astrocytoma 43-51
3.8 Metastases versus High grade Gliomas: 52-54
3.9. Recurrent/Residual Tumour versus Treatment-Related Change
54-59
3.10 Non neoplastic lesions 59-62
3.11 Summary of review of literature: 63-64
Chapter 4 MATERIALS AND METHODS 65-80
4.1 Study design, setting and population 65
4.1.1 Sampling Technique 65-67
4.1.2 MRI and MR Spectroscopy measurements and
evaluation
68-73
4.2 Reference standard 73
5.1 Age distribution 83
5.2 Sex distribution 84
5.3 Malignant versus benign lesion 85-87
5.4 Neoplastic versus non neoplastic lesions 88-96
5.5 High grade gliomas versus low grade gliomas 96-104
5.6 High grade gliomas versus metastases 105-111
5.7 Post operative /Post radiotherapy changes Vs. recurrence
113-118
5.8 Distribution of Specific Metabolites in intracranial lesions
118-122
5.9 Non- neoplastic lesions 123-127
5.10 Analysis and observations on MV MRS study 128-129
5.11 Summary of Analysis and results 130-132
Chapter 6 DISCUSSION 131-216
6.1 MRS technical consideration 133-135
6.2 Neoplastic versus non neoplastic lesions 135-147
6.3 High grade gliomas versus low grade gliomas 148-158
6.4 High grade gliomas versus metastases 158-170
6.5 Recurrence of tumours Vs Post op. /Post RT changes 170-185
6.6 Non- neoplastic lesions 185-207
6.7 Role of MV MRS 208-212
6.8 Limitations 212-214
6.9 Diagnostic Impact of MRS on clinical outcome 214-215
6.10 Therapeutic impact of MRS in improving decision in clinical practice
7.1 CONCLUSION 224
7.2 Clinical Application and suggestions 226-227
BIBLIOGRAPHY
APPENDICES
Appendix i List of Tables i-ii
Appendix ii List of Illustrations iii-ix
Appendix iii List of Charts and Graphs x
Appendix iv Abstract xi- xii
Appendix v Abbreviations xiii-xv
Appendix vi Master chart containing MRS findings in various groups in the study population
xvi-xviii
LIST
OF TABLES
No. Title Page No.
Table No: 3-1 Differences between MRI and MRS 25
Table No:4-1 Metabolic ratio of control population 81
Table No: 4-2 Types of Lesions studied 75
Table No: 4-3 Distribution Pattern of Pathologic Spectra in MV MRS
82
Table No: 5.1 Age Distribution of the patients in this study 83
Table No: 5.2 Sex Distribution of the patients in this study 84
Table. No: 5-3 Results of sensitivity and specificity 86
Table No: 5-4 Estimation of sensitivity, specificity, positive and negative predictive values
86
Table No: 5-5 Area Under the Curve Estimation 87
Table No: 5-6 Univariate analysis - Neoplastic vs Non-neoplastic lesions By NAA/CR ratio
90
Table No: 5-7 Univariate analysis - Neoplastic vs Non-neoplastic lesions By CHO / CR ratio
92
Table No: 5-8 Univariate analysis - Neoplastic vs Non-neoplastic lesions By NAA /Cho ratio
94
Table No: 5-9 Binary Logistic regression analysis - Neoplastic vs Non-neoplastic lesions (NAA/Cr, Cho/Cr, NAA/Cho ratios)
96
Table No: 5-10 Univariate analysis High Grade gliomas VS low grade gliomas By NAA/CR Ratio
99
Table No: 5-11 Univariate analysis High Grade gliomas VS low grade gliomas By Cho/CR Ratio
100
Table No: 5-12 Univariate analysis High Grade gliomas VS low grade gliomas By NAA/Cho Ratio
102
Table No: 5-13 Binary Logistic regression analysis- High grade versus low grade gliomas( NAA/Cr, Cho/Cr, NAA/Cho ratios)
No. Title Page No.
Table No: 5-14 Univariate analysis. High grade gliomas Vs. Metastases By NAA/CR Ratio
106
Table No: 5-15 Univariate analysis. High grade gliomas Vs. Metastases By Cho/Cr Ratio
107
Table No: 5-16 Univariate analysis. High grade gliomas Vs. Metastases By NAA/Cho Ratio
109
Table No: 5-17 Binary Logistic regression analysis- High grade versus metastsis (NAA/Cr, Cho/Cr, NAA/Cho ratios)
111
Table No: 5-18 Univariate analysis –Post operative / Post Radiotherapy changes Vs Residual / Recurrent
Tumours By NAA/CR Ratio 113
Table No: 5-19 Univariate analysis –Post operative / Post Radiotherapy changes Vs Residual / Recurrent
Tumours By Cho/Cr Ratio 115
Table No: 5-20 Univariate analysis –Post operative / Post Radiotherapy changes Vs Residual / Recurrent
Tumours By NAA/Cho Ratio 117
Table No: 5-21 Distribution of LIPID in various intracranial lesions
120
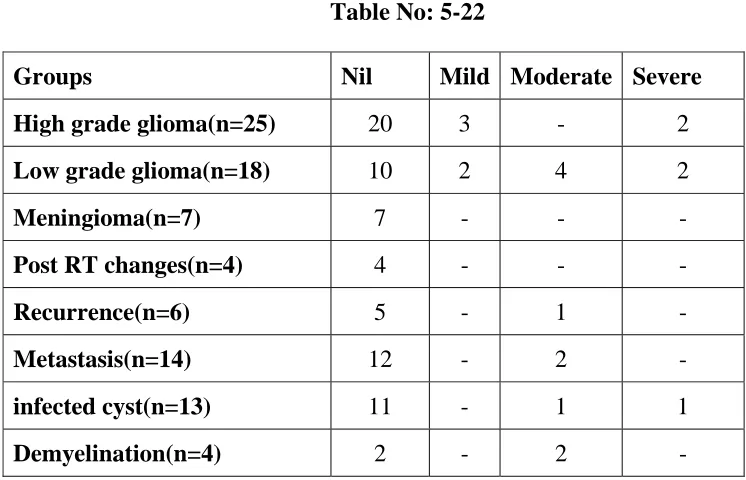
Table No: 5-22 Distribution of Lactate in various intracranial lesions
122
Table No: 5-23 Analysis of neoplastic Vs infective lesions 124
Table No: 5-24 Analysis of Neoplastic Vs Demyelinating lesions 127
Table No: 7-1 Summary: Distribution of Metabolites and their Ratios in various intracranial lesions
LIST
OF ILLUSTRATIONS
No. Title Page No.
Fig. 1a Magnetic Resonance Spectroscopy (MRS): single voxel proton MRS using point resolved spectroscopy for water and lipid suppression (TE:144) Normal spectral pattern : mI , Cho, Cr, Glx, NAA and lip from right to left
28
Fig. 1. B Control MRS: single voxel MRS in frontal lobe showing normal spectral pattern with metabolites ratios
28
CASE NO: 1 Fig. 2a
MRI shows faint, subtle, signal alteration on T2 WI in the right medial temporal cortex and non-enhancing on Post gadolinium contrast study – A nonspecific finding
139
Fig. 2b MRS reveals increased Cho/Cr ratio with small myoinositol peak at 3.5ppm representing low grade neoplasm
139
CASE NO: 2 Fig. 3a
MRI shows, a small, nodular, peripheral enhancing lesion in the left frontal cortex mimicking a granuloma
140
Fig. 3b MRS reveals increased Cho/Cr ratio (3.93) with marked reduction of NAA peak suggesting a neoplasm ; Stereotactic biopsy : Grade II Astrocytoma
140
CASE NO: 2 Follow Up Study Fig. 3c
MRI after 3 months shows, a small, nodular, peripheral enhancing lesion with perilesional edema in the left frontal cortex as seen in pre-operative study- Recurrence
141
Fig. 3d MRS reveals mild elevation of Cho peak with non-visualized NAA peak representing reactive changes ;Stereotactic biopsy : Radiation changes
141
CASE NO: 3 Fig. 4a
MRI shows a large, peripherally faint, indistinct enhancing lesion with perilesional edema and mass effect in the right temporal lobe; lesion reveals a peripheral rim of restricted diffusion on DW images suggesting a neoplasm
No. Title Page No.
Fig. 4b MRS reveals a broad peak between 2.1 and 2.5
ppm representing Gly/Gln and a myo-inositol peak; marked reduction in Cho and NAA suggesting non-neoplastic lesion; possibility of demyelinating disease is considered
142
CASE NO:3 Post treatment follow up studies: Fig. 4c
MRIs (after 2 months and 14 months ) show significant reduction in the size of the lesion on Dec 2009; gliosis in subcortical and deep white matter with wallerian degeneration along the tract on Dec 2010 studies
143
Fig. 4d MRS reveals a myo-inositol peak; marked
reduction in Cho and NAA and broad lipid peak representing chronic demyelinating disease
143
CASE NO. 4: Fig. 5a
MRI shows, a circumscribed nodular, peripheral enhancing lesion with central hypointense area and hyperintense rim on T2 WI in the left parietal lobe ; Granuloma. ? Neoplasm
144
Fig. 5b MRS reveals a sharp lipid peak at 1.3ppm and
absence of Cho, NAA and other metabolites representing Tuberculoma
144
CASE NO. 5 Fig. 6a
MRI shows, signal alteration on T2 WI in the left medial frontal cortex and non-enhancing on Post gadolinium contrast study – A nonspecific finding in the left frontal cortex – Focal cerebritis or neoplasm
151
Fig. 6b MRS reveals increased Cho/Cr ratio (1.9)with mild reduction of NAA peak suggesting a neoplasm ; Stereotactic biopsy : Grade II Astrocytoma
151
CASE NO. 6 Fig No: 7 A
MRI shows, a large, thick nodular, peripheral enhancing necrotic lesion with edema and mass effect in the left temporal lobe representing high grade neoplasm
152
Fig No: 7 B. MRS reveals increased Cho/Cr ratio (4.24)with marked reduction of NAA peak and sharp increased in height of lipid peak - a high grade neoplasm Biopsy : GBM
No. Title Page No.
CASE NO. 7: Fig. 8a
MRI shows, a large, midline, solid with cystic areas, intensely enhancing septal mass causing obstructive hydrocephalus-high grade neoplasm
153
Fig. 8b MRS reveals sharp increased choline height with Cho/Cr ratio (8.24) with marked reduction of NAA peak; No lipid or lac peak seen. Biopsy : Central neurocytoma
153
CASE NO: 8: Fig. 9a
MRI shows a thick walled peripheral enhancing nodular lesion with area of necrosis and marked peri-enhancing edema in the right parietal lobe; CT chest reveals central bronchogenic carcinoma
162
Fig. 9b MRS reveals increased Cho/Cr ratio (3.1)with mild reduction of NAA peak and lipid elevation suggesting a necrotic neoplasm. Stereotactic biopsy : metastatic adenocarcinoma
162
CASE NO. 9 Fig. 10a
MRI shows large bulky, enhancing intra-ventricular mass in left temporal horn infiltrating into temporal lobe suggesting high grade neoplasm
163
Fig. 10b MRS reveals increased Cho/Cr ratio with gross reduction of NAA peak and inversion of lactate peak (TE of 144) indicating high grade neoplasm. Biopsy : Ependymoma
163
CASE NO. 10: Fig. 11a
MRI shows a large, well-defined extra-axial neoplasm arising from the tentorium on right side causing mass effect on the cerebellum with tonsillar herniation –meningioma
167
Fig. 11b MRS (TE144) reveals sharp increased Choline
height with Cho/Cr ratio (6.2 )with marked reduction of NAA peak; A small inverted peak at 1.4ppm representing alanine. Biopsy: Meningioma
167
CASE NO:11 Fig. 12a
MRI shows large, lobulated, thick walled, peripheral enhancing lesion without significant mass effect in the left temporal lobe; another small lesion in the right lobe simulating metastases in view of clinical history.
No. Title Page No.
Fig. 12b MRS reveals a broad based lipid peak between 0.6 and 1.9ppm ; marked reduction in Cho and NAA
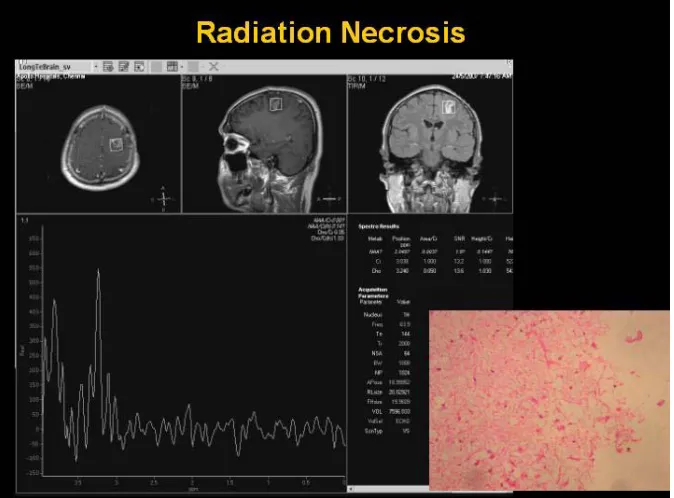
representing radiation necrosis 173
Case No. 11 : Follow up Fig. 12c
MRI after 9 months shows resolution of lesion in the left temporal lobe; lesion in the right temporal lobe appears more pronounced ; distribution of lesions consistent with radiation field
174
Fig. 12d MRS reveals a sharp lipid peak at 1.3ppm; marked reduction in Cho and NAA representing radiation necrosis ; Stereotactic biopsy of right temporal lesion: Radiation necrosis
174
CASE NO:12 Fig. 13a
Preoperative MRI shows patchy enhancing lesion in right parietal cortex- surgery done ; biopsy
:Neuroblastoma ( grade III) 180
Fig. 13b Post operative and post radiotherapy follow up of CNS Neuroblastoma- MRI after 15 months shows patchy enhancing areas in the right parietal lobe associated with area of gliosis suggesting doubtful recurrence
180
Fig. 13c MRS reveals marked reduction in NAA and
increased Cho/cr ratio suggesting reactive changes
; suggested follow up MRI with MRS 181
CASE NO:12 Follow up study Fig. 13d
MRI after 21 months shows resolution of enhancing areas seen in the right parietal lobe 182
Fig. 13e MRS (TE 31) reveals broad based lipid /lac peak between 0.6 and 1.6ppm; marked reduction in Cho
and NAA representing treatment related changes. 182
CASE NO: 13 Fig. 14a
MRI shows a well-defined, non-enhancing lesion in the left fronto-temporal lobe; it displays hypointense on T1 WI, hyperintense on T2 WI and non –restricted on DWI. Non specific
188
Fig. 14b MRS reveals mild increased Cho/Cr ratio with mild reduction of NAA peak, inversion of lactate peak (TE of 144) and detection of myoinositol peak suggesting neoplasm; Biopsy : Grade II Astrocytoma
No. Title Page No.
CASE NO: 14 Fig. 15a
MRI shows two (one occipital and one at frontal lobes) peripheral enhancing cystic lesions with central hyperintense area and hypointense rim on T2 WI and restricted area on DWI suggestive of abscess
189
Fig. 15b MRS reveals a sharp lipid peak at 1.3ppm,broad peak centered at 0.9ppm representing amino acid, and mild elevation of Cho/cr ratio and reduction of NAA representing pyogenic abscess
189
CASE NO. 15 Fig. 16a
MRI shows a circumscribed cystic lesion with thick periphera l enhancing wall in the left frontal lobe; lesion displays central hyperintense area and hypointense rim on T2 WI and restricted area on DWI suggestive of abscess
190
Fig. 16b MRS reveals a broad lipid peak centered at
1.3ppm and absence of Cho, NAA and other metabolites representing Tuberculous abscess
190
CASE NO:16 Fig. 17a
MRI shows multi-loculated, enhancing thinwalled, cystic lesion in the right frontal lobe; lesion displays non-restricted area on DWI suggestive of infected cyst.
191
Fig. 17b MRS reveals a sharp lipid peak at 1.3ppm,broad peak centered at 0.9ppm representing amino acid- acetate, alanine, and lactate mild elevation of Cho/cr ratio and reduction of NAA representing Infected cyst.-HYDATID CYST
191
CASE NO: 17 Fig. 18a
MRI shows multiple, nodular lesions with perilesional edema in both temporal lobes; lesions display multiple concentric layers of enhancement on post contrast study.
192
Fig. 18b MRS reveals broad based lipid peak at 1.3ppm, small peak centered at 0.9ppm representing amino acid, small succinate peak at 2.4ppm, mild elevation of Cho/cr ratio and reduction of NAA representing Infected lesion.Based on clinical and laboratory evidences , toxoplasmosis is considered.
No. Title Page No.
Fig. 18c Post medical treatment Follow up MRIs (after
3months, 15 and 25 months) show partial to complete resolution of the lesions and gliosis.
193
CASE NO: 18 Fig. 19a
MRI shows two peripheral faint enhancing lesions with perilesional edema and mass effect in the left frontal and right temporal lobes; lesion reveals a peripheral rim of restricted diffusion on DW images suggesting neoplasm.
199
Fig. 19b MRS reveals marked reduction in NAA/Cr and
increased Cho/Cr ratios; peak at 2.4ppm representing Gly/Gln and a myo-inositol peak suggesting non-neoplastic lesion; possibility of demyelinating disease is considered.
199
Fig. 19c MRIs (after 1month and 13 months )show
significant reduction in the size of the lesions in the left frontal and right temporal lobes on oct 2009;new lesion in right cerebellar peduncle; gliosis in subcortical and deep white matter with wallerian degeneration along the tract on Dec 2010 studies
200
Fig. 19d MRS reveals a myo-inositol peak; marked
reduction in Cho and NAA and broad lipid peak representing chronic demyelinating disease.
200
CASE NO: 19 Fig. 20a
A.MRI shows a large, irregular, infiltrative, peripheral enhancing necrotic lesion with edema and mass effect in the right tempero parietal lobe representing high grade neoplasm
206
Fig. 20b MV MRS reveals increased Cho/Cr and decreased NAA/Cho ratios, increased in height of lipid peak in the intra-tumoral and peri-enhancing areas representing high grade neoplasm. Biopsy : Grade III astrocytoma
206
CASE NO: 20 Fig. 21a
MRI shows a large, peripheral enhancing, ovoid lesion with edema and mass effect in the left temporal lobe representing high grade neoplasm
No. Title Page No.
Fig. 21b MV MRS reveals increased Cho/Cr and decreased NAA/Cho ratio in the intra-tumoral and normal spectra in the peri-enhancing areas representing non-infiltrative tumour. Biopsy : Metastatic adenocarcinoma
207
CASE NO: 21 Fig. 22a
MRI shows thickening of gyri with signal alteration on T2 WI in the left medial frontal cortex and no enhancement on contrast study - low grade neoplasm
210
Fig. 22b MRS reveals increased Cho/Cr ratio with mild
reduction of NAA peak consistent with a neoplasm. Stereotactic biopsy : Grade III Astrocytoma
210
Fig. 22c MRI shows signal alteration on T2 WI in deep white matter bilaterally representing post radiation leuko-encephalopthy
211
Fig. 22d MV MRS reveals normal spectra with lipid/lac in both frontal and right parietal lobes representing treatment related changes; increased Cho/Cr and decreased NAA/Cho ratio in the left parietal lobe representing recurrence of tumour. Biopsy : Tumour recurrence.
211
LIST
OF CHARTS & GRAPHS
No. Title Page No.
Fig No: 4-1 Area under curve – Methodology for analysis 77 Fig NO : 5-1 Age Distribution of the patients in this study. 83
Fig NO : 5-2 Sex Distribution of the patients in this study 84 Fig NO : 5-3 Area under the curve – Accuracy 87 Fig NO : 5-4 Anova analysis Neoplastic vs Non-neoplastic lesions
By NAA/CR ratio
90
Fig NO : 5-5 Anova analysis - Neoplastic vs Non-neoplastic lesions By CHO / CR ratio
92
Fig NO : 5-6 Anova analysis - Neoplastic vs Non-neoplastic lesions By NAA /Cho ratio
94
Fig NO : 5-7 Anova analysis High Grade gliomas VS low grade
gliomas By NAA/CR Ratio 99
Fig NO : 5-8 Anova analysis High Grade gliomas VS low grade
gliomas By Cho/CR Ratio 100
Fig NO : 5-9 Anova analysis High Grade gliomas VS low grade
gliomas By NAA/Cho Ratio 102
Fig NO : 5-10 Anova analysis. High grade gliomas Vs. Metastases
By NAA/CR Ratio 106
Fig NO : 5-11 Anova analysis . High grade gliomas Vs. Metastases By Cho/Cr Ratio
107
Fig NO : 5-12 Anova analysis. High grade gliomas Vs. Metastases
By NAA/Cho Ratio 109
Fig NO : 5-13 Anova analysis –Post operative / Post Radiotherapy changes Vs Residual / Recurrent Tumours By NAA/CR Ratio
113
Fig NO : 5-14 Anova analysis –Post operative / Post Radiotherapy changes Vs Residual / Recurrent Tumours By Cho/Cr Ratio
115
Fig NO : 5-15 Anova analysis –Post operative / Post Radiotherapy changes Vs Residual / Recurrent Tumours By NAA/Cho Ratio
117
Fig NO : 5-16 Distribution of LIPID in various intracranial lesions 120
ABSTRACT
Characterization of intracranial mass lesions, based on structural Magnetic Resonance Imaging (MRI) alone may be difficult. In such cases Proton Magnetic Resonance Spectroscopy (1H-MRS) along with other non-invasive techniques represents an advance in the specificity of brain lesion diagnosis.
PURPOSE: a) To determine if there are specific MRS findings which could help differentiate between neoplastic and non –neoplastic lesions and also to identify the presence or absence of MRS features which could help differentiate one type of neoplasm from another b)To determine if MRS findings could help grade gliomas pre operatively; c) To determine if MRS findings could help differentiate irradiated residual/ recurrent tumours from radiation necrosis. d) To determine if MRS findings could help differentiate necrotic tumours from infective lesions such as abscesses.
METHODS: In vivo proton MR spectroscopy was performed on 1.5 Tesla MR system using standard imaging head coil. 91 patients with intracranial masses were subjected to single voxel spectroscopy. Of the 91 cases that were studied, 70 were Neoplastic and 21 were Non-neoplastic lesions. 75 patients had a histopathological diagnosis and in16 patients presumptive diagnosis was made based on post treatment clinical response, or by serial imaging studies. 15 healthy volunteers were evaluated as a control group. The metabolic area ratios NAA / Cho; NAA / Cr and Cho / Cr were evaluated.
2D-CSI, multi- voxel study was performed in 15 patients, in whom, lesions were ill-defined or infiltrative on MR imaging sequences. On the basis of spectral and distribution patterns of the pathologic spectra seen at MR spectroscopy, a qualitative analysis was done.
RESULTS: Statistical analysis was made by Univariate analysis ANOVA and
with MRI guided 1H-MRS were 90.9%, 97.9%, 97.6%, 92%, and94.3% respectively.
Cho / Cr area ratio was statistically found to be more significant in differentiating neoplastic from non-neoplastic lesions ;.Mean Cho / Cr area ratio for neoplastic tumours (3.87 ± 2.20) was greater than that of non-neoplastic lesions (1.2 ± 0.66) with a P value of <0.001.
2. Decrease of NAA / Cho area ratio was statistically more significant in differentiating high grade from low grade gliomas: The mean NAA / Cho area ratio of high grade gliomas (0.27 ± 0.12, n = 25) was lesser than the mean NAA / Cho area ratio of low grade gliomas (0.64 ± 0.17, n = 18) with a p value < 0.001.
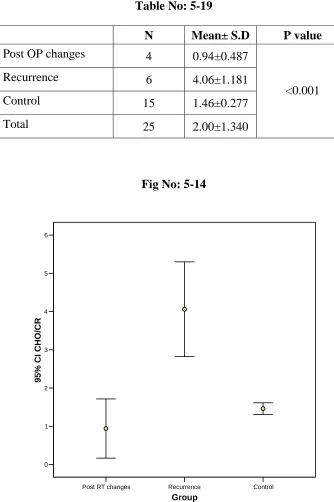
3. Cho / Cr area ratio was more statistically significant (with a P value of <0.001) in discriminating recurrence of tumour from post radiation necrosis / post operative changes. The mean Cho / Cr area ratio (4.06 ± 1.18) of recurrent / residual tumors was significantly higher than the Cho / Cr area ratio (0.94 ± 0.49) of post operative gliosis / post radiation necrosis
4. Tuberculous abscess depicted an isolated broad lipid peak at 0.9 ppm; Cho / Cr ratio was more statistically significant (with a p value of <0.001) in differentiating infective lesions from neoplastic lesions.
5. Pyogenic abscesses exhibited amino acid residues (valine, leucine), lactate, alanine and acetate.
6. Among the three metabolite ratios, none of the ratios are statistically significant in differentiating high grade gliomas from metastases in SV MRS. MV-MRS technique was useful in assessing response to radiation therapy in peri enhancing areas and in differentiating infiltrative tumour from circumscribed lesion
ABBREVIATIONS
MRI - Magnetic Resonance Imaging
MRS - Magnetic Resonance Spectroscopy
CE-MRI - Contrast Enhanced Magnetic Resonance Imaging
SV MRS - Single voxel Magnetic Resonance Spectroscopy
MV MRS - Multivoxel Magnetic Resonance Spectroscopy
1H-MRS - Proton Magnetic Resonance Spectroscopy
FLAIR - Fluid Attenuation Inversion Recovery
DWI – Diffusion weighted imaging
Ppm - parts per million
NAA - N Acetyl Aspartate
\Cho - Choline
Cr - Creatine
Lac - Lactate
Lip - Lipid
Glx - glutamate
Gly - Glycine.
AA - Amino acid.
MI - Myoinositol.
GBM - Glioblastoma Multiforme.
PNET - Primitive Neuro ectodermal Tumour
TB - Tuberculous
TDL - Tumefactive demyelinating lesion
HPE - Histopathological examination
GA - glatiramer
IFN-β - Interferon
MS - multiple sclerosis
NAWM - Normal appearing white matter
Gd - Gadolinium
CNS - Central Nervous system
CT - Computed Tomography
SNR - Signal-to-Noise Ratio
SVS - Single-Voxel Spectroscopy
CSI - Chemical-Shift Imaging
RF - Radiofrequency
3D.MRSI - Three Dimensional Magnetic Spectroscopic Imaging.
SPECT - Single-Photon Emission Computerized Tomography
SRS - Stereotactic Radiosurgery
PET - Positron Emission Tomography
FDG - fluoro-2-deoxy-D-glucose
CNI - Cho-NAA index
AVM – Arterio Venous Malformations
TE - Time to echo
TR - Time of repetition
PRESS - Point-Resolved Spectroscopy
CHESS - chemical-shift selective saturation
PPV - Positive Predictive Value
NPV - Negative Predictive Value
ROC - Receiver Operating Characteristic
AUC – Area Under Curve
TP - True Positive
FN - False Negative
TN - True Negative
FP - False Positive
ANOVA - analysis of variance
LR - logistic regression
CI – confidence interval
< - less than
¾ - more than
n - number
Gy - grey
RT - radiotherapy
Post – Op - post operative
Fig. - Figure
etc - etcetera
Viz - Namely
PROFORMA
Name: Age: Sex:
Occupation: Sl.No: IP/OP No:
Address: Ph.No: Date:
Ref Dr: Ph.No:
Clinical complaints:
Headache, seizure, loss of consciousness, altered sensorium
Past History:
H/O Tuberculosis, surgery , any relevant treatment history.
Clinical diagnosis:
Other diagnostic test: CT Brain, chest X-ray
MRI Evaluation:
a) MRI Finding
Nature Solid / cystic /mixed / hemorrhagic/ Location
T1WI T2WI Flair DW / ADC
I.V Contrast Size
b) MRS finding:
Width Area Height
NAA Cr Cho
Ratios:
Area ratios Height ratios NAA / Cr
NAA / Cho Cho / Cr
2) Presence of other metabolites
Lipid Lactate Amino acid
Acetate Alanine Glutamate
Glycine Succinate Scyillo inositol
MRS Report:
Neoplastic Non neoplastic
MRS Grading of glioma
Low grade High grade
CHAPTER 1
INTRODUCTION
Many diseases of the Central Nervous system (CNS) are life threatening,
although many of them are potentially treatable conditions. Early diagnosis is
necessary for appropriate treatment. In the past few decades, non-invasive modalities
such as Computed Tomography (CT) and Magnetic Resonance Imaging (MRI) have
established themselves in the diagnosis of various CNS diseases. MRI is superior to
CT due to its inherent sensitivity, specificity, better soft tissue contrast and
multiplanar capability.
MRI provides significantly more information about intrinsic tissue
characterization- a capability, which should be exploited by the neuro-radiologist to
determine tumour type. This ability to discriminate differences in tissues by variation
in signal intensities parallels findings on gross pathology and applies to several areas
pertinent to tumour imaging. Besides having multiplanar capabilities and excellent
soft tissue contrast, the different pulse sequences used, help in morphological
evaluation of various tumours and their components.
Specific diagnosis of brain tumours can often be achieved with MRI on the
basis of several specific intensity patterns, using T1 weighted images (T1WI) and T2
weighted images (T2WI). MRI uniquely depicts intra-tumoural haemorrhage or
necrosis. Some components of tumours may have specific and pathognomonic signal
intensities. Fat containing neoplasms (eg. teratoma, lipoma, dermoid) are easily
identified on MRI since fat is high intensity on T1WI and parallels the intensity of
subcutaneous fat. Profound hypervascularity associated with certain tumours like
signal void vessels within neoplastic masses. Intratumoral vascularity can be
confirmed by using gradient echo imaging or MR Angiography, which demonstrates
these vessels as hyper intense structures. Markedly hypercellular neoplasms especially
those with minimal cytoplasm are, characteristically, of relative low intensity on
T2WI and approximate the intensity of normal gray matter due to lower water content
(higher solid component).
MR imaging has made it easier to detect and differentiate intracranial mass
lesions. Nevertheless, it is sometimes impossible to base a diagnosis solely on clinical
and neuro-radiologic findings. Open biopsy is often required before commencing
specific treatment. This happens even in cases where surgery is not the first choice in
the final treatment. In this context, additional information provided by other non
invasive radiological techniques can be of great value for taking clinical decisions,
regarding patient management and hopefully in the future, avoiding invasive surgery.
In addition to conventional MR imaging techniques a variety of advanced
techniques have found their place in clinical practice or are the subject of intense
research. These advanced techniques offer more than the anatomic information
provided by the conventional MR imaging sequences. They generate physiologic data
and information on chemical composition. The current advanced techniques include
perfusion imaging, diffusion-weighted imaging (including diffusion tensor imaging),
Magnetic Resonance spectroscopy, Blood Oxygen Level–Dependent (BOLD)
imaging, and the largely experimental molecular imaging. Currently, the first three
Proton Magnetic Resonance Spectroscopy:
In vivo Proton Magnetic Resonance Spectroscopy (1H MRS) is a non-invasive technique and provides metabolic information, complementary to the anatomical changes, found in radiological examinations. This has proved useful, in providing additional information in various brain diseases. MRS is a non-invasive physiological imaging of the organ, that measures relative levels of various tissue metabolites. Because of differences in the cell type and growth characteristics of tumours, it is likely that tumour types will have unique individual
metabolic ‘fingerprints’.
The most useful nuclei for human spectroscopy are hydrogen, phosphorus,
sodium and to a lesser extent, carbon. Proton (hydrogen) Magnetic Resonance
spectroscopy (1HMRS) has a greater signal-to-noise ratio (SNR) and better spatial
resolution than phosphorus spectroscopy and is more easily integrated with MRI in a
single examination. 1HMRS has the potential to record biochemistry in vivo, which
can help in tissue characterization. Magnetic Resonance Spectroscopy (MRS) utilizes
the principle that nuclei in different chemical structures have different characteristic
resonance patterns, depending on the neighboring chemical structures and the
interactions between these various chemical structures. MRS detects the chemical
composition of the tissue under study and the associated software displays a waveform
The technique of spectroscopy is widely applied in chemistry for the analysis
of compounds in solution, and is a powerful tool for determining the structure of
biological macromolecules. Similarly, MR (Magnetic Resonance) spectroscopy can be
used to identify important molecules in living tissue. Protons often are used for MR
spectroscopy because of their high natural abundance and high nuclear magnetic
sensitivity. Despite the huge number of bio molecules in tissue, relatively few are
identifiable in vivo because only freely mobile compounds, that are present in
substantial concentrations, emit enough signals to be detected. The concentrations of
metabolites of interest are in the millimolar range for example water protons are a
thousand times as common. For this reason, water resonance has to be suppressed so
that the other molecules can be detected. The diagnostically resolvable hydrogen MR
spectra may be obtained using clinical instruments (1.5 T or greater) and routinely
used surface coils.
A basic step in spectroscopy is localization of the region of interest in all three
spatial dimensions, yielding the volume of interest. This can be performed using two
methods: single-voxel spectroscopy (SVS) or Multi voxel spectroscopy (MV-MRS),
chemical-shift imaging (CSI). In clinical practice, SVS is the easier and faster
technique for obtaining metabolic information. The voxel (volume element) being
sampled has a minimum size of 1 cm3, using current equipment. At least 128 signal
averages are required to obtain interpretable spectra within a clinically acceptable time
period.
A homogeneous magnetic field is an important prerequisite for obtaining
resolvable spectra. Shimming the field in the region of interest, to the resonance of
hydrogen spectroscopy. When the analogue-to-digital conversion is carried out, the
intensity of all metabolites is scaled, relative to that of water. The most common
technique used to suppress the water peak is chemical-shift selective suppression. In
some instances, it may also be desirable to suppress the signal from lipids because
lipid peaks are large and may obscure some metabolites of interest.
Although most modern clinical MR spectroscopy units are capable of echo
times as short as 20 milliseconds, adequate MR spectra may be obtained using echo
times as long as 136 to 272 milliseconds. Using long echo times, the signal from most
metabolites in the brain is lost. Conversely, short echo times allow for identification of
many other metabolites.
MRS, therefore, allows visualization of molecular processes as opposed to
structural and anatomic imaging of tissues and organs and thereby provides direct
biochemical information. Common metabolites studied with MRS include
N-acetylaspartate (NAA), Choline (Cho), Creatine (Cr), myo-inositol (mI), Glutamate
(Glu)/ Glutamine (Gln), amino acids, lipids, lactate, succinate and so on.
The metabolites thus detected are expressed as ratios such as NAA / Cho; NAA
/ Cr; Cho / Cr; Cho/ NAA and so forth based on their area and/or height. These ratios
are compared to the normal assigned ratios of the control groups or to the normal
portion of brain in the same individual as a reference. Unfortunately, there is no
Proton MR Spectroscopy gives important information in the differential
diagnosis of brain tumours through analysis of metabolites of the normal brain and
tumours. MRS is a non-invasive means of evaluating brain tumours, by investigating
the spatial distribution of metabolic changes in brain lesions. It is possible to detect
specific patterns in the changes of metabolite concentrations compared with those in
the normal brain.
Several studies (1,2) have shown that a common feature of many rapidly
growing tumours is an increased choline to creatinine ratio, and a decreased N
-acetylaspartate to creatinine ratio, and an increased lactate level. Decrease in overall
level of choline, creatinine, N-acetylaspartate and increase in lipid/lactate indicate
necrotic processes. These changes in brain metabolite level/patterns have been used to
grade the tumours, and to monitor and assess the effects of therapy.
Although it is possible to clearly distinguish glial neoplasms from normal brain
tissue by MRS, controversy exists regarding the reliability of MRS in distinguishing
different histological grades of astrocytomas and other brain tumours.
Bruhn et al, (3) in a qualitative comparison of in vivo MR spectroscopic
findings and histologic data from a variety of brain tumours showed that histologically
similar tumours exhibit similar spectra while histologically different tumours exhibit
has been shown to differ depending on whether the tissue is neoplastic or
non-neoplastic, rapidly proliferating or slow growing.
Apart from intracranial mass lesions MRS is also widely used in evaluating
infarcts, white matter disorders, trauma, metabolic disorders, neuro degenerative
disease, epilepsy, encephalopathy, parkinsonism among others. Its applications have
also expanded to other regions such as breast and prostate MRS is also an useful tool
to monitor therapy and to provide prognostic information in certain conditions (4).
CHAPTER -2
2.1. NEED FOR THIS STUDY
• Some Non-Neoplastic lesions particularly inflammatory lesions, pseudotumour,
encephalitis, demyelination may have spectral patterns similar to neoplasm.
• High grade gliomas often have false negative spectroscopy for tumours
• It is often difficult to distinguish cerebral abscess from necrotic primary or
metastatic brain tumours. These lesions have different treatment regimens and
prognosis.
• Tuberculoma/cerebral abscess / parasitic cysts pose a diagnostic problem
particularly in Indian patients.
• In post treatment follow up patients with brain tumour, a clear distinction
between tumour recurrence and radiation necrosis can often be challenging.
2.2. HYPOTHESIS:
MRS may be helpful in differentiating neoplasm from non-neoplastic lesions. In
MRS the specific relative metabolic peak ratios obtained from different regions of
brain tumours could be used to histologically classify astrocytomas
• MRS can provide biochemical information that can narrow the differential
diagnosis for cystic masses in general and may permit differentiation of brain
2.3. OBJECTIVES
• To determine if there are specific MRS findings which could help differentiate
between neoplastic and non –neoplastic lesions and also to identify the
presence or absence of MRS features which could help differentiate one type of
neoplasm from another.
• To determine if MRS findings could help grade gliomas pre operatively.
• To determine if MRS findings could help differentiate irradiated residual/
recurrent tumours from radiation necrosis.
• To determine if MRS findings could help differentiate necrotic tumours from
infective lesions such as abscesses.
CHAPTER 3
REVIEW OF LITERATURE
"Reading makes a full man, meditation a profound man, discourse a clear man."
Benjamin Franklin
3.1. History
The world of nuclear spins is a true paradise for theoretical and
experimental physicists. It supplies simple test systems for demonstrating the
basic concepts of quantum mechanics and quantum statistics (4). Nuclear spin
systems possess unique properties that pre-destinate the physicists for testing
novel experimental concepts in molecular studies.
All science is interdisciplinary – from magnetic moments to molecules
to men- as quoted by Paul C. Lauterbur(5). Nuclear magnetic resonance
began within physics, at a confluence among particle physics, condensed
matter physics, spectroscopy, and electromagnetics (4).
Key experiments of magnetic resonance started with the famous
molecular beam experiments by Isidor I. Rabi (6-7) acknowledged in 1944,
followed by the classical NMR experiments by Edward M. Purcell (8) and
Felix Bloch (9).
The first successful nuclear magnetic resonance (NMR) experiment
Felix Bloch, working at Stanford University, and Edward Purcell,
from Harvard University, found that when certain nuclei were placed in a
magnetic field, they absorbed energy in the radiofrequency range of the
electromagnetic spectrum, and re-emitted this energy when the nuclei were
transferred to their original state (8-9). The strength of the magnetic field and
the radiofrequency matched each other as had been demonstrated earlier by
Sir Joseph Larmor (Irish physicist 1857-1942). This is known as the Larmor
relationship (i.e., the angular frequency of precession of the nuclear spins
being proportional to the strength of the magnetic field). This phenomenon
was termed NMR and later was referred as Magnetic Resonance Imaging
(MRI)
This discovery heralded the birth of NMR spectroscopy. This soon
became an important analytical method in the study of the composition of
chemical compounds. For this discovery Bloch and Purcell were awarded the
Nobel Prize for Physics in 1952.
Purcell et al (8) and Bloch et al (9) elucidated the principles of
nuclear magnetic resonance in 1946. Five years later, Proctor and Yu (10)
proposed that the resonance frequency of a nucleus depends on its chemical
environment, which produces a small, but perceptible, change in the Larmor
resonance frequency of that nucleus. This nuclear behaviour is termed
“chemical shift,” and is caused by the magnetic fields generated by circulating
Later the optical detection schemes by Alfred Kastler (11), leading to a
prize in 1966. Other physics Nobel laureates have been associated in various
ways with magnetic resonance: John H. Van Vleck developed the theory of
dia- and paramagnetism and introduced the moment method into NMR,
Studies of Nicolaas Bloembergen had a major impact on early relaxation
theory and measurements; Karl Alex Müller contributed significantly to
electron paramagnetic resonance; Norman F. Ramsey was responsible for the
basic theory of chemical shifts and J couplings; and Hans G. Dehmelt has
developed pure nuclear quadruple resonance theory(4).
A major improvement in the signal-to-noise ratio of NMR was
achieved in 1964 by the enunciation of the Fourier transform spectroscopy
principle. The basic principle, parallel data acquisition, leading to the
multiplex advantage, was applied already by Michelson in 1891 for optical
spectroscopy (12) and explicitly formulated by Fellgett in 1951 (13). The
application of radio frequency (RF) pulse excitation was suggested by Weston
A. Anderson to Richard r. Ernst for a detailed experimental study in 1964
(14-16). It was known for a long time that the frequency response function
(spectrum) of a linear system is the Fourier transform of the impulse response
(free induction decay). This was already implicitly evident in the work of Jean
Baptiste Joseph Fourier who investigated as early as 1822 heat conduction in
solid bodies (17). In 1957, Lowe and Norberg proved that this relation was
also valid for spin systems, despite their strongly nonlinear response
characteristics (18). The first applications of random noise excitation in NMR
(20), for broadband testing and for broadband decoupling, respectively. The
first successful experiments using random noise irradiation led to
heteronuclear “noise decoupling” (21), a method that proved to be essential
for the practical success of carbon-l 3 resonance in chemical applications.
In 1971, Reinhold Raiser (22) and Richard r. Ernst (23)
independently demonstrated stochastic resonance as a means to improve the
signal-to-noise ratio of NMR by broadband irradiation. A third approach,
rapid scan spectroscopy, initially proposed by Dadok and Sprecher (24),
achieved a virtually simultaneous excitation of all spins by a rapid frequency
sweep through the spectrum (25, 26). Finally, by computer synthesis, it was
possible to compute an excitation function with a virtually arbitrary excitation
profile. This was originally utilized for decoupling purposes by Tomlinson
and Hill (27). Among the broadband excitation techniques, pulse excitation is
the only one that allows for a rigorous analytical treatment, irrespective of the
complexity of the spin system. Pulsed NMR experiments were suggested
already by Felix Bloch in his famous 1946 paper (9), and the first
time-domain magnetic resonance experiments were performed in 1949 by H.C.
Torrey (28) and, in particular, by Erwin L. Hahn (29) who may be regarded
as the true father of pulse spectroscopy. He invented the spin echo
experiment and devised extremely important and conceptually beautiful solid
state experiments (30, 31). Pulse Fourier transform spectroscopy not only
revolutionized high resolution liquid state NMR spectroscopy, but also
unified NMR methodology across all fields. It provided also the basis for the
A new approach to measure two-dimensional (2D) spectra was
proposed by Jean Jeener at an Ampere Summer School in Basko Polje,
Yugoslavia, 1971 (32). This two-pulse experiment by Jean Jeener is the
forerunner of a whole class of 2D experiments (33) that can also be expanded
to multidimensional spectroscopy. The credit for development of the basic
procedure for recording a 2D or 3D NMR image of an object goes to Paul
Lauterbur (34).
In 1971, Raymond Damadian observed that some malignant tissue,
obtained from implanted tumors removed from rats, had longer NMR
relaxation times than many normal tissues (5).
Commencing from 1972, Sir Peter Mansfield worked on Multi-pulse
line narrowing experiments (35) and Image formation in NMR, by a selective
irradiation process (36). One of the major practical difficulties encountered
with MRI, at that time was the time taken to acquire the data. The
breakthrough came in 1977 with the introduction of echo-planar imaging
(EPI) (37). This snap-shot technique meant that in principle, complete
two-dimensional images could be obtained in extremely short times. However, to
reach these acquisition times, yet another step was necessary. This was the
introduction of active magnetic screening (38, 39). An important area of
application of EPI has been foetal imaging during the third trimester. This
lead to multiple uses of EPI namely Whole Body Echo-Planar MR Imaging,
Ultra-fast magnetic resonance scanning of the liver with echo-planar imaging,
Transectional echo planar imaging of the heart in cyanotic congenital heart
Nuclear magnetic resonance (NMR) spectroscopy is unique among the
methods available for three-dimensional structure determination of proteins
and nucleic acids at atomic resolution, as the NMR data can be recorded in
vivo. Before 1967, important qualitative NMR features of amino acids and
proteins had already been noted and tentatively rationalized (44-48). It had
been well documented, that the spectrum of a globular protein is more
complex than the sum of the NMR lines, from the constituent amino acid
residues in the polypeptide chain. From 1970 onwards Kurt Wüthrich had
worked on NMR spectroscopy to determine protein and nucleic acid structure
and its use in structural biology and biological research (49-51).
Magnetic resonance spectroscopy of intact biological tissues was first
reported by Moon and Richards(52) using P-31 MRS to examine intact red
blood cells in 1973, and Hoult et al. (53) using P-31 MRS to examine excised
leg muscle from the rat in 1974. Since then MRS has been applied to almost
every organ of the body including brain, heart, liver, kidney, prostate, and
extremities.
Protons (1H) have traditionally been used for MR spectroscopy
because of their high natural abundance in organic structures and high nuclear
magnetic sensitivity compared with any other magnetic nuclei (54).Moreover,
diagnostically resolvable hydrogen MR spectra may be obtained with clinical
instruments (1.5 T or greater) and routine surface coils. Phosphorus 31 MR
spectroscopy has also been used clinically to study changes in high energy
3.2. Basic physics of MRI and MRS.
Before going into the physics and fundamentals of MRS a quick look
into the basic MR physics and sequences is essential. MRI is a complex and
most preferred modality for the definitive evaluation and follow-up of most
brain tumours. The technical aspects of MRI are beyond the scope of this
review. Very briefly, the patient is placed in a strong magnetic field which
causes the protons in the water molecules of the body to align parallel or
antiparallel with the field. Then a radiofrequency (RF) pulse is introduced
which excites these spinning protons and causes them to move out of
alignment with the magnetic field. When the RF excitation stops, the protons
return to their resting state within the main magnetic field, giving off the RF
energy acquired during the application of RF pulse. This released RF energy
signal is spatially localized by the rapid turning on and off of spatially varying
magnetic field gradients. This RF signal is detected by radio antennae (coils)
within the scanner and used to generate the image. Each proton’s behaviour
reflects the chemical microenvironment of that proton. The differences in the
behaviour of the protons result in differences in the MR appearances of each
tissue (55, 56). The amount of signal, a tissue produces, is dependent on the
number of mobile hydrogen protons, the speed with which the tissue is
moving, the tissue’s T1 relaxation time (the time needed for the protons
within the tissue to return to their original state of magnetization) and the
tissue’s T2 relaxation time (the time required for the protons perturbed into
coherent oscillation by the radiofrequency pulse to lose this coherence)
The standard MRI pulse sequence for eliciting anatomic and
pathologic detail is a spin echo sequence. T1-weighted images (short TR;
short TE) provide better anatomic detail, while T2 weighted images (long TR;
long TE), which are more sensitive to water content, are more sensitive to
pathology. The intermediate or proton density images (long TR; short TE)
provide improved contrast between lesions and cerebrospinal fluid.
Fluid-attenuated inversion recovery (FLAIR) is another pulse sequence that is
useful in detecting low contrast lesions. With FLAIR (long T1, long TR, and
variable TE), the CSF signal is nulled, enabling pathology adjacent to the CSF
to be seen more clearly. There is also less gray to white matter contrast,
providing a bland background against which lesions are readily seen (57). The
administration of contrast agents during T1- weighted MR scans, greatly
increases the sensitivity to differentiate abnormal from adjacent normal
signals. (57).
MRI is evolving rapidly. Echo planar MRI, Diffusion-weighted MR
imaging, perfusion-weighted MR imaging and MRS are applications which
could sometimes obviate the necessity for an invasive diagnostic procedures.
These MRI techniques could also serve to guide stereotactic brain biopsies to
the most representative areas, with potentially the highest grade of tumour and
also to suggest the best sampling area to differentiate recurrent tumour from
radiation necrosis .
3.2.1. Magnetic resonance spectroscopy (MRS)
Magnetic Resonance Spectroscopy (MRS) is a non-invasive method of
composition and spatial distribution of cellular metabolites (58, 59). Most
MRS studies are done with proton (1-H) or phosphorus-31. The tissue’s
chemical environment determines the frequency of a metabolite peak in an
MRS spectrum.
Protons that can be used for MRS include: 1H, 31P, 13C, 23Na, 7Li, 19F,
14N, 15N, 17O, 39K The most commonly studied nuclei are 1H and 31P. This
study uses Proton (1H).
Because we divide the signal from each voxel into a smaller number of
components (chemically distinct species) the SNR of spectra is lower than
that of MR images: to obtain an acceptable level of SNR in reasonable
imaging times, much larger voxels are required for MRS than MRI—typically
MRS uses voxel sizes of 1 to 8 cm3, whereas voxels for imaging are 1 to 5
mm3.
The Larmor equation describes the resonant precession frequency of a
nuclear magnetic moment in an applied static magnetic field.
w = g Bo
w = precessional frequency
g = gyromagnetic ratio (MHz/Tesla)
[42.58 MHz/Tesla for hydrogen nuclei]
Bo = magnetic field (Tesla)
If all the proton nuclei in a mixture of molecules had the same Larmor
magnetic B0 field “seen” by a nucleus is shielded by the covalent electron
structure surrounding the nucleus. Electrons are negatively charged and have
spin properties. Thus, when placed in an externally applied magnetic field,
electrons will precess and induce a small magnetic field around the nuclei.
These local magnetic fields generated by the surrounding electrons can
add or subtract from the applied magnetic field B0. Consequently, the nuclei
experience slightly different magnetic fields based on chemical structures.
Due to this small change in the local magnetic field, nuclei will resonate at
slightly shifted Larmor frequencies.
Nuclei with different chemical neighbours will have slightly different
resonance frequencies given by J coupling, also known as scalar coupling or
spin-spin splitting. This refers to the interaction of two nuclear spins on the
same molecule by means of distortions in their electron clouds. J coupling
interactions are responsible for the Chemical shifts in ppm and are
independent of the strength of the applied field B0 and therefore, the
instrument frequency Chemical shifts are measured in Hz are field and
frequency dependent.
In the frequency domain, the area under a specific peak is proportional
to the number of protons precessing at that frequency. A parts per million
(ppm) scale is used. Water is scanned at the center frequency, that position is
then assigned 4.7 ppm.
Local magnetic field inhomogeneities widen and distort the spectral
peak widths-thus improving both sensitivity and spectral resolution.
Maximum homogeneity is accomplished by adjusting DC currents in the
gradient coils and room temperature shim coils—a process known as
shimming. The importance of suppressing the water signal lies in the fact that
the metabolites of interest have a signal one hundred times smaller than that
of the water peak, and without water suppression they would be poorly
resolved.
3.2.2. Proton Spectroscopy – Technical considerations
Single -voxel (SV MRS) versus Multi-voxel MRS (MV-MRS) techniques (58)
Single Voxel Proton MRS :At present two Single Voxel proton
localization techniques are employed in clinical MRS Studies (59).
STEAM – Stimulated Echo Acquisition mode PRESS – Point Resolved SpectroScopy
3.2.2.1a. SV MRS with PRESS Water-suppression
The 90° pulse excites a slice. The first 180° pulse refocuses the
transverse magnetization in a row of tissue within the slice. The second 180°
pulse refocuses the magnetization within a column of the row, leaving a
single voxel. Then, the signal represents a combination of spins in that voxel
transform of signal represents number of spins at a given frequency in a voxel
(function of frequency) (60).
The effect of echo time in SE single voxel spectroscopy (SVS).
Left: TE=30ms; Right: TE=144 ms. TE controls the T2 “contrast” of
the spectral peaks in the same way tissue T2 contrast is controlled in MR
imaging. As shown, Glx (glutamine) and myo-inositol (mI) have short T2
values and are not visible on long TE spectra.
3.2.2.1b. SV-MRS with STEAM (60)
Water-suppression: The 90° pulse excites a slice. A second 90° pulse
refocuses the transverse magnetization in a row of tissue within the slice. A
third 90° pulse refocuses the magnetization within a column of the row,
leaving a single voxel.
Negative to STEAM: rephasing only about 50% of the original
generated transverse magnetization (low SNR).
Advantages of STEAM (60)
STEAMS enables observation of proton metabolites that have short T2
relaxation process, such as Myo-inositol (mI ), glutamate( Glu), Glutamine (
Gln) , because echo times( TEs) less than 20 millisecond can be used ; with
PRESS these proton metabolites cannot be observed. STEAM also affords
more effective suppression of water resonance signals because water
placed not only at the preparation phase of the volume localization pulse
sequence but also within the localization sequence (at the TM phase of the
STEAM sequence) without penalty to the TE being used. This is a major
advantage, especially when short TEs (<20msec) are used. At short TEs, the
signal intensity of the water resonance can be several folds greater than at
higher TEs. Thus higher or more water suppression pulses must be used to
attenuate the water signal.
In PRESS, the water suppression CHESS pulses can be placed only at
the beginning of the localization pulse sequence.
Disadvantage of STEAM (60)
There are two major disadvantage of STEAM
a) There is a theoretical factor of 2 losses in signal intensity.
b) STEAM is much more susceptible to motion, multiple quantum effects
(i.e. homonuclear coupling) and diffusion processes, which in lead to
difficulties in phasing and baseline correction in the spectrum.
The twofold signal loss in signal intensity in the STEAM sequence is
due to the imperfect refocusing of the spin magnetization when the second 90
degree pulse is applied, which rotates only half the spin of interest into the
longitudinal axis; this part of magnetization eventually generates the
stimulated echo. The other half of the spin magnetization that remains in the
transverse axis is dephased by the TM spoiling gradient and does not lead to
Advantage of PRESS
The major advantage of the PRESS sequence is the theoretical twofold
gain in signal intensity compared to the STEAM sequence. PRESS is also
much less sensitive to patient motion, homonuclear coupling effects, and eddy
current effects (60).
3.2.2.2.Multivoxel MRS (MV-MRS) (58)
MV-MRS is normally called either Chemical Shift Imaging (CSI) or
spectroscopy Imaging ((SI) because the signal intensity peak resonance areas,
or ratios of peak areas or signal intensities of the metabolites can be converted
to an image format and overlaid onto anatomic MR Images, thus showing a
qualitative or quantitative distribution of metabolites within the brain area
examined . Utilizing the CSI or SI multi-voxel technique, one can obtain
spectroscopic information from multiple adjacent volumes over a large region
of interest in a single measurement. Volume elements as small as 1 mL can be
examined at a reasonable acquisition times, namely 6 to 12 minutes.
Phase encoding gradients can be utilized, as in imaging, in order to
encode spatial information. Selective 90° RF pulse and slice-select gradient
generates a transverse magnetization within the slice. Orthogonal magnetic
field gradients of short duration serve to phase encode the data in 2D. Data
are sampled at multiple times. 3D Fourier inverse transformation gives
frequency information over the 2D slice. Spectra will then be generated for all
Either PRESS or STEAM pulse sequence is used for volume selective
pulse sequence for CSI/SI Multivoxel technique, which defines a large slice.
Spatial localization is achieved by phase encoding in one dimension (1D
CSI/SI,) two dimensions (2D CSI/SI), or three dimensions (3D CSI/SI).
The 1D CSI/SI generates a column of n volume elements within the
defined slice (n= number of phase-encoding steps in a defined phase encoding
direction).
The 2D CSI/SI generates n1 × n2 adjacent volume elements within a
defined slice plane.
The 3D CSI/SI generates multiple defined adjacent slice planes with
n1 × n2 × n3 spectroscopy volume elements or voxels.
3.3. What is the difference between MRS and MRI?
MRI and MRS are basically not different; both techniques are
governed by same the physical principle of Magnetism. They differ only in
the manner in which the data are processed and presented (58).
In MRI the data is collected and analyzed in time domain signal, to
obtain information about the nuclear relaxation time (T1 and T2) and this is
processed to generate an anatomic image. In MRS, the time domain
information is converted to a frequency domain via Fourier transformation of
Differences between MRI and MRS
Table No: 3-1
MRI MRS
Molecule Water Biochemicals
Nucleus 1H 1H, 31P, 13C
Chemical shift Unavoidable nuisance Exploits CS (PPM)
Voxel dimension 1mm x 1mm x 1mm 10mm x 10mm x 10mm
Scan time < 1 sec. to a few minutes 5 to 15 minutes
Spatial coverage volume Single voxel or a slice
Field homogeneity A few PPM < 1 PPM
Information Mostly qualitative Mostly quantitative
3.3.1. SELECTION OF TE:
The change in echo time (TE) influences the information obtained and
the appearance of the spectra (61). The choice of TE is decided depending
upon the lesion. The various TE used are TE-35, 135 and 270. The presence
of lactate in TE-35 is confirmed by inverted doublet at TE-144.
Carles Majos et al ( 62) attempted to classify brain tumours by
studying the influence of TE in 151 cases by comparing the spectra obtained
at two different TE ( 30ms and 136ms).They reported that tumour
classification was slightly better with short TE(81%) than at long TE (78%).
Meningioma was the only group in which long TE enabled better