Int. J. Electrochem. Sci., 10 (2015) 2072 - 2087
International Journal of
ELECTROCHEMICAL
SCIENCE
www.electrochemsci.org
Studies on the Effect of a Newly Synthesized Schiff Base
Compound on the Corrosion of Copper in 3% NaCl Solution
Yang Zhou, Shengtao Zhang*, Lei Guo, Shenying Xu, Hao Lu, Fang Gao
School of Chemistry and Chemical Engineering, Chongqing University, Chongqing 400044, China *
E-mail: stzhcq@163.com
Received: 1 December 2014 / Accepted: 31 December 2014 / Published: 19 January 2015
A new Schiff base derivative, N,N-dimethy-4-((E)-4-((E)-(4-methoxybenzylidene) amino) styryl) aniline (DSA), was used as an inhibitor for copper corrosion in 3% NaCl solution. Its inhibiting performance was evaluated by a series of techniques including weight loss, electrochemical measurements, scanning electronic microscope (SEM), and theoretical calculations. Results show that the high inhibition efficiency for copper corrosion was successfully achieved jus8t with a small amount of DSA. The DSA adsorption on copper surface obeys Langmuir adsorption isotherm. Furthermore, theoretical calculations give insightful explanations of the mechanism of DSA inhibition.
Keywords: EIS, Polarization, Weight loss, Copper, Adsorption, Theoretical calculations
1. INTRODUCTION
Copper has been one of the most important materials in industry owing to its high electrical and thermal conductivities, mechanical workability, and its relatively noble properties. It is widely used in condenser pipes of ships, coastal power plant heat exchangers, and so on. Although its resistance is quite good in nearly neutral or slightly alkaline aqueous environment, copper is still vulnerable to corrosion in harsh condition [1].
Schiff base derivatives have proved to be effective inhibitors for copper [9-11]. Based on the above considerations, DSA was synthesized as a potential inhibitor. It is expected to get adsorbed through the lone pairs of electrons on nitrogen and oxygen atoms of −C=N− group and −OCH3 group, as well as delocalized π-electron density on the phenyl rings by their coordination with copper surface. Further, literature survey reveals that DSA has not been reported as a corrosion inhibitor.
Thus, the aim of this work is to study the inhibiting effect of DSA on copper in 3% NaCl solution. Electrochemical polarisation, weight loss and impedance measurements are used. Meanwhile, theoretical calculations have also been used to give further insights into the adsorption and inhibiting mechanism of DSA on copper surface. The mechanisms of adsorption and inhibition are explained at the end of this paper.
2. EXPERIMENTAL
2.1. Materials and sample preparation
DSA was synthesized in our laboratory. The compound’s synthetic route and molecular structure were illustrated in Scheme 1. It was purified and was characterized by 1H-NMR, 13C-NMR and IR. Tetramethylsilane (TMS) was used as internal standard to determine NMR spectroscopy with Bruker 500 MHz apparatus at the room temperature. For DSA, 1H-NMR (CDCl3, 500 MHz), δ (ppm):1.097-1.125 (t, 6H, CH3), 3.340-3.376 (m, 4H, CH2), 3.850 (s, 3H, OCH3), 6.660-6.678 (d, 2H, CH), 6.938-6.971 (d, 1H, ArH), 7.075-7.092 (d, 2H, ArH), 7.122 (s, 1H, ArH), 7.239-7.265 (d, 2H, ArH), 7.399-7.416 (d, 2H, ArH), 7.547-7.563 (d, 2H, ArH), 7.891-7.908 (d, 2H, ArH), 8.599 (s, 1H, NCH); 13C-NMR (CDCl3, 125 MHz), δ (ppm): 162.295, 159.360, 159.306, 150.370, 130.746, 129.544, 128.638, 127.911, 127.152, 127.083, 123.583, 121.901, 114.732, 112.708, 55.837, 44.157, 12.901; IR (KBr) ν: 2930, 1681, 1603, 1520, 1355, 1163, 966, 836 cm−1.
Scheme 1. The synthetic route of and molecular structure of newly synthesized DSA.
experiments, they were cut into 1.00 cm × 1.00 cm × 1.00 cm cubes. The cube was embedded in epoxy resin in such a way that the flat surface was in contact with the aggressive solution (test solution) and with 1 cm2 exposed area. Before each test, all of the specimens were mechanically abraded with emery paper up to 2000 grit, then rinsed with distilled water, degreased ultrasonically in acetone and dried at room temperature.
During the weight loss and electrochemical measurements, the temperature of solution was controlled at 303 K by a water thermostat with an accuracy of 1 K, and all experiments were open to the air and carried out under static conditions.
2.2. Electrochemical tests
The electrochemical experiments were performed in a classical three-electrode cell assembly with copper specimen as the working electrode, platinum foil of 1.5 cm × 1.5 cm as the counter electrode, and a saturated calomel electrode (SCE) provided with a Luggin capillary as the reference electrode. All potentials were referred to SCE reference electrode. Electrochemical impedance spectroscopy (EIS) measurements were carried out at the open circuit potential (EOCP). The ac frequency range extended from 100 kHz to 10 mHz with a 10 mV peak-to -peak sine wave as the excitation signal. Then the impedance data were analyzed and fitted. The polarization curves were obtained from −250 to +250 mV (vs. EOCP) with 0.5 mV s−1 scan rate, and the data were collected and analyzed.
2.3. Weight loss experiments
Copper specimens in triplicate were immersed in the test 3% NaCl solution for 9 days under different conditions. After that, the specimens were removed from the solutions, rinsed in water and absolute ethanol, finally dried and weighted. Weight loss experiments were utilized to calculate the mean corrosion rate.
2.4. SEM analysis
The surface morphology of specimens after immersion in 3% NaCl in the absence and presence of different concentration of DSA was performed on a KYKY2800B SEM. The accelerating voltage was 25 kV.
2.5. Calculation methods
break-through in force field method. The MD simulation of the interaction between involved molecules and the Cu(111) surface was carried out in a simulation box (28.1 Å 25.5 Å 57.8 Å) with periodic boundary conditions to model a representative part of the interface devoid of any arbitrary boundary effects. The Cu(111) plane was first cleaved from copper crystal, and then the surface was optimized to the energy minimum. The DSA molecule was firstly optimized to most stable configuration with molecular mechanics method. The amorphous cell was then constructed with the optimized inhibitor and 800 water molecules using Amorphous Cell module. The configurations of (DSA + 800 H2O) interacting with Cu(111) are obtained by “build Layers” tool. The MD simulation was performed under 303 K, NVT ensemble, with a time step of 1 fs and simulation time of 1 ns.
Quantum chemical calculations were conducted with the DMol3 module [13]. All electronic calculations of DSA molecule were accomplished by GGA/BLYP method with a double numerical with d and p polarization (DNP) basis set [14]. The computationally economical DNP basis set is comparable in size to the Gaussian-type 6-31G (d, p) basis set and the reliability of this level of theory in studying the organic molecule has been confirmed [15, 16]. The convergence tolerance for geometry optimization was 2.7 × 10⁻⁴ eV for energy, 0.054 eV/Å for force, and 0.005 Å for displacement, respectively. The orbital cut off was set to 3.7 Å, and frequency analysis was performed to ensure the calculated structure being the minimum point on potential energy surface (without imaginary frequency).
3. RESULTS AND DISCUSSION
3.1. Potentiodynamic polarization
Figure 1 represents the potentiodynamic polarization curves of copper in 3% NaCl in the presence and absence of various concentrations of DSA.
-7.5 -6.0 -4.5 -3.0 -1.5
-0.5 -0.4 -0.3 -0.2 -0.1 0.0 (a) Blank 0.04 mM 0.06 mM 0.08 mM 0.10 mM
E / V (vs. SCE)
lo g i ( A cm ) -7.5 -6.0 -4.5 -3.0 -1.5
-0.5 -0.4 -0.3 -0.2 -0.1 0.0
Blank
E / V(vs. SCE)
lo g i (A c m )
Anodic Tafel line icorr
[image:4.596.71.530.532.713.2](b)
Table 1. Parameters for copper in 3% NaCl solution with different concentrations of DSA.
C (mM) Icorr (μA cm−2) Ecorr (V) βa (mV dec−1) IE%
Blank 13.46 ‒0.334 225 /
0.04 2.249 ‒0.242 98 83.29
0.06 1.945 ‒0.274 107 85.55
0.08 1.731 ‒0.286 105 87.14
0.10 1.412 ‒0.294 95 89.51
From Fig. 1a, it can be clearly seen that DSA has significantly decreased the corrosion rate, shifting polarization curves to lower values of corrosion current densities. This result indicates that the addition of inhibitor reduces copper anodic dissolution and also retards the oxygen reduction. This inhibition became more pronounced with increasing DSA concentration.
It has been known that in the Tafel extrapolation method, the use of both the anodic and cathodic Tafel regions is undoubtedly preferred over the use of only one Tafel region [17]. However, because the transfer of oxygen from the bulk solution to the copper/solution interface will strongly affect the rate of oxygen reduction, the cathodic polarization curves deviate from the Tafel behaviour, exhibiting a limiting diffusion current. Therefore, the corrosion current densities were obtained by extrapolation of the anodic polarization curves to Ecorr alone in this study, as shown in Fig. 1b. The kinetics of electron transfer at the metal/solution interface can be shown using the Butler–Volmer equation [18]. Moreover, for the copper electrode in 3% NaCl solution the Butler–Volmer equation is modified to give:
corr corr
( ) (1 ) ( )
corr e e
n F E E RT nF E E RT
ii (1)
where icorr is the corrosion current density at the corrosion potential Ecorr, α is the transfer coefficient (usually 0.5), and n is the number of electrons transferred. When the rate of the back reaction is negligible, Eq. (1) gives:
log
E a b i (2)
where a and b are constants. In Eq. (2), when E = Ecorr, then i = icorr. This is the basis for the Tafel extrapolation.
Associated electrochemical parameters such as corrosion potential (Ecorr), anodic Tafel slope (βa), and corrosion current density (icorr) are summarized in Table 1. The inhibition efficiency (IE%) was evaluated using the following equation:
0
corr corr
0 corr
% i i 100
IE
i
(3)
whereicorr0 andicorrare the corrosion current densities in the absence and the presence of inhibitor, respectively.
3.2. Electrochemical impedance spectroscopy (EIS)
To get further information concerning the inhibition process, EIS measurements on the copper electrode were performed. Fig. 2 shows the Nyquist plots in the presence and absence of DSA, respectively. Several convex arcs exist and each diameter of the arcs increases with the inhibitor concentration increases. When the concentration of DSA was 0.10 mM, the capacitive reactance arc radius was the greatest.
0 2000 4000 6000 8000
0 2000 4000 6000
0 600 1200 1800
0 300 600 900
Z
''
(Ω
c
m
2 )
Z' (Ω cm2)
Blank 0.04 mM 0.06 mM 0.08 mM 0.10 mM
Z
''
(Ω
c
m
2 )
Z' (Ω cm2)
[image:6.596.172.427.206.405.2]Blank
Figure 2. Nyquist diagrams for copper electrode in 3% NaCl solution with and without DSA.
Figure 3. The equivalent circuit model used to fit the EIS experiment data.
In Fig. 3, Rs shows the the solution resistance, Rct reflects the charge-transfer resistance, Rf is the resistance of the film formed on the copper surface, Qdl and Qf represent the constant phase elements (CPEs), and W is the Warburg impedance. The impedance of a CPE is defined as follows [24]:
( )
1
CPE 0
n
Z Y j (4)
where Y0 is the modulus, ω is the angular frequency, j is the imaginary root, and n is a deviation parameter, which determines the divergence of the CPE from an ideal capacitor varying between 0 and 1. When n = 0, CPE represents a resistance, for n = 1, an ideal capacitance. The inhibition efficiency was calculated from Rct according to the equation:
0
ct ct
ct
% R R 100
IE
R
(5)
whereRct0andRctare the charge transfer resistance in the absence and presence of the inhibitor, respectively.
Table 2. Impedance parameters of copper in 3% NaCl solution with different concentrations of DSA. C
(mM) Rs (Ω cm2
) Rf (Ω cm2
)
Rct (Ω cm2
)
Qf Qdl W
(×107 S s0.5 cm2)
IE% Y0 (×105
Ssn cm2)
n1 Y0 (×105 Ssn cm2)
n2
Blank 3.749 / 1037 / / 4.703 0.588 2.54 /
0.04 1.678 3.610 8300 26.14 0.380 1.997 0.921 / 87.51
0.06 1.722 3.681 9810 18.15 0.375 1.531 0.975 / 89.43
0.08 2.207 3.800 12920 11.83 0.940 1.256 0.952 / 91.97
0.10 2.494 4.171 14500 10.11 0.943 1.117 0.923 / 92.84
[image:7.596.46.552.558.680.2]
concentration. The film capacitance (Cf) and the electrical double layer capacitance (Cdl) could be expressed as follows [25, 26]:
2
f 4
F S C
RT
(6) 0
dl
C S
d
(7)
Herein, S is the surface area of the electrode exposed to the corrosive solution, F is the Faraday’s constant, ε0 is the permittivity constant of the air, ε is the local dielectric constant of the film, and d is the thickness of the electrical double layer. The decrease of Cf can be attributed to increasing inhibitor adsorption which decreases the exposed electrode surface area. On the other hand, the decrease of Cdl can result from a decrease in local dielectric constant and/or an increase in the thickness of the electrical double layer.
3.3. Weight loss test and the adsorption isotherm
The corrosion rate (v) can be obtained from weight loss measurements for different concentrations of DSA in 3% NaCl, as provided in Table 3. Corrosion rate v (mg cm−2 h−1) and the corrosion inhibition efficiency were obtained by the following formulas:
W v
S t
(8)
0 i
0
% v v 100
IE
v
(9)
where W is the average weight loss (mg), S is the surface area of specimens (cm2), t is the immersion time (h); v0 and vi signified the corrosion rate in the absence and presence of inhibitors, respectively.
[image:8.596.45.551.631.728.2]It can be seen that the corrosion inhibitor can protect copper perfectly and the inhibition efficiency increased with increasing concentrations. The corrosion rate reached to the minimum at 0.10 mM, but the inhibition efficiency reached to maximum. This phenomenon suggests that the DSA molecules act by adsorption on the copper surface.
Table 3. Weight loss data of copper in 3% NaCl solution with different concentrations of DSA for 9 days.
C (mM) v(mg cm−2 h−1) θ η (%)
Blank 9.82 / /
0.04 1.76 0.8207 82.07
0.06 1.39 0.8584 85.84
0.08 0.98 0.9002 90.02
The adsorption of organic inhibitor molecules from the aqueous solution can be considered as a quasi-substitution process between the organic compounds in the aqueous phase [Orgsol] and water molecules associated with the metallic surface [H2Oads] as represented by the following equilibrium [27]:
sol 2 ads ads
2
sol + H O →Org + H O
Org n n (10)
where n is the number of water molecules removed from the metal surface for each molecule of inhibitor adsorbed. The adsorption isotherm can give important information about the interaction of the DSA inhibitor and metal surface. In order to clarify the nature and the strength of adsorption, the experimental results were fitted to a series of adsorption isotherms, and the best fit was obtained with the use of the Langmuir adsorption isotherm, which is presented graphically in Fig. 4. The correlation coefficient (0.999) is close to 1 which confirms this assumption. Langmuir adsorption isotherm can be expressed by the following equation [28]:
ads 1
C
C K
(11)
where θ is the surface coverage (see Table 3), C is inhibitor concentration, and Kads is the adsorption equilibrium constant. This isotherm assumed that the adsorbed molecules occupied only one site and there was no interaction with other molecules adsorbed.
0.04 0.06 0.08 0.10
0.04 0.06 0.08 0.10 0.12
Slope = 1.0
C
/
(
mM
)
C (mM)
[image:9.596.188.411.386.553.2]R2 = 0.999
Figure 4. Langmuir adsorption isotherm of DSA on the surface of copper.
Gibbs free energy (Gads) could be calculated with the following equation [29]:
ads ln(55.5 ads)
G RT K
(12)
value of Gads is higher than 40 kJ mol−1, it functions by chemisorption due to the covalent bond formed by the charge sharing or a charge transfer from (to) the inhibitor molecule to (from) the metal surface [30]. According the obtained value of Gads (−39.4 kJ mol−1), it can be suggested that the adsorption of DSA involves two types of interaction, chemisorption and physisorption.
3.4. SEM Analysis
The SEM images of copper specimens exposed to 3% NaCl solutions for 3 days with and without DSA are given in Fig. 5. Before corrosion, the surface morphology of the sample was a freshly polished copper surface, as seen in Fig. 5a. After corrosion in 3% NaCl solution, the surface morphology becomes porous and rough as shown in Fig. 5b, which means the copper, was severely corroded. Fig. 5c~d show the morphological features of the inhibited surface. Compared with the blank, corrosion degree decreased obviously in the presence of the inhibitor. Especially when the concentration is 0.10 mM, the surface is very smooth. The inhibitor may form a protective film adsorbed on the copper surface, resulting in a decrease in the contact between copper and the aggressive solution.
Figure 5. SEM micrographs of freshly polished copper specimen (a), the specimen immersed in 3% NaCl solutions for 3 days without (b), and with 0.06 mM (c), 0.10 mM (d) DSA.
3.5. Quantum chemical calculations
[image:10.596.63.535.376.504.2]
regions are located at the upper/lower surface of the molecular skeleton. These electron-rich areas would be preferred sites for adsorption to metal surfaces.
Employing the finite difference approximation, the ionization potential (I) and electron affinity (A) of the inhibitors are calculated using the equations [32]:
(N 1) N
I E E (13)
( 1)
N N
AE E (14)
where E(N−1), EN, and E(N+1) are the ground state energies of the system with N−1, N, and N+1 electrons, respectively. The values of ionization potential (I) and electron affinity (A) were considered for the calculation of the electronegativity (χ) and global hardness (η): χ = (I + A)/2, η = (I – A)/2. The fraction of electrons transferred from (to) the inhibitor molecules to (from) the metal surface (ΔN) was calculated according to Pearson theory as follows [33]:
(
metalmetal inhinh)
inhinh2 2
N=
+
(15)
where the work function (Φ) is uesd for the electronegativity of copper surface, and the global hardness is neglected by assuming that for a metallic bulk I = A because they are softer than the neutral metallic atoms [34].
[image:11.596.181.418.447.708.2]The computed quantum chemical properties such as EHOMO, ELUMO, ionization potential (I), electron affinity (A), and the fraction of transferred electrons (ΔN) are listed in the Table 4. As seen form the table, the positive ΔN value indicate that the electron transfer from the DSA molecule to copper surface is available.
Table 4. Quantum chemical parameters derived for DSA calculated with the GGA/BLYP/DNP method.
EHOMO (eV) ELUMO (eV) ΔE (eV) µ (Debye) I (eV) A (eV) χ η ΔN
−4.175 −2.483 1.692 4.238 4.441 2.195 3.318 1.123 0.374
3.6. Molecular dynamics (MD) simulations
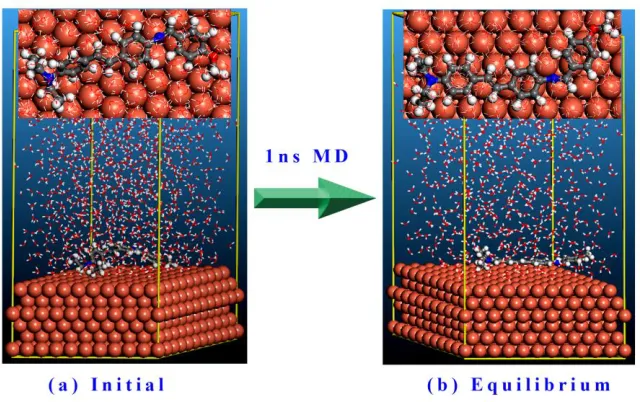
The molecular dynamics (MD) simulations have been employed to predict the adsorption of DSA molecule on Cu(111) surface. And the simulations were made with the participation of water so as to make the results more practical. Fig. 7 shows the initial and equilibrium configurations of DSA molecule adsorbed on Cu(111) surface in water solution. As time progresses, DSA molecule gradually moves to the iron surface, and when the adsorption process reaches a balance, all the atoms are almost in the same plane, and the DSA molecule plane is nearly parallel to the target surface. Actually, we have predicted this configuration in the quantum chemical analysis mentioned above. The DSA molecule is subjected to a substantial degree of deformation. Generally, the deformation degree of absorbed molecule can be evaluated by deformation energy (Edeform):
deform bonded free
E = E E (16)
where Ebonded and Efree are the energies of a single inhibitor molecule in the adsorbed and free states, respectively. As Table 5 shows, the Edeform of DSA is greater than 100 kJ mol−1, indicating that this molecule have deformed obviously.
Figure 7. Configurations of DSA molecule adsorbed on Cu(111) surface in water solution: (a) initial and (b) equilibrium. (Inset images show the on-top views)
[image:12.596.138.458.453.654.2]
(
)
ads complex Cu inh
E = E E E (17)
where Ecomplex is the total energy of the surface and inhibitor, ECu and Einh is the total energy of the copper surface and free inhibitor molecule, respectively. The binding energy is defined to be the opposite of the interaction energy, i.e., Ebinding = −Eads. A larger Ebinding implies the corrosion inhibitor combines with the copper surface more easily and tightly, therefore, the inhibitive performance will be better. One of the most important quantities when considering the results in solution is the solvation energy (Esol). It indicates the extent of the solute−solvent interactions on the different inhibitors (i.e., it is an indication of solubility). A high tendency to be solvated implies that the inhibitor spends more time in the solvent and has fewer tendencies to interact with the metal surface [35]. In this work, Esol was calculated according to the following equation:
(
)
sol inh+water water inh
E = E E E (18)
where Ewater+inh and Ewater are the total potential energy of the inhibitor molecule plus the water molecules and the pure water phase, respectively. The binding energy of the interaction system and the corresponding solvation energy of DSA molecule are listed in Table 5. The binding energy in Table 5 is positive, showing that the combination processes of DSA with copper surface is exothermic. While a relatively high value of Esol of DSA may originate from the large molecular volume.
Moreover, for the deeper insight of the molecule’s interaction with the surrounding medium and copper surface, the energy differences (ΔE) were calculated according the below formula [36]:
without-inh with-inh
E = E E
(19)
[image:13.596.46.543.558.589.2]where Ewith-inh is the energy of whole system with inhibitor molecule inside, and Ewithout-inh is the energy of the system in which the inhibitor molecule has been removed. The differences of non-bond energies (ΔEnon-bond), which include van der Wals energy (ΔEvdw), long range correction energy (ΔElrc) and electrostatic energy (ΔEelec), were examined and given in Table 5. It is not hard to conclude that the van der Wals and electrostatic interactions are the dominant factors for the inhibitor absorption, and the contribution from the former interaction is greater than the latter.
Table 5. Several energy parameters (all in kJ mol−1) for the DSA/Cu(111) system.
Eads Ebinding Edeform Esol ΔEvdw ΔEelec ΔElrc ΔEnon-bond
–506.3 506.3 293.1 –106.5 493.5 122.7 4.8 621.1
3.7. Mechanism of adsorption and inhibition
A clarification of the mechanism of inhibition requires full knowledge of the interaction between the protective organic inhibitor and the metal surface. The corrosion behavior of copper in NaCl solution has received considerable attention in the literature [37, 38]. The mechanism of the anodic dissolution of copper is shown in the following equations [39]:
Cu Cl CuCle (fast) (20) 2 ads
CuCl Cl (CuCl ) (slow) (21) 2
2 ads
The anodic copper dissolution was controlled by both electrodissolution of copper and diffusion of soluble (CuCl )2 ads to the bulk solution. Cathodic chemical process occurs as following:
2 2
O 4e2H O4OH (23)
As illustrated in Fig. 8, a mechanism has been proposed to explain the high inhibiting efficiency of DSA. It attributes the phenomenon to the formation of an adsorbed layer of DSA molecules, i.e.,
( )
( )adsCu 0 + DSACu : DSA (24)
where Cu: DSA(ads) refers to DSA adsorbed on the copper surface. Yet, at low DSA concentrations, a localized corrosion may occur at anode area, as validated by Fig. 5c. A perfect DSA organic film can be formed on copper surface with increasing concentration of DSA, which can be seen as a barrier to copper dissolution and O2 reduction. Several types of adsorption may take place in the inhibiting phenomena involving DSA molecules at the copper surface as follows: (i) non-covalent interaction of DSA (or protonated) molecules with copper atoms (physisorption); (ii) interaction between unshared electron pairs of N/O atoms or π-electrons of phenyl ring and copper surface (chemisorption); and (iii) a combination of the above processes.
Figure 8. Proposed mechanism for the adsorption of DSA molecules on the copper surface in NaCl medium.
4. CONCLUSIONS
(1) DSA exhibited good inhibition for copper corrosion in 3% NaCl solution. The inhibition efficiency increased with increasing concentration of DSA and reached its maximal value of 92.84% at 0.10 mM.
(2) EIS plots show that the charge transfer resistance increases and double layer capacitance declines in the presence of DSA, which is caused by the adsorption of DSA molecules on the copper surface.
[image:14.596.98.501.365.532.2]
negative values of Gads show the adsorption of this compound was a spontaneous process. The adsorption of it was the result of the combined action of the physical and chemical interactions.
(4) SEM micrographs showed that the inhibitor molecules form a good protective film on the copper surface.
(5) MD simulations reveal that DSA molecules adsorb on the copper surface in a nearly flat manner.
ACKNOWLEDGEMENTS
This work was supported by Natural Science Foundation of China (No. 21376282), and Chongqing Innovation Fund for Graduate Students (No. CYB14019).
References
1. G. Kear, B.D. Barker, F.C. Walsh, Corros. Sci. 46 (2004) 109. 2. B.E.A. Rani, B.B.J. Basu, Int. J. Corros. 2012 (2012) 1.
3. M.M. Singh, R.B. Rastogi, B.N. Upadhyay, Bull. Electrochem. 12 (1996) 26. 4. G. Kilmcceker, H. Demir, Anti-Corros. Method. M. 60 (2013) 134.
5. H. Baeza, M. Guzman, R. Lara, Int. J. Electrochem. Sci. 8 (2013) 7518. 6. H. Gerengi, K. Schaefer, H.I. Sahin, J. Ind. Eng. Chem. 18 (2012) 2204. 7. M.M. Antonijevic, M.B. Petrovic, Int. J. Electrochem. Sci. 3 (2008) 1. 8. S. John, A. Joseph, Mater. Corros. 64 (2013) 625.
9. S.M. Shaban, A. Saied, S.M. Tawfik, A. Abd-Elaal, I. Aiad, J. Ind. Eng. Chem. 19 (2013) 2004. 10.M. Hosseini, S.F.L. Mertens, M. Ghorbani, M.R. Arshadi, Mater. Chem. Phys. 78 (2003) 800. 11.H. Ma, S.H. Chen, L. Niu, S.X. Shang, S.L. Li, S.Y. Zhao, Z.L. Quan, J. Electrochem. Soc. 148
(2001) 208.
12.H. Sun, J. Phys. Chem. B 102 (1998) 7338. 13.B. Delley, J. Chem. Phys. 113 (2000) 7756.
14.C.T. Lee, W.T. Yang, R.G. Parr, Phys. Rev. B 37 (1988) 785.
15.J. Zhang, G. Qiao, S. Hu, Y. Yan, Z. Ren, L. Yu, Corros. Sci. 53 (2011) 147. 16.E.E. Oguzie, Y. Li, S.G. Wang, F. Wang, RSC Adv. 1 (2011) 866.
17.E. McCafferty, Corros. Sci. 47 (2005) 3202.
18.J.M. Saveant, D. Tessier, J. Electroanal. Chem. 65 (1975) 57. 19.D.D. Macdonald, Electrochim. Acta 51 (2006) 1376.
20.G. Quartarone, M. Battilana, L. Bonaldo, T. Tortato, Corros. Sci. 50 (2008) 3467. 21.D. Wang, B. Xiang, Y. Liang, S. Song, C. Liu, Corros. Sci. 85 (2014) 77.
22.S. Hong, W. Chen, Y. Zhang, H.Q. Luo, M. Li, N.B. Li, Corros. Sci. 66 (2013) 308. 23.A.O. Yuce, G. Kardas, Corros. Sci. 58 (2012) 86.
24.G.J. Brug, A.L.G. Vandeneeden, M. Sluytersrehbach, J.H. Sluyters, J. Electroanal. Chem. 176 (1984) 275.
25.P. Simon, Y. Gogotsi, Nat. Mater. 7 (2008) 845.
33.R.G. Pearson, Inorg. Chem. 27 (1988) 734.
34.L. Guo, W.P. Dong, S.T. Zhang, RSC Adv. 4 (2014) 41956.
35.E.E. Ebenso, M.M. Kabanda, L.C. Murulana, A.K. Singh, S.K. Shukla, Ind. Eng, Chem, Res. 51 (2012) 12940.
36.J.P. Zeng, J.Y. Zhang, X.D. Gong, Comput. Theor. Chem. 963 (2011) 110. 37.F. Arjmand, A. Adriaens, Materials 5 (2012) 2439.
38.Y. Zhao, C.J. Lin, Y. Li, R.G. Du, J.R. Wang, Acta Phys. Chim. Sin. 23 (2007) 1342. 39.K.F. Khaled, Appl. Surf. Sci. 255 (2008) 1811.