Do US Multinationals Differ from
Non-US Multinationals in Value Creation?
Dr. Protiti Dastidar
ACES Working Paper 2004.1
February 2004
ACES Working Paper Series
Paul H. Nitze School of Advanced
International Studies
1717 Massachusetts Ave NW, 5th Floor Washington, DC 20036
Phone: (202) 663-5880 Fax: (202) 663-5879
E-mail: [email protected]
Web: http://www.american.edu/aces
Do US Multinationals Differ from Non-US Multinationals
in Value Creation?
By
Protiti Dastidar
George Washington University
School of Business and Public Management
2023 G Street, Lisner Hall 230
Washington, D.C. 20052
Tel: (202) 994-1219
Fax: (202) 994-7422
Email: [email protected]
Current Version: December 3, 2003
ACES WORKING PAPER
Do US Multinationals Differ from Non-US Multinationals
in Value Creation?
By
Protiti Dastidar*
George Washington University School of Business and Public Management
2023 G Street, Lisner Hall 230 Washington, D.C. 20052
Tel: (202) 994-1219 Fax: (202) 994-7422 Email: [email protected]
Current Version: December 3, 2003
*
Do US Multinationals Differ from Non-US Multinationals
in Value Creation?
Abstract
Using a sample of domestic and multinational conglomerates from four countries, this
paper shows that the value impact of corporate diversification is not uniform across countries.
The evidence shows that smaller countries like Germany, Japan, and the UK have a larger
proportion of multinational conglomerates because multinational conglomerate diversification
does not destroy value. These results contradict previous literature, which primarily focuses on
US firms. In particular, though industrially diversified firms are valued at a discount in the US,
they are valued at a premium in Germany and when multinational conglomerate diversification is
taken into account this premium disappears. These results suggest that the value of corporate
Introduction
The theoretical literature highlights the importance of host-country, home-country, and
industry effects on the motivation and performance of multinational investment. The empirical
literature on va lue creation and foreign direct investment (FDI), however, has either focused on
US-based multinational enterprises (MNEs), and ignored the industry mix of FDI. Since many
MNEs are both industrially and internationally diversified, it is important to consider the impact
of industrial diversification, international diversification, and their interaction.
Institutional structure and corporate governance vary across MNE host countries. La
Porta et al (1999) find that the widely held ownership structure of the typical US firm is quite
uncommon for large corporations outside the US, which have a substantial family or state
ownership stake. There is also a wide variation in the number of multinationals across countries,
which suggests that multinationals in different countries do not have the same motives for
diversification. Consequently, it may not be appropriate to assume that diversification discounts
observed in the US are also the norm elsewhere.
This paper examines the link between international diversification or FDI and value
creation in four of the largest home-countries for multinational investment – Germany, Japan, the
UK, and the US. The focus here is on the interaction between industrial and international
diversification and value. While industrial diversification and international diversification have
been examined separately, the interaction between these forms of diversification has not been
Several concerns exist with respect to the diversification literature. Recent papers have
found that conglomerates destroy value.1 There is conflicting evidence also showing a global
diversification discount for US multinationals.2 Further, the literature controls for industry effects but ignores country or interaction effects.3 Much of the diversification literature does not
examine multinational conglomerates though they are some of the largest firms with substantial
economic impact and most of the evidence is limited to US firms.
This paper not only expands the sample beyond US borders but also addresses some of
the limitations in the literature. The methodology used in this paper controls for both industry and country effects separately and together in order to remove any confounding of the two
effects. This is not possible with the standard Berger and Ofek (1995) methodology.4 The
interaction between multinational and industrial diversification is also examined.
The results support the international business theoretical literature in throwing doubt on
the applicability of US results to the rest of the world. While US results are consistent with previous literature, the impact of industrial, international, and multinational conglomerate
diversification is not uniform across the four countries in the sample. First, the impact of
industrial diversification is not negative in all countries, e.g., industrially diversified firms in
Germany trade at a premium (consistent with Lins and Servaes (1999)). Second, the impact of
1
Berger and Ofek (1995), Lang and Stulz (1994), Lins and Servaes (1999). More recent evidence shows that firms choose to diversify across different lines of business and the industrial
diversification discount disappears when one accounts for this self- selection bias (Campa and Kedia (2002)).
2
Christophe and Pfeiffer (1998), Click and Harrison (2000), and Denis, Denis, and Yost (2002)
3
Fauver, Houston, and Naranjo (2003), and Denis, Denis, and Yost (2002) control for interaction effects. They do not control for country or regional effects. These papers are discussed in more detail in the literature review.
4
Data reporting constraints limit the scope of the analysis with the Berger and Ofek
geographic diversification is not always positive, e.g., German and Japanese firms are negatively
impacted by international diversification. Third, multinational conglomerates trade at a premium
in Germany and Japan. The smaller countries in the sample like Germany, Japan, and the UK have a much larger proportion of conglomerates (ranging from 42 to 58 percent of the sample)
compared to the US (29 percent).
It appears that successful firms in these countries are forced to diversify internationally
either due to the lack of domestic opportunities for expansion or alternatively to leverage their
proprietary assets.5 The evidence in this paper is also consistent with the Hitt, Hoskisson, and Kim (1997) argument that experience with product diversification builds managerial capabilities
that allow effective internatio nal management which consequently enables multinationals to
perform better. Tallman and Li (1996) also suggest that early product diversification focuses on
highly related product markets so they are able to capture the synergies (Geringer et al (1989),
Rumelt (1974)) followed by international expansion to exploit economies of scale.
The paper is organized as follows. The first section reviews some of the prior literature
on diversification and multinational investment. The next section describes the data. Next, the
methodology is discussed. Then the paper presents the results and a discussion of the results. The
final section concludes.
Why do Firms Diversify? A Literature Review
Theory
There is a vast literature on the costs and benefits of diversification based on market imperfections and transactions cost theory. The arguments about the benefits from diversification
5
predict that diversification has a positive impact on firm value. Stulz (1990) argues that
diversified firms create larger internal capital markets and thereby reduce the underinvestment
problem suggested by Myers (1977). Diversified firms are also predicted to have greater debt capacity than stand-alone firms because their cash flows are imperfectly correlated. Therefore,
diversified firms have less incentive to forego positive NPV projects than stand-alone firms.
Further, diversified firms may have higher values than non-diversified firms due to
winner-picking by headquarters, i.e., the creation of value by actively reallocating scarce resources
across projects (Stein (1997)). These arguments apply equally to firms that are diversified across product lines and those that are diversified across national borders since they do not distinguish
between related and unrelated diversification.
However, diversification also has its disadvantages based on agency cost theory. Jensen
(1986) argues that excess free cash flow could result in managers undertaking projects that do
not increase shareholder wealth. Since diversified firms have larger internal capital markets, they are also likely to generate more free cash flow than single-segment firms. Further, the internal
capital markets hypothesis could imply cross-subsidization of poorly performing segments by
better-performing segments. Another argument refers to information asymmetries within the
diversified firm. Since information is more dispersed, this could result in incentive misalignment
of central and divisional managers, thereby making such firms less profitable than their separate lines of bus iness (Berger and Ofek (1995)). The flip side of the winner-picking argument
mentioned earlier (Stein (1997)) is loser-sticking, i.e., forcing some projects to get lower funding
than they could obtain as stand-alones6. Rummelt (1974) suggest that managers operating in an
unprofitable industry go for product diversification to improve prospects. Part of the search
6
process to improve prospects could be to go into unrelated industries (Chang (1992) so firms
competing in less attractive industries have higher levels of product diversification (Delios and
Beamish (1999). Again, many of these arguments apply equally to firms that are diversified across product lines and those that are diversified across national borders.
In addition to the above advantages and dis advantages, multinational corporations
(MNCs) have additional benefits and costs originating from their geographic diversification.
Internationally diversified firms could benefit by internalizing the market for information-based
assets or proprietary assets (Dunning (1973); Buckley and Casson (1976); Rugman (1981); Caves (1971, 1996)). The market for these assets is imperfect in that they are difficult to sell and
the diversified firm internalizes the market for these assets. Errunza and Senbet (1981, 1984) and
Kogut (1983) suggest that MNCs are able to exploit differences in product and factor markets,
international taxation, and financial markets which enable them to extract higher rents than those
achieved by local competitors. These higher rents then allow multinationals to develop the proprietary assets (Kobrin (1991)) and innovation (Kotabe (1990)) needed to consolidate their
competitive advantage. Multinationals must use existing assets but also develop new ones to
enter into new markets (Hennart and Park (1993)), they can use existing proprietary assets from
multiple markets to apply to new market (Kogut and Chang (1991), Porter (1985)), all of which
increases with geographic scope and has become particularly relevant in the 90s (Dunning (1998)). Diversifying across borders also decreases the variability or risk of the firms’ revenue
streams (Hisey and Caves (1985), Kim Hwang, and Burgers (1993)). Some of the costs
associated with international diversification include significant barriers to coordination across
Further, individual investors are able to diversify internationally with the increasing
integration of international capital markets at a lower cost relative to firms. In the face of such
capital market integration is corporate diversification relevant?
Consequently, based on the theoretical arguments mentioned above, it is not clear that
industrial or international diversification should have a positive or a negative effect on firm
value. Further, it is also not clear what the interaction effect of industrial and international
diversification should be for multinational conglomerates. This is primarily an empirical
question.
Empirical Evidence
As mentioned in the introduction, there exists substantial evidence on the negative impact
of industrial diversification on firm value. Firms that diversify across product lines are poor
performers relative to firms that do not (Lang and Stulz (1994), Berger and Ofek (1995), Hitt,
Hosskisson, and Kim (1997)).
However, many MNCs are both internationally and industrially diversified. The empirical
evidence on firms that diversify across national borders shows a positive impact (Errunza and
Senbet (1981, 1984)). They find that the current degree of international involvement (foreign
income based on sales) is positively related to excess value.7 Bodnar, Tang, and Weintrop (1999)
7
Errunza and Senbet (1981, 1984) also find that the relationship between firm value and degree of international involvement is stronger during the period with greater restrictions on capital flows. This suggests that MNCs also provide a vehicle for international portfolio diversification. However, given greater capital market integration over the past decade, this advantage is perhaps of lesser importance today as suggested by the results in Dastidar (2003). She finds that
multinational firms in the U.K. and the US are valued no differently than an international
show that multinational firms suffer less from industrial diversification than domestic firms.
They suggest that the industrial diversification discount, based on the widely used Berger and
Ofek (1995) methodology, is overstated when one does not account for geographic diversification.8 Several studies have found a positive relationship between international
diversification and profitability (Grant (1987); Grant et al. (1988); Buhner (1987); and Kim et al.
(1989)). Other studies find that US bidders gain from industrial and international diversification
by focusing on acquisitions (Doukas and Travlos (1988) and Doukas (1995)). This suggests that
MNCs are likely to be successful and have higher firm values. Doukas and Lang (2003) find that geographic diversification increases shareholder value when firms engage in related international
greenfield investments. However, recent papers by Christophe and Pfeiffer (1998); Click and
Harrison (2000); and Denis, Denis, and Yost (2002) a find that global diversification reduces
shareholder value. Hitt, Hoskisson, and Kim (1997) argue that the reason for the mixed results is
because the relationship is more complex i.e. non- linear. As firms expand more internationally the costs begin to outweigh the benefits creating a curved relationship between
internationalization and firm performance.
The evidence discussed thus far is mainly for US firms. In the international sphere, Lins
and Servaes (1999) investigate industrial diversification discounts in Germany, Japan, the UK,
and the US. They find that Germany has no significant diversification discount but it is measured imprecisely because of the small sample. UK has a discount similar to the US and Japan’s
discount is significantly lower. However, they do not control for geographic diversification.9
Fauver, Houston, and Naranjo (2003) do control for geographic diversification and find no
8
Bodnar, Tang, and Weintrop (1998) do not isolate the impact of multinational conglomerates.
9
premium or discount in Germany and a discount in Japan, the UK, and the US for industrial
diversification. They also find a discount in Germany and premium in Japan and the US for
geographic diversification. They calculate the diversification discount relative to a domestic benchmark (controls for industry effects) and an international benchmark (controls for country
effects). They do not control for interaction effects, which would be particularly relevant for
multinational conglomerates. This study simultaneously controls for both effects as well as the
interaction effect.10
In summary, the literature provides both positive and negative reasons for industrial and geographic diversification and it is an empirical question as to whether the benefits outweigh the
costs or vice versa. Further, industrial and geographic diversification could have opposing or
complementary effects for multinational conglomerates. This paper looks at how investors value
industrial and international diversification and its interaction for a sample of German, Japanese,
UK, and US firms.
Data
Data are obtained from the Worldscope database for the period from 1990 to 1998. Since
data on geographic segments are primarily available from 1990 onwards, this sample period is
chosen to maximize the number of firms with international data. The sample includes 896 firm years in Germany, 7,513 in Japan, 1,325 in the UK, and 6,412 firm years in the US. Accounting
and market capitalization data are obtained from Datastream. Firms that are excluded from the
sample include: firms with two-digit SIC codes between 40 and 49 (utilities) and 60 and 69
10
(financial firms) (Source: Worldscope); firms with negative or zero segment sales;11 firms where
the sum of the segment sales is less than 90 percent of the total sales reported for the firm; firms
with total assets less than 100,000, and firms with missing market value data or no match on Datastream. The final sample includes 16,146 firm years.
The sample is then broken down by country and type of diversification (Table 1). Firms
are considered industrially diversified if they have multiple segment sales at the two-digit SIC
code level and are considered geographically diversified if they have regional sales in addition to
domestic sales. The five regions for the sample include: Asia and Pacific Region; Europe; NAFTA countries (the US, Canada, and Mexico); the Rest of the World; and domestic sales.
Firms in the sample could be single-segment firms, geographically diversified firms, industrially
diversified firms, or both.
Internationally Diversified Not Internationally Diversified Industrially Diversified Multinational Conglomerate
(1,1)
Local Conglomerate (1,0)
Not Industrially Diversified Pure Multinational (0,1)
Single Segment Local Firm (0,0)
The usual method adopted by most papers that use the Lang and Stulz (1994) or the
Berger and Ofek (1995) excess value measure lumps the purely domestic firms with those that
are single- industry but geographically diversified, and also combines the sample of the
conglomerates with the international conglomerate sample. These samples consider industrial
diversification only and do not take geographic diversification into account. The sub-sample of
industrially diversified firms (1,0) together with the sub-sample of industrially and
geographically diversified firms – multinational conglomerates (1,1) may be considered the
11
Berger and Ofek (1995) equivalent sample for multi-segment firms. This sample includes all
industrially diversified firms, some of which could be geographically diversified as well. The
sample of geographically diversified firms - multinationals (0,1) together with the sub-sample of non-diversified firms – purely domestic firms (0,0) may be considered the Berger and
Ofek (1995) equivalent sample of single-segment firms. This sample includes all firms that are
not industrially diversified. In this paper, however, each sub-sample is treated separately.12
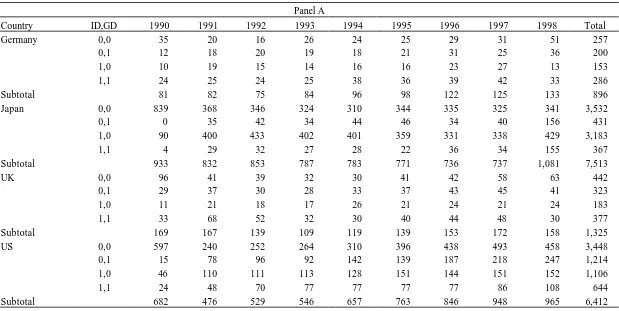
The proportion of firms in each category is not uniform across the five countries in the
sample. Generally, the single-segment firms form the largest portion of the sample in Japan, the UK and the US, but not in Germany (see Table 1, Panel A). Germany and the UK have more
internationally diversified firms than industrially diversified firms. It appears that a large
proportion of the diversified firms in these three countries are multinational conglomerates. A
possible explanation offered by Caves (1971) and Franko (1976) is that the lack of raw materials
in the European industrial countries together with their high levels of industrialization resulted in many MNCs integrating backward into the acquisition of raw material. Further, the small
national markets of some European countries also induce foreign direct investment so that firms
can diversify their risks. Domestic conglomerates dominate the Japanese sample of diversified
firms. Caves (1996) suggests that the cultural distance of Japan from the Western industrial
countries and its dependence on foreign technologies provided little incentive for Japanese firms to go abroad. Further, the Japanese firms also faced strong political pressure preventing the
establishment of production facilities outside Japan, all of which could explain the
preponderance of domestic conglomerates.
12
There is also a difference across countries in the industrial composition of segments,
according to Panel B. Most firms operate in the manufacturing sector, i.e., with two-digit SIC
codes between 20 and 39, followed by the services industry. The percentage of firms in the manufacturing sector varies from 38 percent in the UK to 63 percent in Germany.
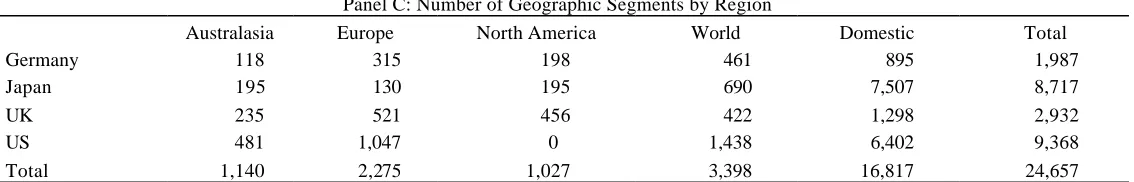
According to Panel C, firms primarily sell domestically and then to the Rest of the
World, to Europe, and North America.13 The total number of segments in each country is much
larger than the number of firms because a single firm could have multiple segments.
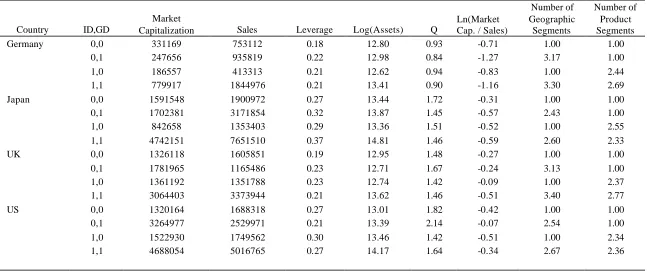
Table 2 presents the mean and median values of various firm characteristics for several sub-samples described earlier – single-segment firms (0,0); geographically diversified firms –
multinationals (0,1)14; industrially diversified firms (1,0); and industrially and geographically
diversified firms – multinational conglomerates (1,1). Firms that are both multinational and
conglomerate are generally larger in terms of market capitalization and sales across all countries
in the sample followed by firms that are just geographically diversified.15 Firms that are multinational have slightly higher Q ratios in the UK and the US. The number of geographic
segments in Germany and the UK is higher than that in Japan and the US, which is consistent
with the finding in Table 1, Panel A that there are more internationally diversified firms than
industrially diversified firms in these countries.
13
Sales by US firms in the North American region are classified as domestic sales. Hence there are no geographic segments in the North American region for US firms.
14
This sub-sample is also examined in Dastidar (2003). The analysis examines pure
multinationals (0,1) relative to an international benchmark portfolio to determine whether they are worth more than the sum of their individual parts or segments. This paper, on the other hand, examines these pure multinationals together with multinational conglomerates (1,1) relative to their local counterparts.
15
Methodology
Firm value is measured as the log of the ratio of market value to sales because it reflects the present value of future cash flows and does not require any risk adjustment like stock returns
and accounting measures (Lang and Stulz (1994)). The measure most commonly used in the
literature is the Lang and Stulz (1994) or the Berger and Ofek (1995) definition. According to
Bodnar, Tang, and Weintrop (1999), this definition is inaccurate because it fails to distinguish
industrial from geographic diversification (e.g., Lins and Servaes (1999)). Berger and Ofek (1995) and Bodnar, Tang, and Weintrop (1999) use alternative measures of firm value and find
that they yield similar results. An alternative measure also used in this paper is Q (see section on
robustness checks). The tables report the analysis with log of the ratio of market value to sales as
the dependent variable, since the sample is less restricted due to data constraints.
The regression methodology used in this paper is similar to the approach adopted in Morck and Yeung (1991). Firm value is assumed to vary due to the different industries and
geographical regions the firm operates in, its level and type of diversification, various control
variables such as size, leverage, and profit margin, plus an error term.16
This is also similar to an
industry or regional fixed effects approach, though each firm could have multiple industry or
regional fixed effects.
The dummy variable regression methodology has several advantages. First, it allows both
industry and country effects to be explicitly taken into account simultaneously (i.e., it is a
composite measure) whereas the Berger and Ofek (1995) or the Lang and Stulz (1994) excess
16
value measures examine industrial diversification alone.17 The Berger and Ofek methodology has
an additional drawback for smaller data samples. The number of single-segment firms in a
particular industry may be too small to obtain an accurate measure of the median imputed value for that industry.18 In contrast, the dummy variable regression methodology uses the entire data
sample (multi-segment and single-segment firms) to estimate the impact of industrial and
geographic diversification.
The entropy measure commonly used in the strategy literature is a sales weighted sum of
product or geographic segment size. This measure also does not simultaneously control for both industry and country effects. Hitt, Hoskisson, and Kim (1997) includes industry dummies as
controls for industry effects though country or regional effects are not included i.e. the location
of the firms’ international operations.
The variables used to capture the impact of diversification are as follows: The impact of
industrial diversification is measured by the coefficient on an industrial diversification dummy that equals one if the firm operates in more than one product segment (ID). Similarly, the impact
of geographic diversification is measured by a geographic diversification dummy that equals one
if the firm operates in more than one geographic segment (GD). An interaction variable captures
the impact of diversification for multinational conglomerates, i.e., firms that are both industrially
and geographically diversified.
17 The Berger and Ofek (1995) measure calculates imputed values for the firm based on industrial
segment data alone. Composite industrial and geographic segment imput ed values cannot be calculated because firms report sales by industry code and geographic location separately. The Berger and Ofek (1995) measure would require sales broken down by industry and then further broken down by location. These data are not available.
18
The impact of higher levels of industrial diversification is measured by the coefficients
on an industrial diversification dummy that equals one if the firm operates in two product
segments (ID2), and an industrial diversification dummy that equals one if the firm operates in three or more product segments (ID3+). The impact of higher levels of geographic diversification
is measured by the coefficients on a geographic diversification dummy that equals one if the firm
operates in two geographic segments (GD2), and a geographic diversification dummy that equals
one if the firm operates in three or more geographic segments (GD3+).
The diversification dummies capture the impact of industrial, geographic, and multinational conglomerate diversification after accounting for the impact of the particular
industry or region the firm operates in. Industry and country dummies (I1 to I87 and C1 to C5)
capture the pure industry and country effects. Industry dummy variables are defined for each
industry based on two-digit SIC codes, which equal one if the firm has sales in that industry (I1
to I87). Regional dummies are defined for five regions of the world, which equal one if the firm
has sales in that region (C1 to C5). C1 equals one if the firm has sales in the Australasian region,
C2 equals one if the firm has sales in the European region, C3 equals one if the firm has sales in
the North American region, C4 equals one if the firm has sales in the Rest of the World, and C5
equals one if the firm has domestic sales.
Results
The multivariate regressions in Tables 3 to 6 use the log of annual market capitalization
to sales as the dependent variable. This is similar to the Berger and Ofek (1995) excess value
measure except that the dependent variable does not adjust for industry effects. Instead, all the
code (I1 to I87) as independent variables. The number of industry dummies varies from country to
country because not all industries are represented in each country. All regressions are pooled
OLS regressions and the data are panel data with multiple firm years for each firm in the sample.
Impact of Industrial and Geographic Diversification
In Table 3 the regression measures the effect of product diversification and geographic
diversification19 and is of the form:
MSit = á+ â 1IDit + β2GDit + æ1 leverageit + æ 2 sizeit + æ 3 profitit
+ δ1 I1it + δ2 I2it+... + δ87 I87it + εit (5).
The multivariate regressions examine the impact of diversification after controlling for
industry and additional variables that effect firm value such as relative leverage, relative size,
and relative profit margin.20 Relative size and leverage are included to control21 for changes in
firm value that could be due to changes in capital structure or size of the firm.22
Leverage also controls for the degree of financial slack available or whether the firm is capital constrained.
19
Individual regressions with just product diversification or just geographic diversification were examined. These regressions are not reported as the magnitude and significance of the
coefficients for ID and GD do not change relative to those in Table 4. This is because the dummies for industrial and geographic diversification are not highly correlated with each other across the five countries in the sample.
20 All relative measures are the actual value minus a sales weighted median industry and regional
imputed value. Relative size, for example, captures the deviation of the firms’ actual size from that of the sales weighted portfolio of single-segment domestic firms. Since MNCs are likely to be much larger than the domestic firm, an absolute measure of size would not sufficiently control for this effect. Similar relative control variables are used in Bodnar, Tang, and Weintrop (1999), Denis, Denis, and Yost (2002) and Fauver, Houston, and Naranjo (2003).
21 Correlations between the explanatory variables are low in general. 22
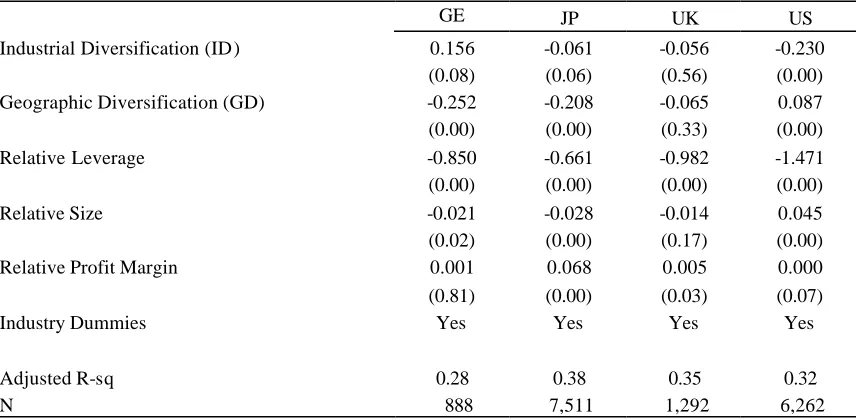
Based on the empirical evidence in the US, one would expect a negative coefficient for
product or industrial diversification and a positive coefficient for geographic or international
diversification. As expected industrial diversification has a negative and statistically significant impact in Japan and the US, which is consistent with prior empirical evidence (Lang and Stulz
(1994), Berger and Ofek (1995), Hitt, Ho skisson, and Kim (1997), Delios and Beamish (1999),
and Lins and Servaes (1999)).23 The impact is insignificant in the UK, i.e., there is no
diversification discount. In Germany, however, industrial diversification increases firm value.
These results for Germany are consistent with Lins and Servaes (1999).
Geographic or international diversification has a negative and statistically significant
impact in Germany and Japan, though it has a positive impact in the US. The result for the US is
consistent with that of Bodnar, Tang, and Weintrop (1999) and Morck and Yeung (1998). The
impact of geographic diversification is insignificant in the UK.
Impact of Multinational Conglomerate Diversification
If product diversification is considered beneficial as in the case of Germany, one would
expect German firms to be more industrially diversified. Instead they are more internationally
diversified than firms from other countries in the sample. However, this regression does not
control for multinational conglomerates, which are all considered to be industrially diversified
firms. This could have confounding effects on the industrial diversification discount. One could
also hypothesize from the results of Lins and Servaes (1999) of an insignificant discount in
Germany that the lack of a discount is perhaps due to the impact of multinational conglomerate
diversification (Bodnar, Tang, and Weintrop (1999)), since Lins and Servaes (1999) do not
23
explicitly take into account the impact of geographic diversification or multinational
conglomerate diversification. It is possible that the two types of diversification – industrial and
geographic – counteract each other in Germany. The industrially diversified group (ID equals one) as well as the geographically diversified group (GD equals one), both include multinational
conglomerates. Though the overlap of the two groups does not imply high correlation, this could
have confounding effects. Hence it is important to take the "interaction effect" into account
separately. This interaction effect has also not been previously examined for non-US
multinationals.
Table 4 specifically accounts for multinational conglomerate diversification in addition to
industrial and geographic diversification. The coefficient on ID captures the diversification effect
for firms that are just industrially diversified, the coefficient on GD for firms that are just
geographically diversified, and the coefficient on ID*GD for firms that are both industrially and
geographically diversified, i.e., multinational conglomerates.
MSit = á+ â 1IDit + β2GDit +β3ID*GDit + æ1 leverageit + æ 2 sizeit
+ æ 3 profitit + δ1 I1it + δ2 I2it+... + δ87 I87it + εit (6).
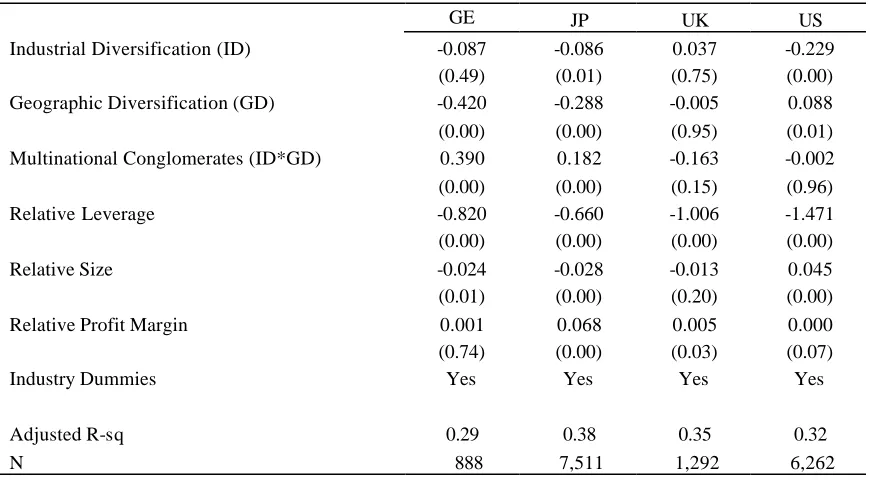
Multinational conglomerate diversification increases firm value in Germany and Japan.
The impact is insignificant in the UK and in the US. Previous results for industrial and international diversification do not change for Japan, the UK, and the US. The only results that
do change are in Germany. The inclusion of the multinational conglomerate dummy makes the
impact of diversification for firms that are just industrially diversified (coefficient on ID)
insignificant for German firms. This suggests that the positive impact of product diversification
In summary, multinational conglomerates are valued in Germany and Japan. The results
on industrial diversification for Germany, Japan, and the US are consistent with previous
literature (Lins and Servaes (1999)). The results on international diversification for the US are consistent with Bodnar, Tang, and Weintrop (1999) and Morck and Yeung (1998). It appears that
multinational conglomerate diversification is valued in Germany, though pure international
diversification is not. In Japan, pure industrial and international diversification has a negative
impact on firm value though multinational conglomerates appear to be able to benefit from the
synergies from product and international diversification. Pure international diversification has a positive impact for US firms. These results are new to the literature.
Impact of Higher Levels of Diversification
Next the different levels of diversification are examined, as it is possible that the impact
of diversification on firm value may not be uniform across all levels of industrial and
international diversification. Lang and Stulz (1994) find that the levels of diversification beyond
three segments do not matter so firms with two segments and firms with three or more segments
are examined. The regression in Table 5 examines higher levels of industrial and geographic
diversification and is of the form:
MSit = á+ â 1ID2it + â 2ID3 + β3GD2it + β4GD3it + β5ID2it*GD2it +β6ID2it*GD3it
+ β7ID3it*GD2it + β8ID3it*GD3it + æ1 leverageit + æ 2 sizeit
+ æ 3 profitit + δ1 I1it + δ2 I2it+.... + δ87 I87it + εit (7).
This table accounts for higher levels of industrial and geographic diversification for
In Germany, the impact of diversification for domestic conglomerates (no discount) and
pure multinational firms (discount) is consistent with previous tables. Firms with two and more
geographic segments trade at a significant discount. However, multinational conglomerates that are less industrially diversified (i.e., just two industrial segments) and more than two geographic
segments trade at a large significant premium (ID2*GD3). Multinational conglomerates with
high levels of both industrial and geographic diversification also trade at a large significant
premium (ID3*GD3). When one examines product or geographic diversification alone, it
appears that industrial diversification is valued positively in Germany. However, it is multinational conglomerate diversification that drives the results. So single-segment German
firms do not benefit from international diversification but multinational conglomerates with high
levels of international diversification do.
In Japan, firms with low levels of industrial diversification trade at a discount but not
those with higher levels of product diversification. The negative impact of geographic diversification is primarily driven by firms with more than two international segments. Further,
the positive impact of multinational conglomerate diversification is driven by firms with low
levels of industrial diversification, i.e., only two industrial segments (ID2*GD2), but possibly
more than two international segments (ID2*GD3).
In the UK, diversification does not matter. This seems surprising in light of previous literature. Later, in the section on robustness checks, the results are tested using an alternative
measure of firm value (Q). Since most of the results in the UK are insignificant, it is possible that
an alternative measure of firm value may provide deeper insights.
In the US, domestic conglomerates trade at a discount regardless of the level of industrial
international diversification. As before, there is no premium or discount for multinational
conglomerates regardless of the level of diversification.
Impact of Regional Sales
Thus far all the multivariate regressions control for industry effects only. The geographic
diversification variables do not control for the region of diversification. One could argue that
sales in certain regions with high information asymmetries could have a ne gative impact on firm
value, while sales in other regions could have a positive impact. The overall impact of
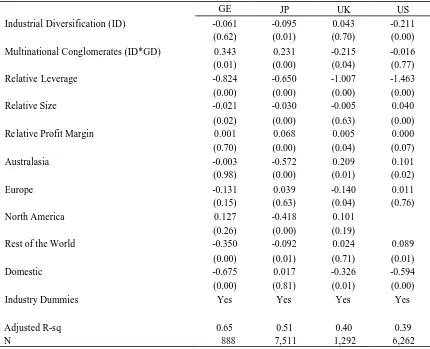
international diversification could wash out due to the opposing effects. Table 6 controls for the location of the firm’s sales.
MSit = β1IDit + β2IDit*GDit + æ1 leverageit + æ 2 sizeit + æ 3 profitit + γ1 C1it
+ γ2 C2it+... + γ5 C5it + δ1 I1it + δ2 I2it+... + δ87 I87it + εit (8).
The geographic diversification dummy (GD) is dropped from this regression since the sum of the location variables add up to one. If the firm is geographically diversified this impact
is captured by the location variables (C1- C5). The intercept term is also dropped since all firms
have domestic sales (C5).
Comparing the results in Table 4 with those in Table 6, the impact of industrial
diversification and multinational conglomerate diversification remains unaffected in all the countries except the UK. After taking into account the impact of regional sales, multinational
conglomerate diversification has a negative impact on firm value in the UK. This was previously
insignificant.
Domestic sales have a large negative impact on firm value in Germany, the UK, and the
diversification observed in Table 6 appears to be driven by sales in the Rest of the World
(primarily emerging markets). In Japan, sales in all regions except Europe have a large negative
impact on firm value. In the UK, sales in the Australasian region have a positive impact, while sales in the rest of Europe has a negative impact. In the US, increased sales in the Australasian
region and emerging markets imply higher firm values.
Robustness Checks
As an alternative to the log of annual market capitalization to sales as the dependent
variable, all the regressions are rerun using Q measured as the ratio of market capitalization plus
long-term debt plus current liabilities divided by total assets. As compared to the results in Table
4, the sign and significance of the coefficients do not change in Germany and the US. In the UK,
the impact of pure geographic diversification, which was previously insignificant, now becomes
significant and positive. Geographic diversification has a positive impact on firm value (16
percent) when Q is used as a measure of firm value. Further, the impact of pure industrial
diversification in Japan is now insignificant.24 It was previously negative and significant with the
log of annual market capitalization to sales as the dependent variable.
Discussion
The results presented in this paper are not consistent across the countries in the sample.
What causes the impact of diversification to differ across countries? Let us examine them on a
case-by-case basis.
24
Product diversification generally implies a discount which is consistent with prior
literature. This discount may be explained using agency cost theory which suggests that
managers with excess free cash flow may forego positive NPV projects and increase consumption of perks or build empires. Alternatively, managers could be cross-subsidising
poorly performing segments.
However, German firms do not face this product diversification discount, which is also
consistent with prior literature (Lins and Servaes (1999) and Fauver, Houston, and Naranjo
(2003)). Krainer (1967), Franko (1976) and Caves (1996) argue that the lack of raw materials in the European industrial countries together with their high levels of industrialization led to the
creation of multinationals that were integrated backward into the acquisition of raw material.
Further, the small national markets of some European countries offer successful firms limited
opportunities to diversify risks and therefore induce heavy foreign direct investment (Caves
(1996)). Recent evidence for US conglomerates indicates that successful firms choose to diversify across lines of business (Campa and Kedia (2002)). Extending this argument to
multinationals, successful firms choose to diversify internationally (Dastidar (2003)) and the
experience gained with product diversification can build managerial capabilities that allow
effective management across national borders (Hitt, Hoskisson, and Kim (1997)). These
arguments could help to explain why industrial diversification does not have the expected negative impact. Successful firms in small countries with limited opportunities for expansion
choose to diversify across industry lines as well as across national borders.
So why do Japanese firms face an industrial diversification discount given that Japan is
also a relatively small country? Lins and Sevaes (1999) provide evidence that firms that belong
need to be diversified to get the benefits of diversification. The sample in this paper is comprised
of very large firms which are likely to be part of a keiretsu. This test is beyond the scope of the
current paper.
The positive impact of multinational conglomerate diversification in Germany and Japan
is also consistent with the story that successful firms diversify domestically and internationally
due to the small size of the local market and not because managers want to build empires.
Successful conglomerates build managerial capabilities, which are then transferred across
national borders (Hitt, Hoskisson, and Kim (1997)). Tallman and Li (1996) suggest that early product diversification focuses on highly related product markets so firms are able to capture
synergies across different lines of business. When firms expand internationally they can also
exploit economies of scale and scope (Geringer et al (1989), Rumelt (1974)). Global markets
have intense competition and achieving synergies and economies of scale allow these firms to
compete effectively (Hitt, Keats, and DeMarie (1995)). Multinational firms achieve complementarities between different resources across business units that are difficult for
competitors to imitate (Harrison, Hitt, Hoskisson, and Ireland (1991)). The results in this paper
show that multinational conglomerate diversification does not have a negative impact on firm
performance and for small countries it positively impacts firm performance. This implies that the
commonly observed industrial diversification discount is not important for multinational conglomerates.
International diversification has a positive impact on firm value in the US. This is also
consistent with the previous literature (Bodnar, Tang and Weintrop (1999), Morck and Yeung
diversification has a negative impact on firm value in Germany25 and Japan. Sundaram and
Black (1992) suggest that there are significant barriers to coordination across countries, which in
turn increase information processing demands associated with language, cultural, political, and regulatory differences. Hitt, Hoskisson, and Kim (1997) argue that as firms expand more
internationally the costs begin to outweigh the benefits creating a curved relationship between
internationalization and firm performance. Further, pure international diversification could have
a negative impact because managers have no experience in managing multiple divisions.
The results on levels of diversification (Table 5) show that US-based domestic conglomerates trade at a discount regardless of the level of diversification. In Japan, however,
the impact is only observed at lower levels of industrial diversification. The premium for US
firms with pure international diversification is associated with high leve ls of international
diversification only. In Germany and Japan the costs outweigh the benefits of international
diversification, especially at higher levels of international diversification in Japan.
Multinational conglomerate diversification positively impacts firm value in Germany and
Japan - although this positive impact is driven by high levels of international diversification in
Germany and low levels of industrial diversification in Japan. In the US and the UK, the impact
of multinational conglomerate diversification is insignificant regardless of the level of
diversification.
The results on the location of the firms international operations (Table 6) suggest that
larger distance has a positive impact on firm value except for emerging markets where the
information asymmetries could outweigh the benefits of multinational diversification.
25
Continuing with the distance argument, it appears that UK multinationals have no added
advantage from sales closer to home (in the European region). Consistent with the results for
European firms, it appears that Japanese multinationals also have no added advantage from sales closer to home (in the Australasian region). A possible explanation could be that exports are
perhaps an easier mode of entry into regions closer to home with lower regional trade barriers.
Consequently, regional subsidiaries are not valued highly.
Conclusion
This paper shows that the impact of diversification is not consistent across countries.
Interestingly, industrially diversified firms in Germany do not trade at a discount while
geographically diversified firms do. However, the industrial diversification premium in Germany
disappears when one accounts for multinational conglomerate diversification. Multinational
conglomerates are valued positively in Japan and Germany. The multinational conglomerate
premium in Germany is driven by higher levels of international diversification while the
premium in Japan is from lower levels of industrial diversification. Overall the results on
industrial diversification are consistent with prior literature. The results on geographic
diversification for the US are also consistent with prior literature.
The results for Germany and Japan show international diversification can be negative. In
Germany and Japan it is for pure multinationals. In Germany the impact of industrial
diversification is positive for the multinational conglomerates.
Further, regional sales also impact firm value. International sales in regions closer to
home reduce firm value (European sales for UK firms and Australasian sales for Japanese firms),
Australasian sales increase firm value for UK and US firms. These results are consistent with the
argument that distance matters.
There are several differences in the results across the four countries in the sample. A few explanations are proposed but this needs further investigation. A possible hypothesis is that
differences in the institutional framework across the countries drive the differences in the
industrial and geographic premium or discount. For example, Lins and Servaes (1999) provide
evidence that firms with a strong keiretsu affiliation have greater value loss from industrial
diversification than firms without such an affiliation. However, if keiretsu firms are more successful than the average firm, they are more likely to expand abroad and the premium for
multinational conglomerates in Japan could be associated with keiretsu affiliation.
Cultural factors could also be another possible reason for the difference in the impact of
industrial and international diversification. Cultural and political barriers curtailed Japanese
expansion abroad in the 80s and the 90s, which suggests that many firms had no option but to expand domestically across multiple lines of business. As discussed previously in the data
section, the number of domestic conglomerates in Japan far outnumbers the number of
REFERENCES
Berger, Philip, and Eli Ofek (1995) ‘Diversification’s effect on firm value’, Journal of Financial Economics 37, 39-65.
Bodnar, Gordon, Charles Tang, and Joseph Weintrop (1999) ‘Both sides of corporate diversification: The value impacts of geographic and industrial diversification. National Bureau of Economic Research Working Paper 6224.
Buckley, Peter J. & Mark Casson (1976) The Future of the Multinational Enterprise, New York: Holmes & Meier Publishers.
Buhner R. (1987) ‘Assessing international diversification of West German corporations,’
Strategic Management Journal 8, 25-37.
Campa, Jose Manuel, and Simi Kedia (2002) ‘Explaining the diversification discount’ Journal of Finance 57, 1731-1762.
Caves, Richard (1971) ‘Internatio nal corporations: The industrial economics of foreign investment’, Econometrica 38, 1-27.
Caves, Richard (1996) Multinational enterprise and economic analysis. Cambridge University Press.
Chang, S. J. (1992) ‘A knowledge-based perspective on corporate growth: Entry exit, and economic perspective during 1981-1989,’ unpublished Ph.D. dissertation, University of Pennsylvania, Philadelphia, PA.
Christophe, S.E. and Pfeiffer Jr, R.J. (1998) ‘The valuation of US MNC international operations during the 1990s’, Working paper, George Mason University.
Click, R. and Harrison, P. (2000) ‘Does multinationality matter? Evidence of value destruction in US multinational corporations’, Working paper, Federal Reserve Board.
Dastidar, Protiti (2003) ‘Are pure multinationals worth more than the sum of their parts?’, Working Paper, George Washington University.
Dastidar, Protiti (2003) ‘Do pure multinationals choose to diversify internationally?’, Working Paper, George Washington University.
Delios and Beamish (1999) ‘Geographic scope, product diversification and the corporate performance of Japanese firms,’ Strategic Management Journal 20, 711-727.
Denis, David J., Diane K. Denis, and Keven Yost (2002) ‘Global diversification, industrial diversification, and firm value’, Journal of Finance 57: 1951-1979.
Doukas, J. and Lang, L. (2003) ‘Foreign direct investment, diversification, and firm performance’, Journal of International Business Studies 34: 153-172.
Doukas, J. and Travlos, N.G. (1988) ‘The effects of corporate multinationalism on shareholders’ wealth: evidence from international acquisitions’, Journal of Finance 43: 1161-1175.
Dunning, J.H. (1973) ‘The determinants of international product’, Oxford Economic Papers 25: 289-336.
Dunning, J.H. (1998) ‘Location and the multinational enterprise: A neglected factor?,’ Journal of International Business Studies 29, 45-66.
Errunza, V., and Lemma Senbet (1981) ‘The effects of international operations on market value of the firm: Theory and evidence’, Journal of Finance 36, 401-417.
Errunza, V., and Lemma Senbet (1984) ‘International corporate diversification, market valuation and size-adjusted evidence’, Journal of Finance 34, 727-745.
Fauver, Larry, Joel Houston, and Andy Naranjo (2003) ‘Firm level evidence on the value of international diversification,’ Journal of Corporate Finance, forthcoming.
Franko, L. G. (1976) The European multinationals: A renewed challenge to American and British big business, (Stamford, CT: Greylock.)
Geringer J., P. Beamish, and R. daCosta (1989) ‘Diversification strategy and internalization: Implications for MNE performance,’ Strategic Management Journal 10, 109-119.
Grant R. M. (1987) ‘Multinationality and performance among British manufacturing companies,’
Journal of International Business Studies 22, 249-263.
Grant R. M., A. P. Jammine, and H. Thomas (1988) ‘Diversity, diversification, and profitability among British manufacturing companies, 1972-1984,’ Academy of Management Journal 31, 771-801.
Griffin, John M., and G. Andrew Karolyi (1998) ‘Another look at the role of the industrial structure of markets for international diversification strategies’, Journal of Financial Economics
50, 351-373.
Harrison, J.S., M. A. Hitt, R. E. Hoskisson, and R. D. Ireland (1991) Synergies and post-acquisition performance: Similarities versus differences in resource allocations,’ Journal of Management 17, 173-190.
Hennart, J. F. and Y. R. Park (1993) ‘Greenfield vs. acquisition: The strategy of Japanese investors in the United States,’ Management Science 39, 1054-1070.
Hisey, K. B. and R. E. Caves (1985) ‘Diversification strategy and the choice of country: Diversifying acquisitions abroad by U.S. multinationals, 1978-1980,’ Journal of International Business Studies 16, 51-64.
Hitt, M., R. Hoskisson, and H. Kim (1997) ‘International diversification: Effects on innovation and firm performance in product-diversified firms,’ Academy of Management Journal 40, 767-798.
Hitt, M. A., B. W. Keats, and S. M. DeMarie (1995) ‘Navigating in the new competitive landscape: Building competitive advantage and strategic flexibility in the 21st century,’ Paper presented at the annual meeting of the Strategic Management Society, Mexico City.
Jensen, Michael C. (1986) ‘Agency costs of free cash flow, corporate finance, and takeovers’,
American Economic Review 76, 323-329.
Kim W. C., P. Hwang, and W. P. Burgers (1989) ‘Global diversification strategy and corporate profit performance,’ Strategic Management Journal 10, 45-57.
Kim W. C., P. Hwang, and W. P. Burgers (1993) ‘Multinationals’ diversification and the risk-return tradeoff,’ Strategic Management Journal 14, 275-286.
Kobrin S. J. (1991) ‘An empirical analysis of the determinants of global integration,’ Strategic Management Journal 12 (special issue), 17-37.
Kogut, B. (1983) ‘Foreign direct investment as a sequential process, Charles P. Kindelberger and David, eds.: The Multinational Corporations in the 1980’s (MIT Press, Cambridge, MA.)
Kogut, B. and S. J. Chang (1991) ‘Technological capabilities and Japaneseforeign direct investment in the United States,’ Review of Economics and Statistics 73, 401-413.
Kotabe, M. (1990) ‘The relationship between offshore sourcing and innovativeness of US multinational firms: An empirical investigation,’ Journal of International Business Studies 21, 623-638.
Krainer, R. E. (1967) ‘Resource endowment and the structure of foreign investment’, Journal of Finance 22, 49-57.
La Porta, R., F. Lopez-de-Silanes, and A. Shleifer (1999) ‘Corporate ownership around the world’ Journal of Finance 54, 471-517.
Lang, Larry H., and René M. Stulz (1994) ‘Tobin’s q, corporate diversification, and firm performance’, Journal of Political Economy 102, 1248-1280.
Lins, Karl, and Henri Servaes (1999) ‘International evidence on the value of corporate diversification’, Journal of Finance 54, 2215-2240.
Morck, Randall, and Bernard Yeung (1991) ‘Why investors value multinational diversification’,
Morck, Randall, and Bernard Yeung (1998) ‘Why firms diversify: Internalization vs. agency behavior’, Working Paper, University of Alberta and University of Michigan.
Myers, Stewart (1977) ‘The determinants of corporate borrowing’, Journal of Financial Economics 5, 147-175.
Porter, M. E. (1985) Competitive advantage, New York: Free Press
Rugman, A. M. (1981) ‘Inside the multinationals: The economics of international markets,’ London, Croom Helm.
Rummelt R. P. (1974) ‘Strategy, structure, and economic performance,’ Cambridge, MA. Harvard University Press.
Shin, Han, and René M. Stulz (1998) ‘Are internal markets efficient?, Quarterly Journal of Economics 46, 3-28.
Stein, Jeremy (1997) ‘Internal capital markets and the competition for corporate resources’,
Journal of Finance 52, 111-133.
Stulz, René (1990) ‘Managerial discretion and optimal financing policies’, Journal of Financial Economics 26, 3-28.
Sundaram, A. K. and J. S. Black (1992) ‘The environment and internal organization of multinational enterprises,’ Academy of Management Review 17, 729-757.
Table 1: Sample Description
This table describes the distribution of the sample across time, nationality, and industry. All data are from Worldscope. The total number of firm years in the sample (16,146) is divided by country and type of diversification. ID is a dummy that equals one for firms that are industrially diversified and zero otherwise. GD is a dummy that equals one for firms that are geographically diversified and zero otherwise. The sample includes firms headquartered in Germany, Japan, the UK, and the US. Panel A provides a breakdown of firms by year and type of diversification. Panel B provides a breakdown by industry. Panel C provides a breakdown by geographic segment. The analysis is based on 2-digit SIC codes that are grouped together for presentation. Geographic segments are grouped into five regions (domestic, Australasia, Europe, North America, and the rest of the world). The Australasian sample includes domestic single industry firms from Australia, Hong Kong, Japan, New Zealand, and Singapore; Europe includes Austria, Belgium, Denmark, Finland, Germany, Ireland, Italy, Netherlands, Norway, Spain, Sweden, Switzerland, and the UK; North America includes Canada and the US; and the world includes Brazil, Chile, China, Columbia, Czech Republic, Egypt, Greece, India, Indonesia, Israel, Morocco, Mexico, Malaysia, Pakistan, Peru, Philippines, Poland, Portugal, Russia, South Africa, South Korea, Taiwan, Thailand, Turkey, Venezuela, and Zimbabwe.
Panel A
Country ID,GD 1990 1991 1992 1993 1994 1995 1996 1997 1998 Total
Germany 0,0 35 20 16 26 24 25 29 31 51 257 0,1 12 18 20 19 18 21 31 25 36 200 1,0 10 19 15 14 16 16 23 27 13 153 1,1 24 25 24 25 38 36 39 42 33 286 Subtotal 81 82 75 84 96 98 122 125 133 896
Japan 0,0 839 368 346 324 310 344 335 325 341 3,532 0,1 0 35 42 34 44 46 34 40 156 431 1,0 90 400 433 402 401 359 331 338 429 3,183
1,1 4 29 32 27 28 22 36 34 155 367
Subtotal 933 832 853 787 783 771 736 737 1,081 7,513
UK 0,0 96 41 39 32 30 41 42 58 63 442 0,1 29 37 30 28 33 37 43 45 41 323 1,0 11 21 18 17 26 21 24 21 24 183 1,1 33 68 52 32 30 40 44 48 30 377
Subtotal 169 167 139 109 119 139 153 172 158 1,325
US 0,0 597 240 252 264 310 396 438 493 458 3,448
0,1 15 78 96 92 142 139 187 218 247 1,214 1,0 46 110 111 113 128 151 144 151 152 1,106
1,1 24 48 70 77 77 77 77 86 108 644
Table 1 - continued
Panel B: Breakdown by Industry (2-digit SIC code)
Industry GE JP UK US
Agriculture, Forestry, And Fishing (0-9) 8 32 16 58
Mining and construction (10-19) 65 1,284 165 631
Manufacturing (20-39) 562 3,775 510 2,944
Transportation, Communications, Electric, Gas, And Sanitary Services (40-48) 93 816 174 680
Wholesale and retail trade (50-59) 94 876 248 1,089
Services and Public Administration (70-99) 74 730 212 1,010
Total 896 7,513 1,325 6,412
Panel C: Number of Geographic Segments by Region
Australasia Europe North America World Domestic Total
Germany 118 315 198 461 895 1,987 Japan 195 130 195 690 7,507 8,717
Table 2: Univariate Statistics
This table provides univariate firm characteristics averaged over the period from 1990 to 1998. ID is a dummy that equals one for firms that are industrially diversified and zero otherwise. GD is a dummy that equals one for firms that are geographically diversified and zero otherwise. Market value and sales figures are in US dollars. Leverage is the ratio of total debt to total assets. Q is the sum of the market value of equity plus the book value of debt plus current liabilities divided by total assets. All of the accounting variables data are from Datastream. The accounting variables are considered to be common across countries and hence have maximum comparability across borders according to Datastream.
Country ID,GD
Market
Capitalization Sales Leverage Log(Assets) Q
Ln(Market Cap. / Sales)
Number of Geographic Segments
Number of Product Segments
Germany 0,0 331169 753112 0.18 12.80 0.93 -0.71 1.00 1.00
0,1 247656 935819 0.22 12.98 0.84 -1.27 3.17 1.00
1,0 186557 413313 0.21 12.62 0.94 -0.83 1.00 2.44
1,1 779917 1844976 0.21 13.41 0.90 -1.16 3.30 2.69
Japan 0,0 1591548 1900972 0.27 13.44 1.72 -0.31 1.00 1.00
0,1 1702381 3171854 0.32 13.87 1.45 -0.57 2.43 1.00
1,0 842658 1353403 0.29 13.36 1.51 -0.52 1.00 2.55
1,1 4742151 7651510 0.37 14.81 1.46 -0.59 2.60 2.33
UK 0,0 1326118 1605851 0.19 12.95 1.48 -0.27 1.00 1.00
0,1 1781965 1165486 0.23 12.71 1.67 -0.24 3.13 1.00
1,0 1361192 1351788 0.23 12.74 1.42 -0.09 1.00 2.37
1,1 3064403 3373944 0.21 13.62 1.46 -0.51 3.40 2.77
US 0,0 1320164 1688318 0.27 13.01 1.82 -0.42 1.00 1.00
0,1 3264977 2529971 0.21 13.39 2.14 -0.07 2.54 1.00
1,0 1522930 1749562 0.30 13.46 1.42 -0.51 1.00 2.34
Table 3: Effect of Industrial and International Diversification for Firms by Country
The dependent variable is the log of average annual market capitalization to sales. This is regressed on an industrial diversification dummy (ID), which equals one if the firm operates in at least two product segments; an international/geographic diversification dummy (GD), which equals one if the firm operates in at least two regions (domestic, Australasia, Europe, North America, and/or the rest of the world).; leverage (ratio of total debt to total assets); size (log of total assets), and profit margin (profits after tax to total sales). Relative values of the independent variables are the difference between the actual value and the sales weighted benchmark values for each segment that the firm operates in. Data for the explanatory variables are from Datastream. The regressions are pooled OLS regressions with p-values in parentheses.
GE JP UK US
Industrial Diversification (ID) 0.156 -0.061 -0.056 -0.230 (0.08) (0.06) (0.56) (0.00) Geographic Diversification (GD) -0.252 -0.208 -0.065 0.087 (0.00) (0.00) (0.33) (0.00)
Relative Leverage -0.850 -0.661 -0.982 -1.471
(0.00) (0.00) (0.00) (0.00)
Relative Size -0.021 -0.028 -0.014 0.045
(0.02) (0.00) (0.17) (0.00)
Relative Profit Margin 0.001 0.068 0.005 0.000
(0.81) (0.00) (0.03) (0.07)
Industry Dummies Yes Yes Yes Yes
Adjusted R-sq 0.28 0.38 0.35 0.32
N 888 7,511 1,292 6,262
Table 4: Interaction of Industrial and International Diversification for Firms by Country
The dependent variable is the log of average annual market capitalization to sales. This is regressed on an industrial diversification dummy (ID), which equals one if the firm operates in at least two product segments; an international/geographic diversification dummy (GD), which equals one if the firm operates in at least two regions (domestic, Australasia, Europe, North America, and/or the rest of the world); an interaction dummy, which equals one if the firm operates in at least two product segments and at least two regions; leverage (ratio of total debt to total assets); size (log of total assets), and profit margin (profits after tax to total sales). Relative values of the independent variables are the difference between the actual value and the sales weighted benchmark values for each segment that the firm operates in. Data for the explanatory variables are from Datastream. The regressions are pooled OLS regressions with p-values in parentheses.
GE JP UK US
Industrial Diversification (ID) -0.087 -0.086 0.037 -0.229 (0.49) (0.01) (0.75) (0.00) Geographic Diversification (GD) -0.420 -0.288 -0.005 0.088
(0.00) (0.00) (0.95) (0.01) Multinational Conglomerates (ID*GD) 0.390 0.182 -0.163 -0.002 (0.00) (0.00) (0.15) (0.96)
Relative Leverage -0.820 -0.660 -1.006 -1.471
(0.00) (0.00) (0.00) (0.00)
Relative Size -0.024 -0.028 -0.013 0.045
(0.01) (0.00) (0.20) (0.00)
Relative Profit Margin 0.001 0.068 0.005 0.000
(0.74) (0.00) (0.03) (0.07)
Industry Dummies Yes Yes Yes Yes
Adjusted R-sq 0.29 0.38 0.35 0.32
N 888 7,511 1,292 6,262