Int. J. Electrochem. Sci., 9 (2014) 3650 - 3657
International Journal of
ELECTROCHEMICAL
SCIENCE
www.electrochemsci.org
Short Communication
Photoluminescence properties of PADC Irradiated with
Ultraviolet Radiation of Short Wavelength (UVC)
M. El Ghazaly1,2,*, Abdulkadir Aydarous3, Talal A. Al-Thomali1 1
Department of Physiology, College of Medicine, Taif University, P.O. Box 888, Taif, KSA 2
Department of Physics, Faculty of Science, PO 44519, Zagazig, Zagazig University, Egypt 3
Department of Physics, Faculty of Science, Taif University, P.O. Box 888, Taif, KSA *
E-mail: ghazaly2000@yahoo.com
Received: 17 February 2014 / Accepted: 10 March 2014 / Published: 14 April 2014
This study sought to investigate photoluminescence (PL) emission spectra of poly allyl diglycol carbonate (PADC) irradiated with short wavelength ultraviolet radiation of 254 nm. PADC samples were irradiated with UVC of 254 nm from UVC Corsslinker (Hoefer) with different doses ranging from 900 J/cm2 to 180000 J/cm2. The photoluminescence spectra of UV-irradiated PADC were measured with the aid of a spectrofluorometer (FluoroMax-4). The results revealed that the UVC of 254 nm induced modifications in the photoluminescence emission spectra of PADC. While the PL peak position shows insignificant changes, FWHM of PL increased from 9.92 eV of pristine PADC to 11.17 eV of PADC exposed to UVC dose of 900 J/cm2, thereafter no significant changes were observed, irrespective the UVC dose. The photoluminescence peak intensity as well as the integrated photoluminescence intensity increases when there is an increase in the UVC doses and they are linearly correlated with UVC dose. These new findings indicate that it is possible to use photoluminescence emission spectra of PADC in dosimetric applications for ultraviolet radiation of short wavelength over a wide range of doses.
Keywords: Poly allyl diglycol carbonate (PADC); Photoluminescence; Ultraviolet radiation; Photodegradation
1. INTRODUCTION
39 detector [2-4]. Applications for PADC include up-to-date x-ray reflectivity, soft x-ray image detectors, alpha particle autoradiography, neutron and alpha radiography, charged particle spectroscopy, astrophysics, nuclear physics, radon-emanation detection, micro and sub-micro-filters production, in low linear energy transfer radiation dosimetry, and eyeglasses [2,5-12].
The monomer, which is shown in Figure 1 [1], contains three functional groups; these are: Allyl group (CH2═CH─CH2─), ether group (─CH2─O─CH2─), and carbonyl group (C═O). The presence of two Allyl groups leads to both the polymerization of PADC’s monomers and a cross-link which results in a thermoset plastic characterized as being hard, infusible and insoluble in all solvents at room temperature.
O
O
O
O
O
O
O
CH
2CH
[image:2.596.56.556.248.323.2]2
Figure 1. Repeating unit of PADC monomer.
It is a well-established fact that PADC can be degraded by low linear energy transfer (LLET) radiation such as X-and gamma rays and ultraviolet radiation, which was intensively investigated in many studies [13-16]. Ultraviolet radiation promotes chemical modifications in PADC via chain scission and photo oxidation, which becomes irreversible as alternations occur in macroscopic and microscopic properties. These induced modifications form the premise to utilize the PADC in ultraviolet radiation dosimetry [17-19]. In principle, ultraviolet radiation induced-modifications can be observed by measuring the net change in the bulk etch rate [19-20], track etch response [21], UV-Vis spectrophotometer, or by FTIR spectroscopy [17-18]. In principle, the photodegradation of PADC by ultraviolet radiation is strongly dependent on the ultraviolet radiation wavelength as highlighted by Tse et al. [17]. While UVA caused no chemical modifications as most UVA photons are not absorbed by PADC, it is found that ultraviolet radiation exposures of short wavelengths significantly changes the properties of PADC through photo-oxidation and different processes, which rely on the UV wavelength.
The focus of the present study is to investigate the photoluminescence emission spectra of PADC irradiated with different doses of ultraviolet radiation of 254 nm. The emphasis will be on the ultraviolet radiation of short wavelength of 254 nm dependent photoluminescence measurements. Additionally, the study will examine the use of photoluminescence emission spectra of PADC in ultraviolet dosimetric applications by measuring the integrated intensity, peak position, FWHM and peak intensity of PL band as a function of UVC doses.
2. METHODOLOGY
2.1. Materials
Poly allyl diglycol carbonate (PADC) sheets manufactured by TASTRAK (Track Analysis System Ltd., UK), with a density of 1.3 and a molecular composition (C12H18O7) of a thickness of 1000 µm were cut into pieces of 4 cm2
with the aid of a laser beam [24].
2.1. Irradiation
PADC samples were exposed to different doses of ultraviolet radiation of short wavelength of 254 nm (UVC) in air at room temperature in an ultraviolet radiation Crosslinker (Hoefer, UVC 5000 Ultraviolet Crosslinker) [25]. This UV Crosslinker is capable of producing variable doses of ultraviolet radiation up to 999.9 mJ/cm2.
2.3. Measurements
The photoluminescence spectra were measured with a FluoroMax-4 spectrofluorometer (Horiba) [26]. Excitation wavelengths were emitted from a high-pressure xenon lamp dispersed by a grating monochromator. The Florescent light is detected by a photomultiplier through a second grating monochromator. To avoid the saturation spectrometer detector, the slits of the excitation wavelength and emission wavelength are adjusted to 0.5 nm and the lack of fluorescence emission intensity was compensated by increasing the integration time of the detector to 0.5 seconds. The PADC was adjusted with an angle of 30º relative to the excitation wavelength to minimize the first and second order of diffraction. All samples were excited using a wavelength of 350 nm (3.54 eV) and the emission spectra were measured within a step of 1 nm in the range 350-to-650 nm. All measurements were performed at a constant temperature of 25 ºC.
3. RESULTS AND DISCUSSION
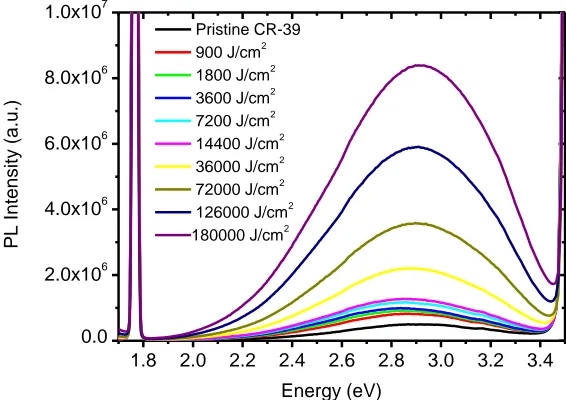
the increase of the UVC dose. However, this discoloration indicates the PADC has been degraded under effect of UVC, due to many concurrent chemical processes taking place in PADC which results in several different modes of damage [17]. Ultraviolet radiation of short wavelength (UVC) of 254 nm has enough energy of 4.88 eV to cleave the bonds in PADC chains with the production of free radicals [18], which initiates further complex reaction to molecular oxygen. The photodegradation will give rise to modifications in the electrochemical and optical properties of PADC. The photoluminescence of a UVC irradiated PADC sample is located between the first order diffraction at 3.54 eV (350 nm) and the second order diffraction at 1.77 nm (700 nm) of the excitation monochromater grating, both diffraction orders are minimized by positioning the PACD at an angle of 30º relative to the excitation light. Photoluminescence spectra shown in the Figure 2, which occurred between first and second order diffractions, revealed the influence of various dose of ultraviolet radiation of 254 nm on the photoluminescence emission of PADC, which was excited with 350 nm.
1.8 2.0 2.2 2.4 2.6 2.8 3.0 3.2 3.4
0.0 2.0x10⁶ 4.0x10⁶ 6.0x10⁶ 8.0x10⁶ 1.0x10⁷
PL
Int
ens
it
y
(a.
u.
)
Energy (eV)
[image:4.596.157.440.310.510.2]Pristine CR-39 900 J/cm2 1800 J/cm2 3600 J/cm2 7200 J/cm2 14400 J/cm2 36000 J/cm2 72000 J/cm2 126000 J/cm2 180000 J/cm2
Figure 2. Photoluminescence spectra of a pristine and UVC-irradiated PADC with different doses. The excitation wavelength was 350 nm.
The reported results are similar to the results obtained by Diepens et al. [27] on bisphenol A polycarbonate (BPA-PC), which show an increase in photoluminescence intensity as the exposure time to ultraviolet radiation is increased.
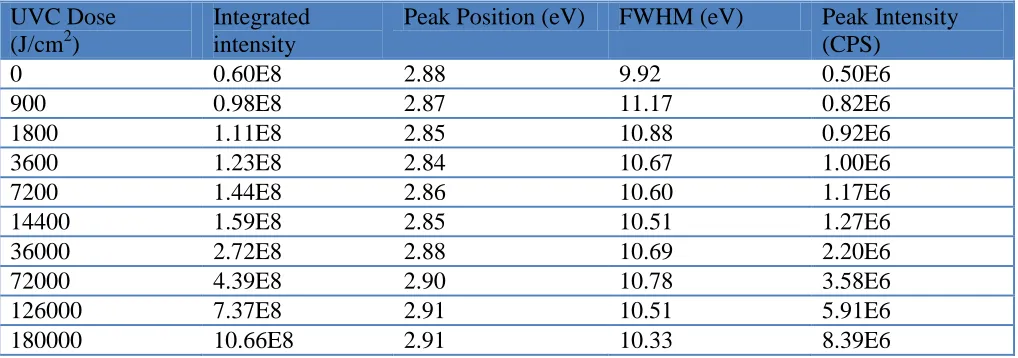
linking occurs due to the fact that free radicals migrate and recombine with other radicals or the main chain. Cross linking results in the formation of molecules of higher weight which may undergo irradiative recombination upon excitation with a wavelength of 350 nm. The photoluminescence emission spectra can be characterized through four parameters, which include integrated intensity, peak position, FWHM, and peak intensity, which are summarized in Table1.
[image:5.596.45.554.370.549.2]The results show a significant increase in the width of the photoluminescence spectrum from 9.92 eV for un-irradiated PADC to 11.17 eV for PADC exposed to 900 J/cm2. For higher doses, no significant changes were observed. The broadening of the PL FWHM suggests that the occurrence of intra- and inter-chain energy transfer processes towards chromophores with the largest effective conjugation length produces the lowest HOMO-LUMO energy gaps. Two distinct mechanisms contribute to the broadening of the photoluminescence spectra of UVC-irradiated PADC: they are the production of new compounds as a result of photodegradation by UVC, and the increase in CR-39 surface roughness.
Table 1. Parameters of the photoluminescence emission spectra PADC irradiated with different doses of UVC of 254 nm.
UVC Dose (J/cm2)
Integrated intensity
Peak Position (eV) FWHM (eV) Peak Intensity (CPS)
0 0.60E8 2.88 9.92 0.50E6
900 0.98E8 2.87 11.17 0.82E6
1800 1.11E8 2.85 10.88 0.92E6
3600 1.23E8 2.84 10.67 1.00E6
7200 1.44E8 2.86 10.60 1.17E6
14400 1.59E8 2.85 10.51 1.27E6
36000 2.72E8 2.88 10.69 2.20E6
72000 4.39E8 2.90 10.78 3.58E6
126000 7.37E8 2.91 10.51 5.91E6
180000 10.66E8 2.91 10.33 8.39E6
Figure 2 also showed the increase in the integrated photoluminescence which suggests the nonradiative recombination rate is enhanced in comparison to the irradiative one. Such an enhancement can be attributed to one of the following mechanisms: an increase in the surface density states, or an increase in surface roughness of PADC.
D b a D
P( ) 1 1 , (1)
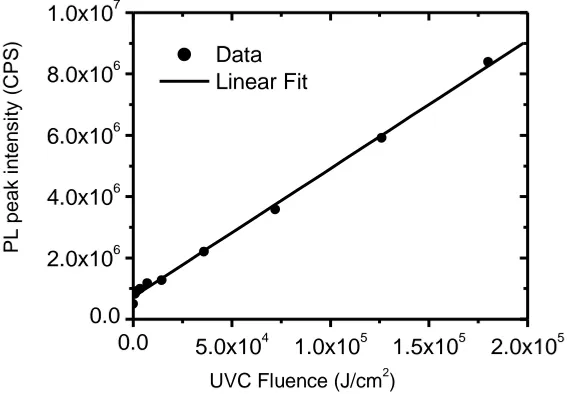
where D is the UVC dose measured in (J/cm2) a1 and b1 are fitting parameters and amount to
(727190±54843) and (150677±2661), respectively. From the calibration curve, b1 which is the
gradient of the straight line represents the sensitivity of PADC to UVC of 254 nm, it amounts to (150677±2661) CPS/(J/cm2
) . However, this sensitivity is higher than those achieved by UV-Vis spectrophotometer, which pointed out by Tse et al. [17-18].
0.0 5.0x10⁴
1.0x10⁵ 1.5x10⁵ 2.0x10⁵ 0.0
2.0x10⁶ 4.0x10⁶ 6.0x10⁶ 8.0x10⁶ 1.0x10⁷
Data Linear Fit
PL peak i
n
ten
si
ty (CPS)
UVC Fluence (J/cm2)
Figure 3. Dependence of photoluminescence peak intensity of PADC on the UVC dose, the excitation wavelength is 350 nm. Solid line indicates linear fitting of the experimental data with Eq.1.
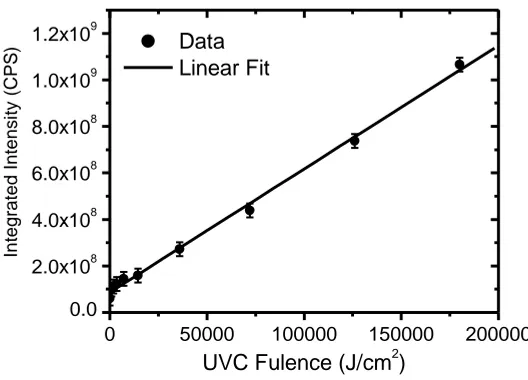
The integrated photoluminescence intensity as a function of UVC dose is shown in Figure 3. The photoluminescence intensity was found to increase appreciably with UVC dose indicating positive UVC effect. The linear increase of photoluminescence intensity may be attributed to formation of irradiative recombinations of compounds formed either by scission of the functional groups such as C– C, C–H and C–O, in addition to OH and OOH formation upon irradiation with UVC [18]. The data are fitted using the following linear equation;
D b a D
A( ) 2 2 , (2)
D is the UVC dose measured in J/cm2. Both a2 and b2 are the fitting parameters; they amount
to (8.65594E7±1.18157E7) and (5305±159), respectively. The parameter b2 is a calibration factor
[image:6.596.157.441.197.394.2]
0 50000 100000 150000 200000
0.0 2.0x10⁸ 4.0x10⁸ 6.0x10⁸ 8.0x10⁸ 1.0x10⁹
1.2x10⁹ Data
Linear Fit
In
te
g
ra
te
d
I
n
te
n
si
ty (
CP
S
)
[image:7.596.165.429.104.294.2]UVC Fulence (J/cm2)
Figure 4. Integrated photoluminescence intensity dependence on the dose of ultraviolet radiation of 254 nm of PADC, the excitation wavelength is 350 nm. Solid line is a linear fit to the experimental data with Eq.2.
4. CONCLUSIONS
Throughout this paper, we have investigated the effects of short wavelength ultraviolet radiation of 254 nm dose on the photoluminescence intensity of PADC. The photoluminescence emission of PADC exhibits a strong dependence on the dose of UVC of 254 nm. The results revealed that the UVC induced modifications to the photoluminescence emission spectra of PADC upon exposure to short wavelength ultraviolet radiation of 254 nm. While the PL peak position shows insignificant changes, FWHM of PL increases from 9.92 eV of pristine PADC to 11.17 eV of PADC exposed to UVC dose of 900 J/cm2, thereafter no significant changes were observed irrespective of the UVC dose. The photoluminescence peak intensity as well as the integrated photoluminescence intensity increases linearly with the UVC doses. The current findings are recommended to maximize the use of photoluminescence emission spectra of PADC in high UV dose measurements.
References
1. J. Stejny, Rad. Pro. and Dosim., 20 (1-2) (1987) 31. 2. D. Nikezic and K.N. Yu, Mater. Sci. Eng., 46 (2004) 51. 3. D.L. Henshaw, Physics in Technology, 13 (6) (1982) 266.
4. S.A. Durrani, R.K. Bull, Sloid State Nuclear Track Detection, (Pergamon Press, Oxford) (1987). 5. K.Oguraa, H.Yanagie, M.Eriguchib, E.H. Lehmannc, G. Kuehne, G.Bayond and H.Kobayashie,
Appl. Radiat. Isot. 61 (2004) 585.
Instrum. Meth. B. 187 (3) (2002) 361.
7. D. Hermsdorf, A. Mahmood, Radiat. Meas., 58 (2013) 101. 8. M. El Ghazaly, Radiat. Eff. Def. Solids, 176 (6) (2012) 412.
9. M. El Ghazaly, T.T. Salama, EI Khalil, Kh. M. Abd El Raouf, J. Korean Phys. Soc. 61(6) (2012) 336.
10.M. El Ghazaly, J. Korean Phys. Soc., 59 (1) (2011) 55.
11.M. El Ghazaly, Kh. M. Hella, E. I. Khalil, Arab J. Nucl. Sci. Appl, 43 (2010) 185. 12.Said Rahmana, Matiullahb, B.M. Ghauria, Radiat. Meas., 45 (2) (2010) 274.
13.F. Abu-Jarad, M. A. Islam, I. Abuaboun, M. A. Khan, Radiat. Meas. (19) (1991) 135. 14.F. Abu-Jarad, M. El Hadidy, M. I. Al-Jarallah, Radiat. Meas., 28 (1997) 409.
15.N. Dwaikat, F. Sato, Y. Kato, T. Iida, Nucl. Instrum. Meth. A 584 (2008) 353.
16.T. Sharma, S. Aggarwal, S. Kumar, V. K. Mittal, P. C. Kalsi, V. K. Manchanda J. Mater. Sci. 42 (2007) 1127.
17.K.C.C. Tse, F.M.F. Ng, K. N. Yu, Poly. Degrad. Stabil., 91(10) (2006) 2380.
18.K.C.C. Tse, nvestigations of the effects of UV irradiation on the etching behavior of CR-39 solid state nuclear track detector, City University of Hong Kong (2007).
19.C.F. Wong, S.Toomey, R.A. Fleming, B.W. Thomas, Health Phys. 68(2) (1995) 175. 20.G. Hussain, Int. J. Appl. Radiat. Isot. (33) (1982) 517.
21.A.H. Khayrat, S.A. Durrani, Radiat. Meas. 25 (1995) 163.
22.Elsayed K. Elmaghraby and Talat A. Salama, Radiat. Eff. Def. Solids, 165 (4) (2010) 321. 23.Talat A. Salama and Elsayed K. Elmaghraby, Radiat. Prot. Dosim. 140(3) (2010) 218. 24.http://www.tasl.co.uk/plastics.php Access in: Dec. 2013
25.http://www.hoeferinc.com/index.php/uvc5000-ultraviolet-crosslinker.html Access in: Oct. 2013 26.
http://www.horiba.com/us/en/scientific/products/fluorescence-spectroscopy/steady-state/fluoromax/fluoromax-compact-spectrofluorometer-524/ Access in: Dec. 2013 27.M. Diepens, Photodegradation and Stability of Bisphenol A Polycarbonate in Weathering
Conditions; EindhovenUniversity of Technology: The Netherlands, 2009.
28.R. Shweikani, G. Raja and A. A Sawaf, Nucl. Tracks Radiat. Meas., 35 (2002) 282.