http://eprints.whiterose.ac.uk/148031/
Version: Published Version
Monograph:
Mazzone, P. orcid.org/0000-0003-0944-8031, Carlton, J. orcid.org/0000-0002-9373-7663 and Griffiths, H. orcid.org/0000-0003-4286-5371 (2019) Summary vision screening data : Luxembourg. Report. Vision Screening Country Reports . EUScreen
©2019 EUScreen. For reuse permissions, please contact the publisher.
[email protected] https://eprints.whiterose.ac.uk/ Reuse
Items deposited in White Rose Research Online are protected by copyright, with all rights reserved unless indicated otherwise. They may be downloaded and/or printed for private study, or other acts as permitted by national copyright laws. The publisher or other rights holders may allow further reproduction and re-use of the full text version. This is indicated by the licence information on the White Rose Research Online record for the item.
Takedown
If you consider content in White Rose Research Online to be in breach of UK law, please notify us by
Summary Vision Screening Data: Luxembourg
Produced as part of Work Package 3
Paolo Mazzone1, Dr Jill Carlton2, Dr Helen Griffiths3
1. Research Assistant, School of Health and Related Research, University of Sheffield, United Kingdom (UK)
2. Senior Research Fellow, School of Health and Related Research, University of Sheffield, United Kingdom (UK)
3. Senior Lecturer, Academic Unit of Ophthalmology and Orthoptics, University of Sheffield, United Kingdom
(UK)
Information provided by Beatrice Bogdan, Orthoptist, Head of Orthoptic Service, Ministry of Health
23rd January 2019
Disclaimer: This is a summary report representing the responses from a country representative working within eye care services of the country reported. This report does not represent conclusions made by the authors, and is the product of professional research conducted for the EUSCREEN study. It is not meant to represent the position or opinions of the EUSCREEN study or its Partners. The information cannot be fully verified by the
authors and represent only the information supplied by the country representatives.
T E U H
ii
Contents
1. Glossary of Terms: Vision Screening iii
2. Abbreviations vi
3. Population and Healthcare Overview 1
4 Vision Screening Commissioning and Guidance 3
5 Screening programme 4
5.1 Vision screening Preterm babies 4
5.2 Vision screening - Birth to 3 months 4
5.3 Vision screening - 3 months to 36 months 4
5.4 Vision screening - 36 months to 7 years 4
6 Automated Screening 9
7 Provision for Visually Impaired 10
8 Knowledge of existing screening programme 11
8.1 Prevalence/Diagnosis 11
8.2 Coverage 11
8.3 Screening evaluation 11
8.4 Treatment success 11
9 Costs of vision screening in children 13
9.1 Cost of vision screening 13
9.2 Cost of treatment for amblyopia 13
9.3 Cost of Treatment for strabismus 13
9.4 Cost of treatment for cataract 13
Summary Vision Screening Data: Luxembourg
iii
1. Glossary of Terms: Vision Screening
Abnormal test result A test result where detected under good conditions. The result on screening
Attendance rate The proportion of all those invited for screening that are tested and receive a result:
Invited for screening includes all those that are offered the screening test.
T
Attendance rate provides information on the willingness of families to participate in screening.
Compliance with referral (percentage)
The percentage of those who are referred from screening to a diagnostic assessment that actually attend the diagnostic assessment.
Percentage of compliance provides information on the
willingness of families to attend the diagnostic assessment after referral from screening.
Coverage The proportion of those eligible for screening that are tested and receive a result:
Eligible for screening includes those within the population that are covered under the screening or health care programme.
T
Factors such as being offered screening, willingness to
participate, missed screening, ability to complete the screen, and ability to document the screening results will influence the coverage.
False negatives The percentage of children with a visual deficit (defined by the
iv 1%.
False positives The percentage of children with normal vision that are referred from screening to a diagnostic assessment.
Guidelines Recommendations or instructions provided by an authoritative body on the practice of screening in the country or region.
Vision screening professional
A person qualified to perform vision screening, according to the practice in the country or region.
Inconclusive test result
A
detected due to poor test conditions or poor cooperation of the child.
Invited for screening Infants/children and their families who are offered screening.
Outcome of vision screening
An indication of the effectiveness or performance of screening, such as a measurement of coverage rate, referral rate, number of children detected, etc.
Untreated amblyopia Those children who have not received treatment for amblyopia due to missed screening or missed follow-up appointment.
Persistent amblyopia Amblyopia that is missed by screening, or present after the child has received treatment.
Positive predictive value
The percentage of children referred from screening who have a confirmed vision loss.
For example, if 100 babies are referred from screening for diagnostic assessment and 10 have normal vision and 90 have a confirmed visual defect, the positive predictive value would be 90%.
Prevalence The percentage or number of individuals with a specific disease or condition. Prevalence can either be expressed as a percentage or as a number out of 1000 individuals within the same
demographic.
Programme An organised system for screening, which could be based nationally, regionally or locally.
Protocol Documented procedure or sequence for screening, which could include which tests are performed, when tests are performed, procedures for passing and referring, and so forth.
Quality assurance A method for checking and ensuring that screening is functioning adequately and meeting set goals and benchmarks.
Summary Vision Screening Data: Luxembourg
v
Risk babies / Babies at-risk
All infants that are considered to be at-risk or have risk-factors for vision defects/ophthalmic pathology according to the screening programme.
Two common risk factors are admission to the neonatal-intensive care unit (NICU) or born prematurely. However, other risk factors for visual defects may also be indicated in the screening
programme.
Sensitivity The percentage of children with visual defects that are identified via the screening programme.
For example, if 100 babies with visual defects are tested, and 98 of these babies are referred for diagnostic assessment and 2 pass the screening, the sensitivity is 98%.
Specificity The percentage of children with normal vision that pass the screening.
For example, if 100 babies with normal vision are tested, and 10 of these babies are referred for diagnostic assessment and 90 pass the screening, the specificity is 90%.
Target condition The visual defect you are aiming to detect via the screening programme.
vi
2. Abbreviations
GDP Gross Domestic Product
GP General Practitioner
NICU Neonatal-intensive care unit
PPP Purchasing Power Parity
ROP Retinopathy of Prematurity
VA Visual Acuity
Summary Vision Screening Data: Luxembourg
1
3. Population and Healthcare Overview
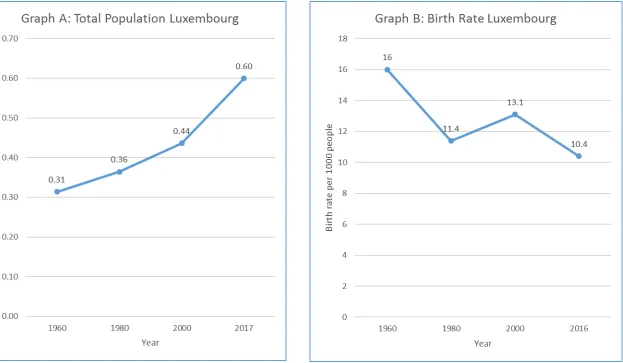
The population of Luxembourg is 599,449 (World Bank, 2018a) and the birth rate was estimated at 10.4 births/1,000 population in 2016 (World Bank, 2018b). The change in population and birth rate from 1960 to 2017 is shown in Figure 1, graphs A and B respectively.
Luxembourg had an estimated population density of 232 people per square kilometre in 2017 and this has risen from 169 people per square kilometre in 1961 (World Bank, 2018c). In terms of healthcare facilities, the total density of hospitals in 2013 was 1.13 per 100,000 population (WHO, 2016a). Infant mortality in 2017 is estimated at 2.1 deaths/1,000 live births in total (World Bank, 2018d).
2
Figure 1: Change in the Total Population and Birth Rate in Luxembourg between 1960 and 2016/2017
Summary Vision Screening Data: Luxembourg
3
4 Vision Screening Commissioning and Guidance
Vision screening is organised nationally with no regional variation in protocols. It is funded by the state. It is not embedded into a general preventative child healthcare system. The content of the vision screening programme is decided upon by the Health Directorate, Orthoptic Service. Vision screening was implemented for pre-school children in 1969 and for infants in 1971.
Review of the vision screening programme, how revisions are funded and how and when they take place is not defined. Since its implementation, the vision screening programme has changed in terms of the ages that screening takes place and the use of an autorefractor. The date for these changes is not known.
In Luxembourg, vision screening takes place at the headquarter of the Orthoptic Service and in 7 other locations rented by the Orthoptic Service, including kindergartens, public schools and schools. The professionals that perform vision screening are orthoptists and nurses. However, there are only nine orthoptists active in the screening programme. No other general professionals have been identified that do not screen, but could do so with additional training. There is no organised, specific training in order to perform vision screening.
4
5 Screening programme
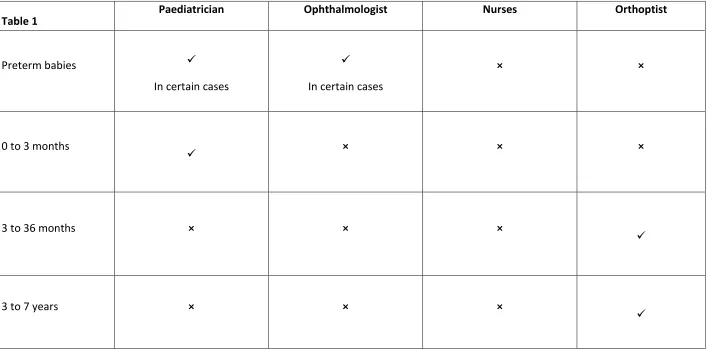
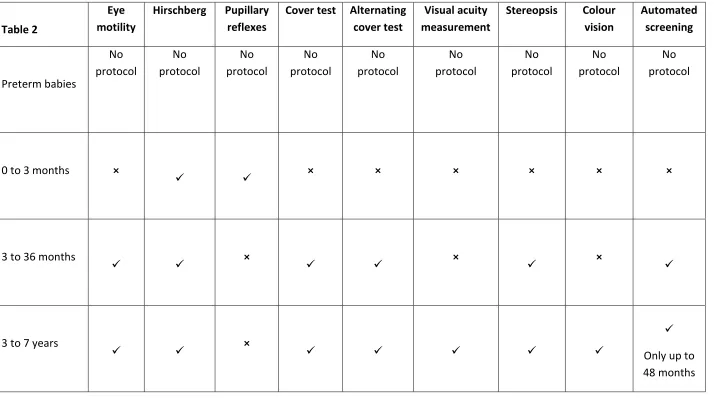
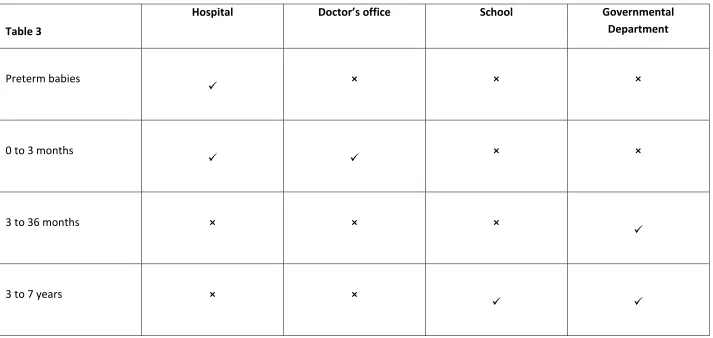
The target conditions screened for by vision screening include retinopathy of prematurity (ROP), amblyopia, reduced visual acuity, refractive error, colour vision defects, manifest and leatent strabismus, and anisocoria. The health care professionals delivering vision screening, venue for screening and tests used vary depending on the age of the child as shown in Tables 1, 2 and 3 respectively. Specific details of the screening offered within each age group are described more fully in sections 5.1 to 5.4 below.
5.1 Vision screening Preterm babies
Preterm babies are checked by an ophthalmologist during their stay in the hospital if risk factors due to prematurity are fulfilled. These factors are not known. The child is referred for further diagnostic examination when any pathology is apparent.
5.2 Vision screening - Birth to 3 months
The tests conducted on well, healthy babies up to the age of 3 months include Hirschberg and pupillary reflexes. These tests are performed by a paediatrician in either a hospital or a
-ups; less than 48 hours after birth, at age
1to10 days and 3to 8 weeks. The check-ups are mandatory. The child is referred for further diagnostic examination when any pathology is apparent.
5.3 Vision screening - 3 months to 36 months
Children aged 3 to 36 months are screened at 10 months of age by an orthoptist at a governmental department. The tests used at this age include ocular motility assessment, Hirschberg test, cover test, alternating cover test, stereopsis using the Lang 1 Test and autorefraction using PlusOptix (10 months-48 months). The referral criteria at this age category is not known.
5.4 Vision screening - 36 months to 7 years
Summary Vision Screening Data: Luxembourg
5
If a child is not screened for visual acuity at 36 months, they are tested at 48 months by an orthoptist at governmental departments. The visual acuity measurement is repeated at ages 4 to 5 years and 5to 6 years.
At 36 months, the referral criteria is hyperopia, astigmatism or anisometropia over 1.5 diopters, strabismus, heterophoria, exophthalmia, a difference in reflexes on the autorefractor, or visual acuity different in both eyes of less than 0.6 decimal (0.2 logMAR, 6/9.5 Snellen). I
6
Table 1: Healthcare professionals who conduct vision screening in each age group
[image:13.842.71.778.115.465.2]Table 1
Paediatrician Ophthalmologist Nurses Orthoptist
Preterm babies
In certain cases
In certain cases
× ×
0 to 3 months
× × ×
3 to 36 months × × ×
3 to 7 years × × ×
Summary Vision Screening Data: Luxembourg
7
[image:14.842.71.792.112.510.2]Table 2: Vision screening tests used in vision screening for each age group
Table 2
Eye motility
Hirschberg Pupillary reflexes
Cover test Alternating cover test
Visual acuity measurement
Stereopsis Colour vision Automated screening Preterm babies No protocol No protocol No protocol No protocol No protocol No protocol No protocol No protocol No protocol
0 to 3 months ×
× × × × × ×
3 to 36 months
× × ×
3 to 7 years
×
8
[image:15.842.67.780.135.473.2]Table 3: Location of vision screening for each age group
Table 3
Hospital D School Governmental
Department
Preterm babies
× × ×
0 to 3 months
× ×
3 to 36 months × × ×
3 to 7 years × ×
Summary Vision Screening Data: Luxembourg
9
6 Automated Screening
Automated vision screening is achieved using handheld, portable devices designed to detect presence of refractive error in infants from 6 months of age. It provides objective results and is used to detect amblyopic risk factors. This differs from other methods used to screen children for amblyopia which focus on detection of the actual condition and the resulting visual loss.
Automated refraction screening is used in the context of vision screening in combination with other tests on all children between 10-48 months. These tests are eye motility, Hirschberg test, cover test, alternating cover test, visual acuity measurement, stereopsis and colour vision.
If a child is screened at 36 months, the referral criteria from the automated screening is hyperopia, astigmatism or anisometropia over 1.5 dioptres.
If a child is screened at 48 months, the referral criteria is hyperopia, astigmatism or anisometropia over 1.5 dioptres).
10
7 Provision for Visually Impaired
Summary Vision Screening Data: Luxembourg
11
8 Knowledge of existing screening programme
8.1 Prevalence/Diagnosis
The prevalence of treated, persistent (missed by screening or failed treatment) or untreated amblyopia by the age of 7 years in Luxembourg is unknown. The prevalence of strabismus is reported by the country representative as 1.6% at the age of 4 to 6 years. There is no data available concerning the incidence of the four types of amblyopia (strabismic, refractive, combined mechanism and deprivation).
8.2 Coverage
Ninety-nine percent of children aged 10 months are invited for vision screening. Sixty percent of these children attend the appointments. The rate of attendance is 70% for the all children aged between 10 and 48 months. Children are referred after 1 or 2 abnormal or inconclusive test results; this is determined by the screener. All children aged 4 and 5 years, are invited for the screening in schools.
8.3 Screening evaluation
There is no information pertaining to the percentage of compliance with referral after an abnormal screening test result, as there is no registration or documentation of non-attendance. There is no information concerning the percentage of false negative following vision screening. The percentage of false positive referrals for vision screening is estimated at 10%, with a positive predictive value of a refer estimated at 80%. There is no data available about the sensitivity or specificity of vision screening in Luxembourg.
8.4 Treatment success
There is no data regarding:
the percentage of infants treated per year for congenital eye disorders (including congenital cataract)
the percentage of screened children treated for strabismus or amblyopia before age 7 years
the percentage of all children treated for strabismus or amblyopia before age 7 years
12
Summary Vision Screening Data: Luxembourg
13
9 Costs of vision screening in children
9.1 Cost of vision screening
Vision screening professionals in Luxembourg are estimated to earn an annual salary of 50,000 Euros. The salary costs per hour are not known. It is not known how much it costs to train general preventative child health care screening professionals, between leaving secondary education to qualification. It is not known the total screening costs per year for vision screening are, or what the total costs per child per year for vision screening are, nationally.
9.2 Cost of treatment for amblyopia
The estimated costs of treatment for typical patients with refractive amblyopia and strabismic amblyopia, including follow-up, are not known.
9.3 Cost of Treatment for strabismus
The estimated costs for strabismus surgery, including follow-up, are not known.
9.4 Cost of treatment for cataract
The estimated costs for congenital cataract surgery, including follow-up of deprivation amblyopia, are not known.
14
10 References
The World Bank (2018a). Population, total | Data. [online] Available at: https://data.worldbank.org/indicator/SP.POP.TOTL?locations=LU [Accessed 10 December 2018].
The World Bank. (2018b). Birth rate, crude (per 1,000 people) | Data. [online] Available at:
https://data.worldbank.org/indicator/SP.DYN.CBRT.IN?locations=LU [Accessed 10
December 2018].
The World Bank. (2018c). Population density (people per sq. km of land area) | Data. [online] Available at: https://data.worldbank.org/indicator/EN.POP.DNST?locations=LU [Accessed 10 December. 2018].
The World Bank. (2018d). Mortality rate, infant (per 1,000 live births) | Data. [online] Available at: https://data.worldbank.org/indicator/SP.DYN.IMRT.IN?locations=LU [Accessed 10 December 2018].
The World Bank. (2018e). Life expectancy at birth, total (years) | Data. [online] Available at: https://data.worldbank.org/indicator/SP.DYN.LE00.IN?locations=LU [Accessed 10 December 2018].
The World Bank. (2018f). Death rate, crude (per 1,000 people) | Data. [online] Available at:
https://data.worldbank.org/indicator/SP.DYN.CDRT.IN?locations=LU [Accessed 10
December 2018].
World Health Organisation (WHO). (2016a). Health Infrastructure - Data by country. [ONLINE] Available at: http://apps.who.int/gho/data/view.main.30000. [Accessed 10 December 2018].