This is a repository copy of Experimental photothermal performance of nanofluids under concentrated solar flux.
White Rose Research Online URL for this paper: http://eprints.whiterose.ac.uk/133624/
Version: Accepted Version Article:
Amjad, M, Jin, H, Du, X et al. (1 more author) (2018) Experimental photothermal
performance of nanofluids under concentrated solar flux. Solar Energy Materials and Solar Cells, 182. pp. 255-262. ISSN 0927-0248
https://doi.org/10.1016/j.solmat.2018.03.044
© 2018 Elsevier B.V. This manuscript version is made available under the CC-BY-NC-ND 4.0 license http://creativecommons.org/licenses/by-nc-nd/4.0/.
eprints@whiterose.ac.uk https://eprints.whiterose.ac.uk/
Reuse
This article is distributed under the terms of the Creative Commons Attribution-NonCommercial-NoDerivs (CC BY-NC-ND) licence. This licence only allows you to download this work and share it with others as long as you credit the authors, but you can’t change the article in any way or use it commercially. More
information and the full terms of the licence here: https://creativecommons.org/licenses/
Takedown
If you consider content in White Rose Research Online to be in breach of UK law, please notify us by
Experimental assessment of the photothermal
conversion performance of six nanofluids
Muhammad Amjad1, 2, Ghulam Raza1, Haichuan Jin1,4, Xiaoze Du3, Dongsheng Wen1,4*
1
School of Chemical and Process Engineering, University of Leeds, Leeds, LS2 9JT, UK
2
Department of Mechanical Engineering, University of Engineering and Technology Lahore (KSK Campus), Pakistan.
3
School of Energy, Power and Mechanical Engineering, North China Electric University, Beijing 102206, P.R.China.
4
School of Aeronautic Science and Engineering, Beihang University, Beijing, 100191, P.R.China
Abstract: Nanoparticle-based direct solar absorption is a promising technology for future solar
thermal systems. Having so many individual studies on different nanomaterials independently
for solar energy harness, a comprehensive comparison of photothermal conversion
characteristics of various nanofluids at the same experimental conditions is much needed. The
photothermal conversion performance of six commonly used nanomaterials in direct absorption
solar collectors (DASC) is investigated under a focused solar simulator (i.e. 12 Suns) with
deionized water as the base fluid. The concentration of each nanofluid is kept the same, and their
photothermal efficiencies and specific absorption rates are determined. The results show that all
the nanofluids have higher solar energy absorption than the base fluid and silver turned out to be
the best amongst all. The photothermal conversion efficiency of silver is 52.2% and its
enhancement in the photothermal performance is almost 100% over the base fluid within the
experimental domain. In addition, the contribution of sensible heating and latent heat of
*
Corresponding author. Tel.: 0044-113-3432678; fax: 0044-20-78825003. Email address: d.wen@leeds.ac.uk
Graphical abstract:
Localized heating of nanoparticles under the radiation flux
Solar radiation flux
Research Highlights:
Photothermal performance of six mostly used nanofluids in direct absorption solar
collection was studied quantitatively under similar experimental conditions.
Silver and iron nanofluids enhanced photothermal conversion performance by 100% and
70.3% respectively as compared to deionized water
Specific absorption rate of silver nanoparticle was 2.33 kW/g, which was the highest
amongst all the nanofluids compared in this investigation.
The enhancement in photothermal performance is examined quantitatively in terms of
Keywords: Nanofluid, photothermal conversion, nanoparticle, direct absorption, sensible heat,
vapor generation
1. Introduction
With increasing concerns over global warming and environmental issues, developing renewable
energy is becoming more and more important to secure our energy needs. Solar energy is the
most abundant source of energy and is easily accessible. However making efficient use of solar
energy is not an easy task [1]. A conventional plate-type of solar collector absorbs solar energy
on an absorbing plate, and transfers the heat via a wall to a working fluid running inside [2-4]. It
is a surface-based absorption, which limits the effective utilization of solar energy by creating a
large temperature difference between the absorbing plate and the working fluid, especially for
concentrated solar energy applications [5].
The limitations of surface absorption can be mitigated by a volume based solar absorption in
which the working fluid directly absorbs energy from the Sun, named as direct absorption solar
collection (DASC). The concept has its origin back in 1970 [6] and is receiving an increasing
interest and attention recently by using different nanoparticles [7-9]. Several nanomaterials like
silver [7, 10], gold [11-13], carbon nanotubes [14-16], copper [17], aluminum oxide (Al2O3) [1,
18-21], graphite [22], graphene [5], and titanium dioxide (TiO2) [2] have been examined
experimentally as well as numerically [23-28] for their capabilities to enhance solar absorption
individually. Light to thermal conversion characteristics of these nanofluids have been
investigated at various concentrations. For example Enio et al. [10] examined Ag nanofluid in a
volume concentration range of 0.0001625% to 0.065% while Zhang et al. [13] explored the
effect of adding Au nanoparticles in DI water in the range of 0.00028% to 0.0112 wt%. Yousefi
Qenbo et al. [17] employed Cu nanoparticles with 0.001% to 0.02% volume concentration.
Similarly Yousefi et al. [21] used 0.2% and 0.4 wt% , Hament et al. [1] used 0.001% to 0.05% by
volume and Said et al. [20] used 0.05% to 0.1% volume concentration of Al2O3 nanoparticles.
Except that Zhang et al. [29] who examined various types of nanoparticles at the same
concentration under 1 Sun, each of the above mentioned study was based on only one particular
type of particle. A comparative assessment of the performance of commonly used nanomaterials
for solar energy harness is much needed. The effect of these nanomaterials must be investigated
at the same concentration under similar operating conditions to reveal their photothermal
conversion performance.
This study identified six most commonly used nanomaterials in direct absorption solar collectors
and investigated their photothermal performance under a focused solar simulator (i.e., 12 Suns).
The bulk temperature rise of the nanofluids was measured with the help of three K-type
thermocouples under the LabVIEW environment. Their photothermal conversion efficiencies
and specific rate of absorption were obtained for comparison and possible mechanisms were
examined.
2. Materials and methods
2.1.Materials
Commercial nanopowders of six materials including Ag, Cu and Zn (Sigma Aldrich Co.) and Fe,
Si and Al2O3- (Nanostructured & amorphous material Inc.) were used as received. Tri-sodium
citrate (99.8%, Fisher Scientific) was used as the dispersant and stabilizing agent and DI water
2.2.Nanofluids preparation and their characterization
Different metallic nanopowders of Ag, Zn, Fe, Cu, Si and Al2O3- were selected to prepare
nanofluids by the two-step method. In this method, selected nanopowders were directly mixed
with a 0.5% of tri-sodium citrate solution in DI water. For instance, to prepare a nanofluid of
0.01% weight concentration, 0.01 g nanopowder was mixed with 99.99 g of a 0.5% aqueous
solution of trisodium citrate (TSC) under vigorous stirring. The acquired mixture was sonicated
by a high energy probe (1200 W) for 5 minutes where the temperature was controlled at 40o C.
The suspensions were then cooled down naturally to the room temperature and were sonicated
for 10 min before the photothermal conversion experiment.
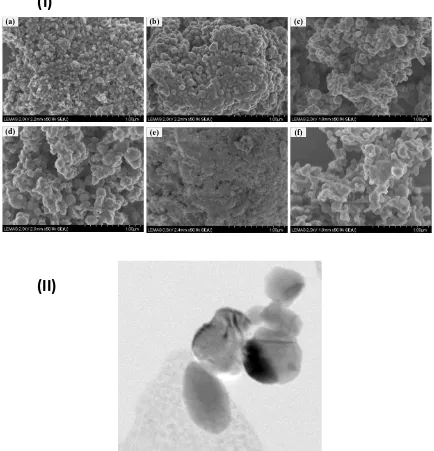
Morphological characterization of the nanopowders is given in Fig.1 where Fig (I) (a through f)
shows scanning electron microscopic (SEM) images of the nanopowders and transmission
electron microscopy (TEM) micrograph of silver nanopowder dispersed in 0.5% aqueous
solution of TSC is given in Fig.1 (II). The nanopowders were mostly clustered (Fig.1 (I)) before
the dispersion but became completely dispersed in DI water in the presence of stabilizing agent
after sonication. The dispersion stability can also be seen from the stable absorption spectra in
Fig.3. The optical absorption of these nanofluids was checked by a UV-Visual spectrometer
(UV-1800, Shimadzu) using a high precision cell (made of HOQ 310H) with light path of 10 mm.
The primary particle size range of the nanopowders as supplied by the suppliers is given in
Table 1.
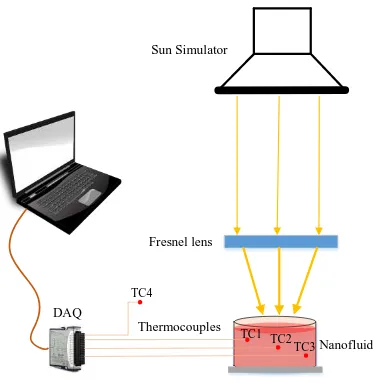
2.3.Experimental setup
The photothermal conversion characteristics of the prepared nanofluids were investigated using a
solar simulator (Newport Co.). It has a class AAA certification to JIS C 8912, and ASTM E
filters (known as Air Mass filters) to correct the light output to closely match the solar spectrum.
An air mass filter AM1.5G was used to simulate the direct solar spectrum when the Sun was at a
zenith angle of 48.20 (ASTM E891). The sun simulator has a spectral match 0.75-1.25% fraction
of ideal percentage, 2% non-uniformity of irradiance and ± 2% spectral instability according to
ASTM Class AAA standard. A schematic view of the experimental setup is presented in Fig.2.
A petri dish of 5.8 cm diameter was used to contain the sample. The bulk temperature change
was measured by three K-type (Omega 5TC-TT-K-36-36) thermocouples (TC), which were
positioned at an angular position of 120o at three representatively depths: just under the top
surface of the fluid, at the middle and close to the bottom of the petri dish but not in contact. A
fourth thermocouple was used to measure the variation of room temperature. The data were
registered by a data acquisition device (NI SCXI-1303) under the LabVIEW environment at a
sampling rate of 1 Hz. The uncertainty in temperature measurement was calibrated as ±0.25 oC.
The sample container was rinsed with DI water before each experiment to avoid inter-sample
contamination.
A Fresnel lens of 5.5 x 5.5 inch2 with a focal length of 10 inch was used to focus the output light
onto a nanofluid sample. The focused intensity of light was measured as 12 suns with the help of
a solar intensity meter.
3. Results and analysis
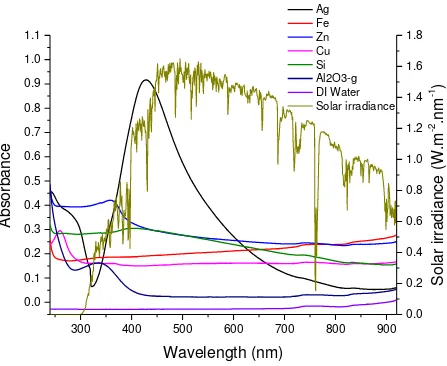
3.1.Optical absorbance
Water is a poor absorber of the solar energy in the visible light spectrum where most of the solar
energy is contained as can be seen from Fig. 3. Solar absorption of water can be significantly
the optical absorptivity of the prepared nanofluids was checked by a UV-Vis spectrometer using
a high precision quartz cell with light path of 10 mm. The optical absorbance spectra and spectral
solar irradiance are shown in Fig. 3.
Different metallic nanofluids have different optical absorption peaks over the visible spectrum.
The absorption peak of silver nanoparticles is the strongest amongst all the nanofluids compared
at the same particle concentration of 0.01 wt. % (Fig. 3). This is due to the strong localized
surface plasmonic effect in silver nanoparticle that makes it different from the others. The
plasmonic resonance frequency of silver nanofluid can be seen around 430 nm from Fig. 3,
which is almost the beginning of the visible band of the solar spectrum.
Compared with silver, the optical absorbance of other nanofluids in this study has mostly their
absorption peaks in the UV to visible region. Though the absorption peaks of Fe, Si, Cu
nanofluids are not very strong in the UV region, the flat absorption curve in the visible region
shows that their absorption is far much better than water at such a low weight concentration. The
optical absorbance curve of Al2O3- nanofluid is almost similar to that of DI water in the visible
region, which is also reflected in the temperature curves, as descripted below.
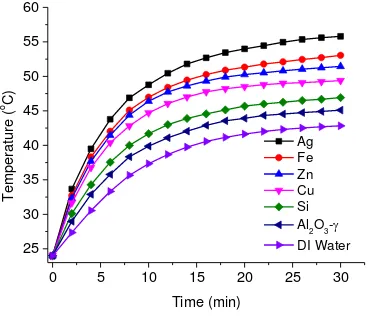
3.2.Bulk fluid temperature
The temperature of the nanoparticles in the nanofluid can be assumed as the temperature of the
bulk fluid due to very small nanoparticle concentration i.e. only 0.01% by weight. Deionized
water and sample of each fluid was heated for a minimum period of 30 min under the solar flux
of 12 suns. The bulk fluid temperature change was measured using three thermocouples and the
average bulk temperature ( , where and are temperatures
given in Fig.4. The corresponding mass loss due to vaporization of the fluid was measured with a
digital microbalance and is given in Fig.5.
As it can be clearly seen from Fig.4 that the average temperature variation in all the fluid
samples is almost linear at the start of the experiment, and this linearity is lost as the experiment
is continued Such a linearity at the start of the experiment is because almost all of the energy is
absorbed by the nanofluid volume and there is negligible heat leakage to the surroundings, Fig 6
(a). But as the temperature of the nanofluid increases, the temperature difference between the
sample and the surrounding increases, which results in increased heat loss to the ambient and
subsequently deviation from the linearity. As the temperature difference goes to the maximum
value within the experimental settings, further rate of increase in temperature gets smaller and
smaller, as can be seen at the later stage of the experiment in Fig.4. In comparison with
deionized water, all of the nanofluids have higher temperature gradients. In the order of the
nanofluids with respect to their peak temperature, silver nanofluid is at the highest position,
followed by Fe, Zn, Cu and Si as can be seen from Fig.4.
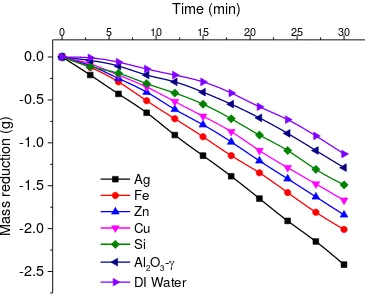
3.3.Mass loss of nanofluids due to evaporation
The mass loss of the sample due to vaporization was measured by an electronic scale, as shown
in Fig.2, and is given in Fig. 5 over a 30 min time period. The mass loss of the sample of DI
water and nanofluid is proportional to the fluid bulk temperature rise shown in Fig. 4. Under the
effect of a low light flux from the solar simulator, most of the energy was consumed in heating
the bulk fluid at the initial stage of the experiment, as can be seen by the contribution of sensible
heat and latent heat in Fig. 6 (b) for the case of silver nanofluid. But as the experiment proceeds,
loss to the ambient increases with the increase in overall temperature of the sample volume (Fig.
6 (b) ).
3.4.Photothermal efficiency
As the overall temperature of the nanofluid sample is small, it can be believed that temperature
of the nanoparticles and the surrounding fluid is same. For smaller fluid depths and overall
homogeneous temperature distribution in a fluid volume, the light to heat conversion transient
efficiency can be calculated by the relation in Eq. (1);
(1)
where and represent the specific heat capacity (J/kgK) and mass (kg) and the subscripts and
represent water and nanofluid respectively, is the average (( ) change in
temperature in time of three thermocouples, is the solar irradiance, which is equal to 11.6 kW/m2
in this work and is the illumination area of the nanofluid sample, is the latent heat of
vaporization of water at 1atm and is mass loss of the sample in time . As the overall
particle concentration is very small so the , and the Eq. (1) can be reduced
to Eq. (2);
(2)
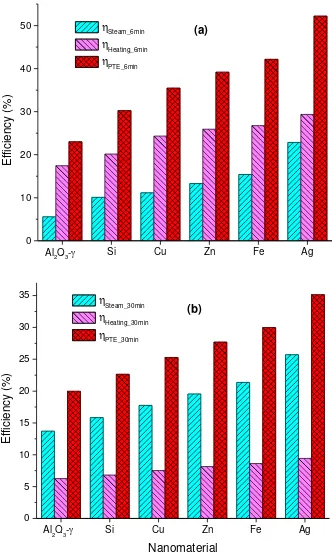
Light to heat conversion efficiency including sensible heating and vapor generation efficiencies
of various nanosuspensions with 0.01 wt. % concentration for initial stage of heating for 6 min is
shown in Fig. 7 (a) and for total experiment duration in Fig 7. (b). Comparing with the base fluid,
the photothermal conversion efficiencies of nanofluids are significantly high. The average fluid
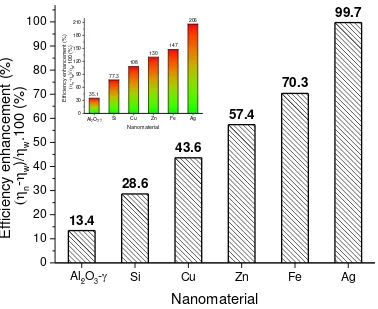
Ag has the highest efficiency as compared to the base fluid. The enhancement in efficiency over
the experimental domain is shown in Fig.8 while the inset shows the efficiency enhancement in
the first 6 min duration over the base fluid.
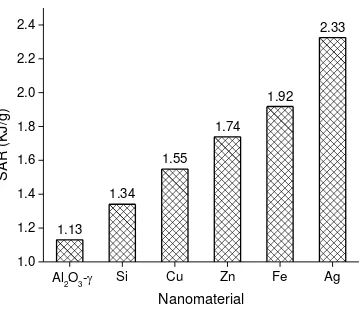
3.5.Specific absorption rate
Other than photothermal efficiency, specific absorption rate (SAR) is an important quantitative
tool to evaluate the ability of the nanoparticles to absorb energy absorption. The energy absorbed
per unit mass of the nanoparticles is known as SAR, used to describe the photothermal
performance of nanofluids. SAR (kW/g) of nanofluids can be calculated using Eq. (3)
(3)
where and represent the specific heat capacity (J/kgK) and mass (kg) of base fluid and
and represhent specific heat capacity and mass of nanoparticles. and show the
change in temperature of nanofluid and water in time respectively. Within the scope of this
work (( and hence the SAR can be approximated as in Eq. (4)
(4)
Fig. 9 shows the SAR of the nanofluids compared with the base fluid for a 0.01% concentration
by weight. Clearly from Fig. 9, the SAR of silver nanoparticles is higher than any other
nanoparticles and the results are consistent to that of Enio et al. [10] . The ability of plasmonic
nanoparticles to absorb solar energy is much better than that of many magnetic nanoparticles
under such a low light heat flux as described by [30]
4. Discussion
Photothermal performance of the nanoparticles suspended in a base fluid cannot be predicted
photothermal conversion performance of different nanofluids is investigated experimentally
based on transient bulk temperature rise and the latent heat of vaporization of the nanofluid
sample in this study. All nanomaterials showed a significantly higher photo energy absorption
behavior compared to the base fluid and the plasmonic silver nanofluid had the best
performance , which is in accordance with various individual studies [7, 10].
The average bulk fluid temperature of three thermocouples and corresponding mass change due
to vaporization were used to determine the photothermal conversion efficiency and specific
absorption rate of the nanofluid samples to compare with the base fluid. The temperature
variation is almost linear with time at the initial phase of exposure to solar flux and as the time
elapse, this temperature gradient becomes flat (Fig. 4). The linear change in temperature at the
start is due to the minimum heat loss to the ambient. At the later stage, the thermal loss to the
surroundings suppresses the heat utilization, the overall photothermal efficiency of the system is
decreased consequently.
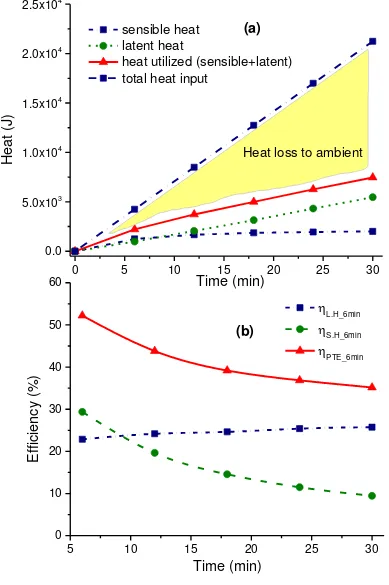
The heat utilization and its distribution to sensible heat, latent heat and ambient loss for the case
of silver nanofluid is shown in Fig. 6. The sensible heat and latent heat of vaporization of the
silver nanosuspension as shown in Fig 6 (a) are almost equal at the very beginning of the
experiment while the latent heat of vaporization part of the utilized energy keeps on increasing
over the sensible heat part with the passage of time. This increasing trend of latent heat continues
untill the end of the experiment while the increase rate of sensible heat of the sample is very low
especially at the last phase of the experiment. The corresponding efficiency of the sensible
heating and vapor generation are shown Fig 6 (b), which shows a gradual decrease in overall
the efficiency of the sensible heating and that of vapor generation are 29.4% and 22.8%
respectively, which are decreased to 9.4% and 25.7% after 30 min. A dramatic change in the
heating efficiency over time shows a rapid loss of heat to the ambient while a slight variation in
the vapor generation efficiency signifies that the strong localized heat by silver nanoparticles
sustained vapor generation irrespective of the bulk fluid temperature within the experimental
domain.
A comparison of heating efficiency and vapor generation efficiency of various nanofluids
investigated based on initial phase (6 min) and over the domain of the experiment (30 min) is
presented in Fig 7. The ascending order of different nanofluids in terms of their overall
experimental photothermal performance is Al2O3-, Si, Cu, Zn, Fe and Ag based on 6 min and 30
min data shown in Fig. 7 (a) and Fig. 7 (b) respectively. It can be concluded from Fig. 7 (b) that
the efficiency of sensible heating for all the nanofluids is almost the same with little variation
over 30 min duration of exposure to solar flux and the major difference in between lies on the
evaporation effect. As revealed from Jin et al. (2016a, 2016b), there was large temperature
difference inside nanofludis under solar radiation, and the major effect for nanofluids lies on the
trapping of solar energy, especially at the surface layer. Under strong solar radiation (i.e. a few
hundred of Suns), the surface layer could become superheated and virgous boiling could occur,
albert the bulk fluid is still under subcooled condition. The current study revealed a similar trend.
Although the temperature was not high enough to cuase vigorous boiling, the major difference
among different nanofluids lies on the surface trapping and evaporation effect. The difference in
heating the bulk fluids, as shown by the sensible heating efficiency, is small among different
nanofluids. Most of the extra heat converted by nanopar4ticles is used to evaporate the fluid,
evaporation rate. Consequently, different nanofluids should be identified for different
applications. Taking desalination as an example, highly non-uniform temperature is preferred (i.e.
focusing heat on the surface) by using suitable nanoparticles, so most of the converted heat can
be used to evaporate instead of heating the bulk fluid.
The capability of the nanoparticles for this localized heating can also be determined by their
specific absorption rate (SAR), which is the ability of the nanoparticle unit mass to absorb
energy in given time. SAR value for silver nanoparticles is the highest amongst all compared
nanomaterials in this study (Fig. 9), followed by Fe and Zn nanofluids. The phenomenon of
localized heating is the highest in case of silver nanofluid due its strong plasmonic nature.
5. Conclusion
Light to heat conversion capabilities of various nanofluids have been investigated experimentally
under the focused light of a solar simulator. It was found quantitatively that the addition of small
fraction of nanoparticle in the base fluid can significantly enhance its photothermal conversion
performance. Comparing with the base fluid, the increasing order of nanofluids in this
investigation was Al2O3-, Si, Cu, Zn, Fe and Ag , and the major difference lied on the
evaporation efficiency. The enhanced performance of nanofluid was described in terms of
sensible and latent heat contribution to the photothermal behavior. Silver nanofluid achieved the
maximum enhancement of 99.7% in photothermal conversion efficiency compared to the base
fluid.
Acknowledgement
References
1. Gupta, H.K., G.D. Agrawal, and J. Mathur, An experimental investigation of a low temperature Al2O3-H2O nanofluid based direct absorption solar collector. Solar Energy, 2015. 118: p. 390-396. 2. Said, Z., et al., Performance enhancement of a Flat Plate Solar collector using Titanium dioxide
nanofluid and Polyethylene Glycol dispersant. Journal of Cleaner Production, 2015. 92: p. 343-353.
3. Sokhansefat, T., A.B. Kasaeian, and F. Kowsary, Heat transfer enhancement in parabolic trough collector tube using Al2O3/synthetic oil nanofluid. Renewable and Sustainable Energy Reviews, 2014. 33: p. 636-644.
4. Salavati Meibodi, S., et al., Experimental investigation on the thermal efficiency and performance characteristics of a flat plate solar collector using SiO2/EG water nanofluids. International Communications in Heat and Mass Transfer, 2015. 65: p. 71-75.
5. Liu, J., et al., A combined numerical and experimental study on graphene/ionic liquid nanofluid based direct absorption solar collector. Solar Energy Materials and Solar Cells, 2015. 136: p. 177-186.
6. Minardi, J.E. and H.N. Chuang, P -plate solar collector. Solar Energy, 1975. 17(3): p. 179-183.
7. Chen, M., et al., An experimental investigation on sunlight absorption characteristics of silver nanofluids. Solar Energy, 2015. 115: p. 85-94.
8. Luo, Z., et al., Performance improvement of a nanofluid solar collector based on direct
absorption collection (DAC) concepts. International Journal of Heat and Mass Transfer, 2014. 75: p. 262-271.
9. Mahian, O., et al., A review of the applications of nanofluids in solar energy. International Journal of Heat and Mass Transfer, 2013. 57(2): p. 582-594.
10. Bandarra Filho, E.P., et al., Experimental investigation of a silver nanoparticle-based direct absorption solar thermal system. Energy Conversion and Management, 2014. 84: p. 261-267. 11. Eustis, S. and M.A. El-Sayed, Why gold nanoparticles are more precious than pretty gold: Noble
metal surface plasmon resonance and its enhancement of the radiative and nonradiative
properties of nanocrystals of different shapes. Chemical Society Reviews, 2006. 35(3): p. 209-217. 12. Pérez-Juste, J., et al., Gold nanorods: Synthesis, characterization and applications. Coordination
Chemistry Reviews, 2005. 249(17 18): p. 1870-1901.
13. Zhang, H., et al., Photothermal conversion characteristics of gold nanoparticle dispersions. Solar Energy, 2014. 100: p. 141-147.
14. Rahman, M.M., et al., Effect of solid volume fraction and tilt angle in a quarter circular solar thermal collectors filled with CNT water nanofluid. International Communications in Heat and Mass Transfer, 2014. 57: p. 79-90.
15. Said, Z., et al., Analyses of exergy efficiency and pumping power for a conventional flat plate solar collector using SWCNTs based nanofluid. Energy and Buildings, 2014. 78: p. 1-9.
16. Yousefi, T., et al., An experimental investigation on the effect of pH variation of MWCNT H2O nanofluid on the efficiency of a flat-plate solar collector. Solar Energy, 2012. 86(2): p. 771-779. 17. He, Q., et al., Experimental investigation on photothermal properties of nanofluids for direct
absorption solar thermal energy systems. Energy Conversion and Management, 2013. 73: p. 150-157.
19. Mahian, O., et al., Entropy generation during Al2O3/water nanofluid flow in a solar collector: Effects of tube roughness, nanoparticle size, and different thermophysical models. International Journal of Heat and Mass Transfer, 2014. 78: p. 64-75.
20. Said, Z., et al., Experimental investigation of the thermophysical properties of AL2O3-nanofluid and its effect on a flat plate solar collector. International Communications in Heat and Mass Transfer, 2013. 48: p. 99-107.
21. Yousefi, T., et al., An experimental investigation on the effect of Al2O3 H2O nanofluid on the efficiency of flat-plate solar collectors. Renewable Energy, 2012. 39(1): p. 293-298.
22. Otanicar, T.P., et al., Nanofluid-based direct absorption solar collector. Journal of Renewable and Sustainable Energy, 2010. 2(3): p. 033102.
23. Hewakuruppu, Y.L., et al., Limits of selectivity of direct volumetric solar absorption. Solar Energy, 2015. 114: p. 206-216.
24. Lee, B.J., et al., Radiative Heat Transfer Analysis in Plasmonic Nanofluids for Direct Solar Thermal Absorption. Journal of Solar Energy Engineering, 2012. 134(2): p. 021009.
25. Lee, S.-H., et al., Extinction coefficient of water-based multi-walled carbon nanotube nanofluids for application in direct-absorption solar collectors. Micro & Nano Letters, 2014. 9(10): p. 635-638.
26. Saidur, R., et al., Evaluation of the effect of nanofluid-based absorbers on direct solar collector.
International Journal of Heat and Mass Transfer, 2012. 55(21-22): p. 5899-5907.
27. Tyagi, H., P. Phelan, and R. Prasher, Predicted Efficiency of a Low-Temperature Nanofluid-Based Direct Absorption Solar Collector. Journal of Solar Energy Engineering, 2009. 131(4): p. 041004. 28. Zhang, L., et al., Radiative properties of ionic liquid-based nanofluids for
medium-to-high-temperature direct absorption solar collectors. Solar Energy Materials and Solar Cells, 2014. 130: p. 521-528.
29. Zhang, H., et al., Dependence of Photothermal Conversion Characteristics on Different Nanoparticle Dispersions. Journal of Nanoscience and Nanotechnology, 2015. 15(4): p. 3055-3060.
30. Wen, D., Intracellular hyperthermia: Nanobubbles and their biomedical applications.
International Journal of Hyperthermia, 2009. 25(7): p. 533-541.
31. Otanicar, T.P., P.E. Phelan, and J.S. Golden, Optical properties of liquids for direct absorption solar thermal energy systems. Solar Energy, 2009. 83(7): p. 969-977.
32. Otanicar, T.P., et al., Spatially Varying Extinction Coefficient for Direct Absorption Solar Thermal Collector Optimization. Journal of Solar Energy Engineering, 2011. 133(2): p. 024501.
33. Mercatelli, L., et al., Absorption and scattering properties of carbon nanohorn-based nanofluids for direct sunlight absorbers. Nanoscale Research Letters, 2011. 6(1): p. 1-9.
include all relevant papers in our group (check my publication list)m including Jin et al. Nano Energy
List of Figures and tables
(a) (b) (c)
(f) (e)
(d)
(I)
[image:17.612.90.524.119.570.2](II)
Fig. 1 Morphological appearance of nanopowders (I) SEM images of nanopowders of (a) Copper, (b) Silver, (c) Iron, (d) Zinc, (e) Aluminum oxide- and (f) Silicon and (II) TEM
Fresnel lens
Nanofluid
Thermocouples
DAQ
Sun Simulator
TC4
TC1
[image:18.612.122.495.66.449.2]TC3 TC2
Fig. 2 Schematic view of the experimental setup showing the position of thermocouples and
300 400 500 600 700 800 900 0.0 0.1 0.2 0.3 0.4 0.5 0.6 0.7 0.8 0.9 1.0 1.1 Ag Fe Zn Cu Si Al2O3-g DI Water Solar irradiance
Wavelength (nm)
Ab
sorbance
0.0 0.2 0.4 0.6 0.8 1.0 1.2 1.4 1.6 1.8So
la
r
irradia
nce (W.
m
-2.nm
-1)
Fig. 3 Optical absorbance spectra of DI water based nanofluids (0.01 wt%) in the UV to Visible
0
5
10
15
20
25
30
25
30
35
40
45
50
55
60
Temperature (
o
C)
Time (min)
[image:20.612.108.480.106.425.2]Ag
Fe
Zn
Cu
Si
Al
2O
3-
DI Water
Fig. 4 Average transient temperature profiles of various nanofluid samples with 0.01% weight
-2.5
-2.0
-1.5
-1.0
-0.5
0.0
0 5 10 15 20 25 30
Mass r
edu
ction (g)
Time (min)
[image:21.612.102.467.73.373.2]Ag Fe Zn Cu Si Al2O3- DI Water
Fig. 5 Mass loss as a function of time for various nanofluids under a solar intensity of 12 Suns
0 5 10 15 20 25 30 0.0
5.0x10³ 1.0x10⁴ 1.5x10⁴ 2.0x10⁴ 2.5x10⁴
5 10 15 20 25 30
0 10 20 30 40 50 60
(b)
He
at
(J)
sensible heat latent heat
heat utilized (sensible+latent) total heat input
Heat loss to ambient
(a)
Time (min)
Ef
fici
en
cy
(%)
Time (min)
[image:22.612.113.502.80.665.2]L.H_6min S.H_6min PTE_6min
Fig. 6 Photothermal performance of silver nanofluid over a period of 30 minutes , (a)
latent heating efficiencies ( and respectively) and overall photothermal efficiency
. Si Cu Zn Fe Ag 0 10 20 30 40 50 (b) (a)
Al2O3-
E ff ici e n cy (%) Steam_6min Heating_6min PTE_6min
. Si Cu Zn Fe Ag
0 5 10 15 20 25 30 35
Al2O3-
[image:24.612.135.468.77.630.2]E ff ici e n cy (%) Nanomaterial Steam_30min Heating_30min PTE_30min
Fig. 7 Distribution of Photothermal conversion efficiency of various nanofluids into sensible
13.4
28.6
43.6
57.4
70.3
99.7
. Si Cu Zn Fe Ag
0 10 20 30 40 50 60 70 80 90 100 35.1 77.3 108 130 147 206
. Si Cu Zn Fe Ag
0 30 60 90 120 150 180 210
Al2O3-
Nanomaterial (n -w )/ w .100 (% ) Efficie ncy enha ncement ( %)
Efficie
ncy enha
ncement (
%)
Al2O3-
[image:25.612.101.479.170.479.2](
n-
w)/
w.100 (%
)
Nanomaterial
Fig. 8 Overall enhancement in photothermal conversion efficiency over the base fluid for full
experimental duration (i.e. 30 mins). The enhancement for first 6 min of the experiment is even
1.13
1.34
1.55
1.74
1.92
2.33
. Si Cu Zn Fe Ag
1.0 1.2 1.4 1.6 1.8 2.0 2.2 2.4
Al2O3-
SA
R (KJ/g)
[image:26.612.113.472.105.415.2]Nanomaterial
Fig. 9 Specific absorption rate of nanofluids based on data shown in Fig. 4
Table 1. Size range of various nanofluids
Nanomaterial size range Supplier
Cu 35-45 nm Sigma Aldrich Ag 50-60 nm Sigma Aldrich Zn 40-60 nm Sigma Aldrich